Dragonfly Doji candlestick pattern:
X
  • وقت
  • دکھائیں
Clear All
new posts
  • #1 Collapse

    Dragonfly Doji candlestick pattern:
    Dragonfly Doji candlestick pattern:

    Dear my friends"Dragonfly Doji" aik candlistick pattern hai jo market mein possible trend reversal ko indicate karta hai. Is pattern mein aik specific candle hoti hai, jiska appearance dragonfly ya helicopter ki tarah hota hai.Dragonfly Doji candlistick patter aik kisam ka candlistick pattern hota hy jis mein pricis aik jaice hote hein or forex market mmein open price hote hy or close price be hote hein candlistick tamam time frame aik jaice hote hein is chart pattern mein daily weaikly, 1Hours kay chart pattern bhe ho saktay hein.forex market mein dragonfly Doji os time bante hy jab kise assert ke price open hote hy bad mein yeh taize say gerte hy bad mein yeh wapis oper jate hy or is point par close ho jate hy jahan say yeh open howe hote hy.

    Click image for larger version

Name:	tyuio.jfif
Views:	36
Size:	15.7 کلوبائٹ
ID:	13014469
    Understanding Dragonfly Doji candlestick pattern :

    Dear forex members market mein yeh Doji candlistick pattern aik range kay inside mmeiforex tren kayy nechay ke taraf isharay ko indicate karte hy yeh aam tor par is bat ke taraf ishara hota hy keh forex market ke price ke majodah limit inside ke taraf ho jate hy.forex market ka yeh candlistick pattern tamam kisam kay period mein he ho sakta hy jab yeh candlistick pattern daily candlistick pattern mein banta hy or jab yeh weaikly candlistick chart pattern mein banta hy to is kamatlab hy yeh hy keh forex stock ai he price par ope hota hy ya phir bad mein close ho jata hy.jaisa keh nechay de gay tasweer mein bhe ap daikh saktay hein keh forex market mein aik long lower shadow ban sakta hy forex market kay kuch moamllat mein market ka upper shadow chota hota hy is ka elawah forex market mein jab candlistick chote hote hy to is ko hammer candlistick ka naam deya jata hy


    Trading Strategy with Dragonfly Doji candlestick pattern:

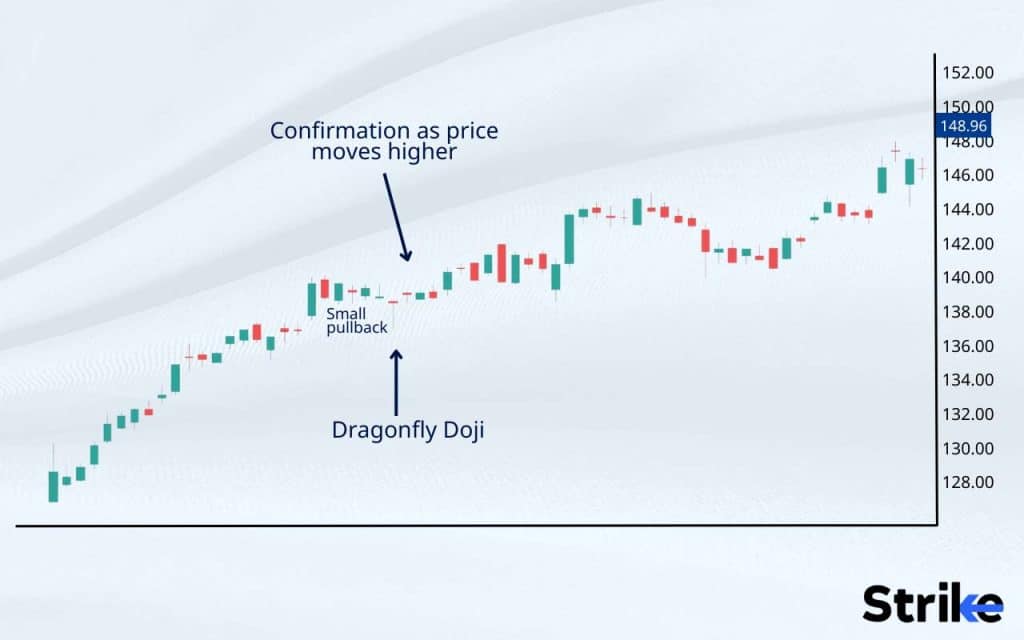
    Dear forex traders Dragonfly Doji ko trade karne se pehle confirmatory signals ka wait karna important hai. Confirmatory signals include karte hain ke overall market conditions reversal ko support karte hain.Entry point ko set karna important hai. Traders long position le sakte hain jab Dragonfly Doji complete ho jata hai.Stop loss ko set karna important hai taki nuksan se bacha ja sake. Stop loss ko recent lows ya support levels ke neeche set karein.Target ko set karein based on your risk-reward ratio. Aap apne target ko risistance levels ya previous highs ke aspas set kar sakte hain.Hamisha apne trade mein risk management ka dhyan rakhein. Position size ko control karein taki aap apne trading capital ko protect kar sakein.


  • <a href="https://www.instaforex.org/ru/?x=ruforum">InstaForex</a>
  • #2 Collapse

    Dragonfly Doji Candlestick Pattern Forex Mein: Ek Mukhtasar Guide

    Forex trading mein candlestick patterns ka istemal karna aam hai, aur Dragonfly Doji ek aham candlestick pattern hai jo traders ke liye mahatvapurn hai. Is article mein hum Dragonfly Doji ke bare mein gehri understanding hasil karne ki koshish karenge aur iska forex trading mein istemal kaise kiya ja sakta hai. Chaliye shuru karte hain!

    1. Introduction to Candlestick Patterns

    Candlestick patterns forex trading mein price action analysis ka ek mahatvapurn hissa hain. In patterns ke through traders price movements aur market sentiment ka anuman lagate hain. Har ek candlestick pattern apne unique characteristics aur interpretations ke saath aata hai, jo traders ko market direction aur possible reversals ke baare mein hint dete hain.

    Candlestick patterns ka use purane samay se ho raha hai, jab Japanese traders ne unhe develop kiya tha. In patterns ka naam unke shapes se aata hai, jaise ki Doji, Hammer, aur Dragonfly Doji. In patterns ko interpret karne ke liye traders ko candlestick ka body, shadows, aur relative positions analyze karna hota hai.

    2. What is a Dragonfly Doji?

    Dragonfly Doji ek single candlestick pattern hai jo typically ek trading session ya timeframe mein form hota hai. Iska appearance market sentiment ko indicate karta hai. Is pattern mein candle ka open aur close price almost same ya equal hote hain, aur neeche wala shadow lamba hota hai jo price ko neeche gaya tha. Upper shadow nahi hota ya bahut chota hota hai.

    Dragonfly Doji bullish reversal ya support level indicator ke roop mein interpret kiya ja sakta hai. Ye pattern price bottoming ya reversal ke indication ke liye use hota hai, khaas kar agar isko downtrend ke baad dekha jaye.

    3. Characteristics of Dragonfly Doji

    Dragonfly Doji candlestick pattern ke kuch mukhya characteristics hain jo isko recognize karne mein madad karte hain:
    • Equal or Small Body: Candle ka body chota hota hai aur open/close prices almost same hote hain.
    • Long Lower Shadow: Neeche wala shadow (ya tail) lamba hota hai, jo indicate karta hai ki price neeche gaya tha lekin phir se upar aaya.
    • No or Small Upper Shadow: Upper shadow nahi hota ya bahut chota hota hai, jo ki bullish sentiment ko reflect karta hai.

    Dragonfly Doji ka appearance ek candlestick chart par clear hota hai aur isko identify karna relatively simple hota hai, especially jab traders candlestick patterns ke basics ko acchi tarah se samajhte hain.

    4. Interpretation of Dragonfly Doji

    Dragonfly Doji ko interpret karte samay traders ko kuch important points ka dhyan rakhna chahiye:
    • Bullish Reversal Signal: Agar Dragonfly Doji downtrend ke baad form hota hai, to ye bullish reversal signal ho sakta hai. Iska matlab hai ki price neeche jaane ke baad buyers ne control regain kiya hai aur ab price upar jaane ke chances hain.
    • Support Level Confirmation: Agar Dragonfly Doji kisi important support level ke near form hota hai, to iska significance aur zyada hota hai. Support levels par is pattern ka use karke traders support level ka strength bhi analyze kar sakte hain.

    Dragonfly Doji ki interpretation subjective bhi ho sakti hai, aur isliye traders ko isko confirm karne ke liye aur technical indicators ka istemal karne ke liye recommended kiya jata hai.

    5. How to Identify Dragonfly Doji on Forex Charts

    Dragonfly Doji ko identify karna chart par kuch steps follow karke kiya ja sakta hai:
    • Check the Candle's Appearance: Candle ka body chota hona chahiye aur open/close price barabar ya bahut close hone chahiye.
    • Look for Long Lower Shadow: Neeche wala shadow lamba hona chahiye, indicating ki price neeche gaya tha lekin wapas upar aaya.
    • Minimal or No Upper Shadow: Upper shadow nahi hona chahiye ya bahut chota hona chahiye.

    In steps ko follow karke traders Dragonfly Doji ko identify kar sakte hain aur uske potential implications ko analyze kar sakte hain apne trading strategy ke hisaab se.

    6. Importance of Location

    Dragonfly Doji ka location bhi uske significance ko affect karta hai:
    • After Downtrend: Agar Dragonfly Doji downtrend ke baad form hota hai, to iska bullish reversal potential zyada hota hai. Is situation mein traders ko price ka bottoming process samajhna chahiye.
    • Near Support Levels: Support levels ke near hone par Dragonfly Doji aur bhi powerful ho sakta hai, kyunki support level se bounce hone ka indication deta hai.

    Location Dragonfly Doji ke interpretation mein crucial role play karta hai aur isko sahi samajhna traders ke liye important hai, taaki accurate trading decisions liye ja sake.

    7. Trading Strategies Using Dragonfly Doji

    Dragonfly Doji ke kuch popular trading strategies hain jo traders use karte hain:
    • Bullish Reversal Strategy: Agar Dragonfly Doji downtrend ke baad form hota hai, to traders long positions consider kar sakte hain, expecting a bullish reversal.
    • Confirmation with Next Candlestick: Agar next candlestick bullish hai aur volume bhi strong hai, to ye Dragonfly Doji ke signal ko confirm karta hai.
    • Combination with Support Levels: Support levels ke sath Dragonfly Doji ka combination karke traders apne entry points aur stop-loss levels ko define kar sakte hain.

    Ye strategies Dragonfly Doji ko effectively use karne mein madad karte hain aur traders ko potential profitable opportunities provide karte hain.

    8. Risk Management

    Har trading strategy mein risk management ka hona zaroori hai, aur Dragonfly Doji ke use mein bhi yeh principle apply hota hai:
    • Set Stop-loss: Har trade ke liye stop-loss level set karna important hai, taaki agar trade opposite direction mein move karta hai to losses minimize ho sake.
    • Define Target Levels: Target levels set karna equally important hai, taaki traders profit booking kar sake jab price expected direction mein move karta hai.
    • Position Sizing: Har trade mein appropriate position size choose karna zaroori hai, taaki risk aur reward balance maintain ho sake.

    Risk management Dragonfly Doji ke successful use ke liye critical hai, aur iske bina trading strategies effective nahi ho sakti.

    9. Real-World Examples

    Real-world examples se Dragonfly Doji ke use ka concept samajhna aur practical implications ko dekhna traders ke liye helpful hota hai. Historical forex charts par Dragonfly Doji ke instances dekhne se traders ko pattern ke implications aur outcomes ka better understanding hota hai.

    Kuch examples include:
    • Example 1: A historical chart par dekha gaya ki Dragonfly Doji ke baad price bullish reversal show kiya, confirming the pattern's reliability.
    • Example 2: Another instance mein Dragonfly Doji ne support level ke near form kiya aur uske baad price ne upar move kiya, indicating strong support level bounce.

    In examples se traders Dragonfly Doji ke real-world applications aur success rate ko analyze kar sakte hain, aur apne trading strategies ko refine kar sakte hain.

    10. Limitations of Dragonfly Doji

    Dragonfly Doji ke use mein kuch limitations bhi hote hain jo traders ko dhyan mein rakhna chahiye:
    • False Signals: Kabhi kabhi Dragonfly Doji false signals bhi generate kar sakta hai, especially choppy markets ya sideways trends mein.
    • Single Candlestick Reliance: Sirf ek candlestick pattern par depend karna risky ho sakta hai, aur isliye confirmation aur additional analysis zaroori hoti hai.

    Traders ko Dragonfly Doji ke limitations samajhna aur iske sahi context mein interpret karna important hai, taaki unka trading decision accurate ho sake.

    11. Psychological Aspect

    Market psychology Dragonfly Doji ke interpretation mein bhi important role play karta hai:
    • Buyer Sentiment: Agar Dragonfly Doji bullish reversal ke context mein form hota hai, to iska matlab hai ki buyers ne confidence regain kiya hai aur ab price upar move kar sakta hai.
    • Market Sentiment Shift: Market sentiment ke sudden shift ko identify karna Dragonfly Doji ke through possible ho sakta hai, jo ki traders ke liye profitable opportunities create karta hai.

    Traders ko market psychology aur sentiment ko samajhna aur Dragonfly Doji ke signals ko sahi dhang se interpret karna important hai.

    12. Combining with Other Indicators

    Dragonfly Doji ko other technical indicators ke sath combine karke confirm kiya ja sakta hai:
    • Moving Averages: Moving averages ke cross-over points Dragonfly Doji ke bullish reversal signals ko confirm karte hain.
    • RSI (Relative Strength Index): RSI ki overbought ya oversold levels Dragonfly Doji ke saath confirmation provide karte hain.
    • Volume Analysis: High volume Dragonfly Doji ke signals ko validate karta hai aur uske significance ko increase karta hai.

    Is tarah se Dragonfly Doji ko other technical tools ke sath combine karke traders apne trading decisions ko strengthen kar sakte hain aur more reliable signals generate kar sakte hain.

    13. Conclusion

    Dragonfly Doji candlestick pattern forex trading mein ek powerful tool hai jo price action analysis mein madad deta hai. Is pattern ko samajhna aur sahi tareeke se interpret karna har trader ke liye zaroori hai. Ab aapko is pattern ko identify karne mein aur trading strategies mein confidence hone chahiye.

    Is article mein humne Dragonfly Doji ke basics, interpretation, aur trading strategies ko cover kiya hai. Ab aapko practice aur experience ke through is pattern ko effectively use karna hoga. Is detailed guide mein humne Dragonfly Doji candlestick pattern ke mukhya aspects ko explain kiya hai, including its characteristics, interpretation, trading strategies, aur practical examples. Yeh information traders ko Dragonfly Doji ko effectively use karne mein help karega aur unhe market analysis mein confidence provide karega.
    • #3 Collapse

      Taaruf:

      Dragonfly Doji candlestick pattern ek bullish reversal pattern hai jo typically downtrend ke end par appear hota hai aur potential trend reversal ko indicate karta hai. Yeh pattern traders ko signal karta hai ke market mein selling pressure decrease ho raha hai aur buyers control lene ke liye ready hain, jo ke price ko upar le jaane ka potential rakhta hai.

      Click image for larger version

Name:	images - 2024-06-23T170315.164.png
Views:	27
Size:	4.9 کلوبائٹ
ID:	13014636

      Dragonfly Doji Ki Structure:

      Dragonfly Doji candlestick ek unique structure rakhta hai, jo typically yeh features show karta hai:
      1. No Real Body:
        • Dragonfly Doji ka open aur close price lagbhag same hota hai, jo ke ek thin horizontal line create karta hai. Yeh horizontal line real body kehlati hai.
      2. Long Lower Shadow:
        • Candlestick ka lower shadow bohot lamba hota hai, jo ke market mein initial selling pressure ko indicate karta hai, lekin buyers ne price ko recover kar liya hota hai.
      3. No Upper Shadow:
        • Dragonfly Doji mein upper shadow ya toh hota nahi hai, ya bohot chhota hota hai, jo ke buyers ki strength ko highlight karta hai.
      Click image for larger version

Name:	images - 2024-06-23T170309.736.jpeg
Views:	28
Size:	43.9 کلوبائٹ
ID:	13014634

      Forex Trading Mein Dragonfly Doji Ka Istemaal:
      1. Reversal Signal:
        • Dragonfly Doji downtrend ke baad appear hota hai aur potential bullish reversal ko signal karta hai. Yeh indicate karta hai ke market mein selling pressure ab decrease ho raha hai aur buyers market control lene ke liye ready hain.
      2. Confirmation:
        • Dragonfly Doji ko single candle pattern ke tor par consider karna risky ho sakta hai, isliye confirmation zaroori hoti hai. Confirmation ke liye next few candles observe karna chahiye jo bullish movement show karein.
      3. Entry Points:
        • Buy entry tab consider karni chahiye jab Dragonfly Doji ke baad ek bullish candlestick form ho aur higher close dikhaye. Yeh trend reversal aur buyers ki strength ko confirm karta hai.
      4. Stop-Loss Placement:
        • Proper risk management ke liye stop-loss order ko Dragonfly Doji ke low ke neeche place karna chahiye taake unexpected price movements se protection mil sake.
      5. Profit Targets:
        • Profit targets ko key resistance levels, previous swing highs, ya Fibonacci retracement levels ke basis par set karna chahiye. Yeh realistic aur achievable targets ensure karta hai.
      Click image for larger version

Name:	images - 2024-06-23T170259.807.png
Views:	26
Size:	11.4 کلوبائٹ
ID:	13014635

      Natija:

      Dragonfly Doji candlestick pattern forex trading mein ek powerful bullish reversal signal provide karta hai jo downtrend ke baad buyers ke strength aur market reversal ko indicate karta hai. Proper identification aur accurate interpretation ke sath, traders is pattern ka use karke profitable long positions identify kar sakte hain. Jaise kisi bhi trading strategy mein, proper risk management aur additional confirmation indicators ka use zaroori hai taake trading success ensure kiya ja sake.
      • #4 Collapse

        Dragonfly Doji Candlestick Pattern Forex Mein: Samajhne Aur Istemal Karne Ka Tareeqa

        Candlestick patterns Forex trading mein bahut ahmiyat rakhte hain. In patterns se traders market ki movement ko samajhte hain aur future price trends ko predict karte hain. Ek aham candlestick pattern jo frequently dekha jata hai wo hai Dragonfly Doji. Is article mein hum Dragonfly Doji candlestick pattern ke baray mein mukhtasar tafseelat aur uske istemal ka tareeqa bayan karenge.

        1. Candlestick Patterns Ki Ahmiyat: Forex trading mein candlestick patterns ka istemal price action analysis mein hota hai. In patterns se traders market sentiment aur price movement ka pata lagate hain.

        Candlestick patterns, jaise Dragonfly Doji, traders ko market dynamics aur sentiment samajhne mein madad karte hain. In patterns ke study se traders market ke potential reversals aur price movements ke predictions kar sakte hain. Candlestick patterns, especially those like Dragonfly Doji, jo specific market conditions aur trends ko identify karte hain, traders ke liye valuable tools hote hain.

        2. Dragonfly Doji: Aam Introduction: Dragonfly Doji ek single candlestick pattern hai jo price reversal ke indications deta hai. Iski appearance bullish market ke end ya bearish trend ke reversal point par hoti hai.

        Dragonfly Doji ka naam uske shape se aata hai, jismein candle ka body nazar nahi aata aur ek lambi shadow upper side par hoti hai, indicating ki price initially low hui thi, lekin by the end of the session price ne apni high achieve karli. Dragonfly Doji bullish ya bearish trend ke reversal points par dikhai deta hai, jo traders ko future price direction ke potential changes ke bare mein signal deta hai.

        3. Dragonfly Doji Ki Anatomy: Dragonfly Doji candlestick pattern mein body ki taraf koi ya toh negligible body hoti hai ya phir woh bilkul nahi hoti. Upper shadow lambi hoti hai jo price ki high ko indicate karti hai, jabke lower shadow absent ya bohat chhoti hoti hai.

        Dragonfly Doji ki anatomy ki baat karte hain, toh ismein candle ka body ya toh bilkul nahi hota ya phir bohot chhota hota hai, indicating ki open aur close prices almost equal hote hain. Upper shadow lambi hoti hai, jo ki session ke highest price ko represent karti hai, aur lower shadow absent ya bohot chhoti hoti hai, indicating ki low price par significant selling pressure nahi thi.

        4. Bullish Dragonfly Doji: Bullish Dragonfly Doji bearish trend ke baad dikhai deta hai aur iska matlab hota hai ke market ka bottom ban sakta hai. Ismein price open aur close barabar ya qareeb hoti hai lekin neeche ki taraf koi shadow nahi hoti.

        Bullish Dragonfly Doji bearish trend ke baad dikhai deta hai aur iska matlab hota hai ke market ka bottom ban sakta hai. Is pattern mein open aur close prices almost equal ya phir ek dusre ke qareeb hote hain, indicating ki initial selling pressure ke baad buyers ne control regain kiya hai. Neeche ki taraf koi shadow nahi hoti, indicating ki low price par significant selling pressure nahi tha.

        5. Bearish Dragonfly Doji: Bearish Dragonfly Doji bullish trend ke baad appear hota hai. Ismein bhi open aur close barabar ya qareeb hoti hai lekin upper shadow nahi hoti, aur neeche ki taraf lambi shadow hoti hai.

        Bearish Dragonfly Doji bullish trend ke baad dikhai deta hai aur iska matlab hota hai ke market ka top ban sakta hai. Is pattern mein open aur close prices almost equal ya phir ek dusre ke qareeb hote hain, indicating ki initial buying pressure ke baad sellers ne control regain kiya hai. Upper side par koi shadow nahi hoti, indicating ki high price par significant selling pressure nahi tha. Neeche ki taraf lambi shadow hoti hai, indicating ki low price par significant buying interest tha.

        6. Dragonfly Doji Pattern Ki Confirmation: Dragonfly Doji ki confirmation ke liye next candle ka behavior dekha jata hai. Agar next candle bullish hai aur Dragonfly Doji ke baad upar ki taraf move karta hai toh bullish reversal confirm hota hai.

        Dragonfly Doji pattern ki confirmation ke liye traders next candle ka behavior closely monitor karte hain. Agar next candle bullish hai aur Dragonfly Doji ke close price ke upar open hota hai, toh yeh bullish reversal ka strong indication hai. Is situation mein traders long positions enter kar sakte hain, expecting ki bullish trend continue hogi.

        7. Dragonfly Doji Ka Trading Strategy: Dragonfly Doji ko trading strategy mein integrate karne ke liye traders next candle ka wait karte hain. Agar next candle bullish confirm karta hai toh long position enter kiya jata hai.

        Dragonfly Doji ko trading strategy mein shamil karne ke liye traders ek confirmatory candle ka wait karte hain. Agar Dragonfly Doji ke baad next candle bullish close karta hai aur iske open price Dragonfly Doji ke close price ke upar hota hai, toh yeh strong buy signal hai. Traders is situation mein long positions enter karte hain, with appropriate risk management techniques ke saath.

        8. Stop Loss Aur Target Levels: Dragonfly Doji ke trade mein stop loss neeche ki taraf set kiya jata hai, neeche wali low ke qareeb. Target level upper ki taraf set kiya jata hai, jo ki previous resistance level ya price ki high ke qareeb hota hai.

        Dragonfly Doji trading strategy mein stop loss ko neeche ki taraf set kiya jata hai, neeche wali low ke just neeche, jisse ki trade mein minimal loss ho sake. Target level ko upper ki taraf set kiya jata hai, jaisa ki previous resistance level ya recent high price ke qareeb. Yeh approach traders ko defined risk-reward ratio provide karta hai, jo successful trading ke liye zaroori hai.

        9. Risk Management: Har trading strategy ki tarah, Dragonfly Doji pattern ke trade mein bhi risk management zaroori hai. Proper position sizing aur stop loss ka istemal kar ke trader apne risk ko manage karte hain.

        Dragonfly Doji pattern ko trade karte waqt risk management ka mahatva bahut zyada hota hai. Traders ko apne trades ke liye appropriate position size choose karna chahiye, taki har trade ka risk control mein rahe. Stop loss ka istemal kar ke traders apne maximum loss ko bhi define kar sakte hain, jisse ki unexpected market movements se bacha ja sake.

        10. Dragonfly Doji Ke Alternative Patterns: Dragonfly Doji ke alternative patterns jaise ki Hammer aur Inverted Hammer bhi hotay hain, jo bhi price reversal signals provide karte hain lekin slightly different shapes mein.

        Dragonfly Doji ke alawa bhi kuch aur candlestick patterns hote hain jo similar price reversal indications provide karte hain. Jaise ki Hammer pattern, jo ki neeche ki taraf long shadow ke saath dikhta hai aur bullish reversal indicate karta hai. Inverted Hammer pattern, jo ki upper ki taraf long shadow ke saath dikhta hai aur bearish reversal indicate karta hai. In patterns ko bhi traders price action analysis mein incorporate kar ke trading decisions improve kar sakte hain.

        11. Real-Life Examples: Real-life examples ke zariye Dragonfly Doji pattern ke istemal ka tareeqa samjha jata hai. Charts par examples dekh kar traders is pattern ko recognize aur interpret karne mein maharat hasil karte hain.

        Dragonfly Doji pattern ko samajhne ke liye real-life examples ka study karna bahut zaroori hai. Traders ko historical charts par Dragonfly Doji ke instances ko identify kar ke analyze karna chahiye, taki wo is pattern ke characteristics aur implications ko samajh sake. Real-life examples se traders ko pattern ki effectiveness aur uske different scenarios mein application samajhne mein madad milti hai.

        12. Psychological Aspect: Dragonfly Doji pattern ki psychological aspect yeh hai ke yeh market sentiment ka quick change ya reversal indicate karta hai. Iski wajah se traders confidence ke saath trading decisions lete hain.

        Dragonfly Doji pattern ki psychological aspect yeh hai ki iska appearance market sentiment ke sudden change ya reversal ko indicate karta hai. Is pattern ke dikhte hi, traders ka confidence strong ho jata hai, kyunki wo market direction ke potential changes ko anticipate kar sakte hain. Yeh confidence unhe sahi trading decisions lene mein madad deta hai.

        13. Dragonfly Doji Ki Limitations: Dragonfly Doji pattern ki limitations mein yeh shamil hain ke iske signals always accurate nahi hote aur kabhi kabhi false signals bhi generate ho sakte hain, isliye confirmatory indicators ka bhi istemal zaroori hota hai.

        Dragonfly Doji pattern ki limitations mein yeh shamil hai ki yeh signals hamesha accurate nahi hote, aur kabhi kabhi false signals bhi generate ho sakte hain. Isliye, traders ko is pattern ke signals ko confirm karne ke liye aur additional indicators ka bhi istemal karna chahiye, jaise ki volume analysis, trend lines, ya moving averages. Yeh approach traders ko more reliable trading signals provide karta hai.

        14. Conclusion: Dragonfly Doji candlestick pattern Forex trading mein ek valuable tool hai jo traders ko market trends aur reversals ke signals provide karta hai. Is pattern ko samajhne aur sahi tareeqe se istemal karne se traders apne trading strategies ko improve kar sakte hain.

        Is article mein humne Dragonfly Doji candlestick pattern ke mukhtalif aspects aur uske istemal ka tareeqa parha. Yeh pattern beginners aur experienced traders dono ke liye useful hai jo price action analysis ko apni trading strategy ka hissa banate hain. Trading mein safalta hasil karne ke liye yeh zaroori hai ke traders patterns ko samajhe aur unka istemal theek tareeqe se karein.Yeh tha mukammal article Dragonfly Doji candlestick pattern ke baray mein, jismein humne is pattern ki details aur uske trading implications ko discuss kiya. Agar aur koi sawaal ya clarification chahiye ho toh zaroor bataye.

        • #5 Collapse

          DRAGONFLY DOJI CANDLESTICK PATTERN

          What is dragonfly doji candlestick pattern:
          As salam o alikum dosto,Dragonfly Doji ik candlestick pattern hy jo trading charts main dikha jata hy. Ye pattern tab banta hy jab open, high or close prices ik level par hoti hain or low price bilkul neeche hoti hy. Is pattern ka matlab hy ke market main sell orders zyada the likin buyers ne price ko upar la diya, is sy ik strong bullish reversal ka signal milta hy.Dragonfly Doji ka matlab hota hy ke market main initially sellers dominate kar rahe the likin buyers ne end main price ko upar kar diya. Is sy ye signal milta hy ke market main trend reversal aa sakta hy. Agar ye pattern support level par banta hy to is ka matlab ye hy ke market main bullish reversal ho sakta hy.Dragonfly Doji candlestick pattern ik unique or powerful signal hota hy jo trading main support or resistance levels ko identify karne main madad karta hy. Ye pattern tab bantay hain jab opening, high, or closing prices almost equal hotay hain, or sirf ik long lower shadow hoti hy. Ye candlestick pattern signify karta hy ke market main bullish reversal aa sakta hy. Iska matlab hy ke buyers ne market ko push kiya hy or sellers ne apni position lose kar di hy, jiski wajah sy market end of the session par open price ke kareeb close hota hy.Dragonfly Doji ka asal significance tab samajh aata hy jab ye pattern kisi strong downtrend ke baad form hota hy. Ye ik strong indication ho sakta hy ke market bottom hit kar chuka hy or ab buyers market ko higher levels par le ja sakte hain. Is pattern ka accurate analysis bohot zaroori hy kyunki falsy signals bhi mil sakte hain agar isko context main dikha na jaye.


          Trading Strategy of Dragonfly doji candlestick pattern:
          1.Confirmation is Key:
          Hello friends, Always wait for confirmation of the pattern. This means obsyrving the next candlestick to ensure it aligns with the expected market direction (upward for bullish, downward for bearish).
          2.Entry Points:
          For Bullish Reversals: Dear After a downtrend, enter a long position if the next candle closes above the Dragonfly Doji’s high.
          For Bearish Reversals: Dear After an uptrend, consider a short position if the next candle closes below the Dragonfly Doji’s low.
          3.Setting Stop Losses:
          Dear buddies Place a stop loss just below the lower shadow of the Dragonfly Doji to limit potential losses. If the price drops below this level, it suggests the pattern has failed.
          4.Profit Targets:
          Friends, Set profit targets based on prior support and resistance levels or use other indicators like moving averages to determine potential exit points.

          • #6 Collapse

            Dragonfly Doji Candlestick Pattern: Forex Trading Mein Ek Mehfooz Rehnuma

            Forex trading mein candlestick patterns ki samajh bohot ahem hai. In patterns se traders market ke future movements ko predict karte hain. Dragonfly Doji ek aisa candlestick pattern hai jo traders ke liye khaas tor par important hai. Is article mein hum Dragonfly Doji ke bare mein mazeed maloomat aur uske forex trading mein istemal par ghaur karenge.

            1. Candlestick Patterns aur Unki Ahmiyat

            Candlestick patterns, forex trading mein price action ko samajhne ka ek powerful tool hai. Har candlestick ka apna specific interpretation hota hai jo traders ko market psychology aur possible price movements ke bare mein insight deta hai. Dragonfly Doji jaise patterns bullish reversal ke liye key indicators hote hain.

            2. Dragonfly Doji: Taaruf aur Tareef

            Dragonfly Doji ek single candlestick pattern hai jo ek specific market condition ko darshata hai. Ismein open, high aur close price barabar ya kareeb hoti hai, jabki low price niche hoti hai. Iska shape ek T-shape ki tarah hota hai jismein body bilkul upar hoti hai aur ek lamba lower shadow niche extend hota hai.

            3. Dragonfly Doji Ka Appearance

            Dragonfly Doji ka appearance unique hota hai aur ise identify karna relatively easy hota hai. Candle ki body kafi chhoti hoti hai aur lower shadow lamba hota hai, jo price ke lower levels tak extend hota hai. Upper shadow na hone ya bohot chhota hona Dragonfly Doji ke characteristics mein shamil hota hai.

            4. Psychological Significance

            Dragonfly Doji bullish reversal signal deta hai. Iska matlab hai ke jab market down trend mein hota hai aur Dragonfly Doji form hota hai, to yeh indicate karta hai ke bearish momentum khatam ho sakta hai aur bullish trend shuru hone ka indication ho sakta hai. Is pattern ko samajhne se traders ko market ke sentiment ka better understanding hota hai.

            5. Candlestick Anatomy: Understanding the Components

            Dragonfly Doji ki anatomy ko samajhna trading decisions mein madadgar hota hai. Yeh pattern typically lower shadow aur body ke size par focus karta hai. Jab lower shadow body se significantly lamba hota hai aur upper shadow negligible hota hai, to yeh bullish reversal ke liye strong confirmation deta hai.

            6. Trading Context: Kab Dragonfly Doji Dekhne Ko Milta Hai?

            Dragonfly Doji generally downtrend ke baad dekha jata hai. Jab market ka price neeche ja chuka hota hai aur fir se upar ki taraf move karne ka potential dikhta hai, tab traders Dragonfly Doji ko spot karte hain. Yeh ek potential trend reversal point indicate karta hai.

            7. Trading Strategies: Dragonfly Doji Ka Istemal

            Dragonfly Doji ka istemal karne ke liye traders ko confirmatory signals ka wait karna hota hai. Agar Dragonfly Doji ke baad ek bullish candle confirm hota hai, to yeh entry point ka strong signal hai. Stop loss placement aur target setting bhi strategy ke integral parts hote hain jo traders Dragonfly Doji ke istemal mein consider karte hain.

            8. Stop Loss Placement

            Dragonfly Doji ki trading strategy mein stop loss placement bohot zaroori hota hai. Stop loss normally pattern ke neeche, ya uske bottom ke thoda upar set kiya jata hai, taaki agar reversal expected result na de, to loss minimised ho sake.

            9. Target Setting

            Dragonfly Doji ke successful identification ke baad, traders target setting mein previous resistance levels ya Fibonacci retracement ke levels ko consider karte hain. Target setting bullish reversal ke expectation ke mutabiq hoti hai jo ki risk reward ratio ko maintain karne mein madadgar hoti hai.

            10. Risk Management

            Har trading strategy mein risk management bohot zaroori hota hai. Dragonfly Doji pattern ki trade mein bhi risk reward ratio ka dhyan rakha jata hai. Traders apne risk tolerance ke hisab se position sizes aur stop loss levels set karte hain.

            11. Real Life Examples: Dragonfly Doji Ka Practical Istemal

            Practical examples se traders ko samajhne mein asani hoti hai ke kaise Dragonfly Doji trading decisions mein madadgar ho sakta hai. Historical charts aur real-time market scenarios se traders ko insights milte hain ke Dragonfly Doji ka real-life mein kaise istemal hota hai.

            12. Dragonfly Doji Aur Dusre Candlestick Patterns Ke Comparison

            Dragonfly Doji ko doji patterns ke sath compare kiya jata hai, jaise ki gravestone doji aur dragonfly doji ke similarities aur differences ko samajhte hue. Is comparison se traders ko yeh samajhne mein madad milti hai ke kis situation mein Dragonfly Doji ka istemal sabse suitable hota hai.


            3. Market Psychology Behind Dragonfly Doji

            Market psychology ke angle se, Dragonfly Doji bullish reversal ka indication deta hai. Is pattern ke formation se traders ke confidence mein increase hota hai aur buying interest ko reflect karta hai. Market sentiment aur price action ke understanding se traders ke liye market ka future direction samajhne mein asani hoti hai.

            14. Common Mistakes in Dragonfly Doji Trading

            Traders ke liye common mistakes ke examples aur kaise unse bacha ja sakta hai, is par bhi roshni dali jati hai. Over-trading, incomplete analysis, ya phir incorrect pattern identification jaise mistakes se bachne ke strategies discuss kiye jate hain.

            15. Dragonfly Doji Ke Importance Aur Trading Success Mein Rol

            Successful traders Dragonfly Doji jaise patterns ko samajh kar market trends ko predict karte hain aur unka advantage lete hain. Yeh pattern market mein price action ko samajhne aur profitable trading decisions lene mein madad deta hai.

            16. Technical Analysis Tools Ke Sath Dragonfly Doji Ka Use

            Dragonfly Doji ke analysis mein traders technical analysis tools jaise ki RSI (Relative Strength Index), MACD (Moving Average Convergence Divergence), aur moving averages ka bhi istemal karte hain. Yeh tools pattern ke confirmation aur trend analysis mein madad dete hain.

            17. Learning Resources: Dragonfly Doji Ki Aur Maloomat Hasil Karne Ke Tareeqe

            Traders ke liye Dragonfly Doji aur candlestick patterns ke additional learning resources ka zikr. Books, online courses, webinars aur trading communities ke through traders apni knowledge aur skills ko enhance karte hain jo ki effective trading decisions lene mein help karte hain.

            18. Conclusion: Dragonfly Doji Ki Importance

            Dragonfly Doji ek powerful bullish reversal candlestick pattern hai jo traders ko market trends ke bare mein valuable insights deta hai. Isko samajhna aur istemal karna forex trading mein success ke liye zaroori hai. Successful traders apne trading strategies mein Dragonfly Doji jaise patterns ko integrate karte hain aur risk management ke principles ko follow karte hain.
            Is article mein humne Dragonfly Doji ke bare mein comprehensive information aur uske forex trading mein istemal par roshni dali. Traders ko is pattern ko samajh kar apni trading strategies mein shamil karne ke liye encouraged kiya jata hai. Dragonfly Doji ke sath practical experience aur risk management ki samajh forex trading mein success ke liye khaas zaroori hai.
            • #7 Collapse

              Dragonfly Doji Candlestick Pattern.

              Introduction.

              Dragonfly Doji ek candlestick pattern hai jo technical analysis mein istemal hota hai. Ye pattern traders aur investors ko market ke potential reversal points ko identify karne mein madad deta hai. Isme ek specific structure hoti hai jo market ki direction ke bare mein important information provide karti hai.

              Dragonfly Doji Kya Hai?

              Dragonfly Doji ek aisa candlestick pattern hai jisme open, high, aur close prices takreeban ek hi level pe hoti hain, aur ek lambi lower shadow hoti hai. Iska matlab hai ke trading session ke douran prices ne significant low hit kiya lekin wapas recover karke open price ke kareeb close hui. Yeh pattern asar tab hota hai jab downtrend ya uptrend ke akhir mein aaye.

              Iske Characteristics.
              1. Single Candlestick Pattern: Dragonfly Doji sirf ek candlestick se banta hai.
              2. Small Body: Iski body bohot chhoti hoti hai, kyunke open aur close prices ek hi level pe hoti hain.
              3. Long Lower Shadow: Iski ek lambi lower shadow hoti hai, jo market ke low ko indicate karti hai.
              4. No Upper Shadow: Is pattern mein upper shadow nahi hoti ya bohot chhoti hoti hai.

              Dragonfly Doji Ka Maqsad.

              Yeh pattern potential reversal ya market indecision ko indicate karta hai. Jab yeh downtrend ke baad appear hota hai, toh yeh is baat ki nishani hoti hai ke sellers ka pressure khatam ho raha hai aur buyers market mein aa rahe hain. Isi tarah, jab yeh uptrend ke baad appear hota hai, toh yeh market ke top ya reversal ki indication ho sakti hai.

              Interpretation.
              1. Bullish Reversal: Agar Dragonfly Doji downtrend ke end pe form hota hai, toh yeh ek bullish reversal ki nishani hota hai. Iska matlab hai ke market neeche se recover kar rahi hai aur upar ja sakti hai.
              2. Bearish Reversal: Agar yeh uptrend ke end pe form hota hai, toh yeh bearish reversal ka signal de sakta hai. Iska matlab hai ke market ki upward momentum khatam ho rahi hai aur niche ja sakti hai.
              3. Indecision: Yeh pattern market indecision ko bhi indicate kar sakta hai, jahan buyers aur sellers dono unsure hain ke agla move kya hoga.

              Trading Strategies.
              1. Confirmation Required: Dragonfly Doji ko akela use karna theek nahi hota, hamesha confirmation ka intezar karna chahiye. Next candlestick pattern ya volume analysis se confirmation mil sakta hai.
              2. Support and Resistance Levels: Is pattern ko support aur resistance levels ke sath dekhna chahiye. Agar yeh pattern support level pe form hota hai toh yeh strong bullish signal ho sakta hai.
              3. Risk Management: Hamesha stop-loss orders use karne chahiye taake potential losses se bacha ja sake. Yeh strategy risk management ke liye zaroori hoti hai.
              • #8 Collapse

                **Introduction **

                The Dragonfly Doji
                is a significant candlestick pattern observed in technical analysis. Here are its key characteristics:

                Shape: It forms when the open, high, and close prices are the same or very close to each other, indicating indecision in the market.

                Appearance: The candlestick has a small body (or no body at all) and a long lower shadow/wick. This lower shadow should be at least twice as long as the body of the candlestick.

                Significance: The Dragonfly Doji suggests a potential reversal of the current downtrend. It forms when sellers push the price lower during the trading session, but by the end of the session, buyers step in and push the price back to the opening level or higher.

                Market Context: For the Dragonfly Doji to be considered a more reliable signal, it should appear after a prolonged downtrend. It indicates that despite initial bearish pressure, buyers are gaining strength.

                Confirmation: Traders often look for confirmation signals such as higher closing prices in the subsequent trading session to confirm a bullish reversal.

                In summary, the Dragonfly Doji is named after its shape resembling a dragonfly, with a long lower shadow and small/no upper shadow. It suggests potential buying pressure and reversal when seen in the right market context.

                Let's delve deeper into the Dragonfly Doji candlestick pattern:

                Detailed Characteristics:

                Shape and Structure:
                The Dragonfly Doji forms when the open, high, and close prices are nearly the same or exactly the same. This results in a very small or non-existent body (the difference between the open and close prices).
                - The key feature is its long lower shadow (or wick), which is typically at least twice as long as the body of the candlestick. This shadow represents the low price reached during the trading session.

                Market Psychology:
                The pattern reflects a significant shift in market sentiment. Initially, during the trading session, sellers dominate and push the price lower. However, by the end of the session, buyers regain control and push the price back up to the opening level or even higher.
                This reversal from lower prices to closing near the opening price or higher suggests that buyers are willing to step in at lower levels, indicating potential exhaustion of selling pressure.

                Interpretation:
                In technical analysis, te Dragonfly Doji is interpreted as a bullish reversal pattern when it appears after a downtrend.
                It signals that despite attempts by sellers to drive the price lower, the session ends with buyers stepping in strongly. This can indicate a potential bottoming out of the price and a shift towards a bullish trend.

                Confirmation and Trading Strategies:
                Traders typically look for confirmation of the Dragonfly Doji pattern. This can include a higher closing price in the following session or further bullish price action.
                Some traders may enter long positions (buy) at the close of the Dragonfly Doji candlestick, with stop-loss orders placed below the low of the pattern for risk management.
                The pattern's effectiveness can be enhanced when it occurs near significant support levels or in conjunction with other technical indicators or patterns that suggest bullish momentum.

                Caution:
                While the Dragonfly Doji is a bullish reversal pattern, traders should always consider the overall market context, volume trends, and other factors to confirm the potential reversal. False signals can occur, especially if the pattern forms in a sideways market or lacks follow-through confirmation.

                Example Scenario:
                Imagine a stock has been declining for several days. Suddenly, a Dragonfly Doji candlestick appears on the daily chart:
                - Open: $10
                - High: $10.50
                - Low: $9.80
                - Close: $10.20

                In this case:
                - The body (open-close) is small ($10 to $10.20).
                - The lower shadow is long (from $9.80 to $10).
                - The upper shadow is very small or non-existent.

                This formation suggests that despite the attempt to push prices lower ($9.80), buyers were able to push the price back up, closing near the open ($10.20). This could indicate a potential reversal in the downtrend, especially if followed by further bullish confirmation.

                Understanding these detailed characteristics and market behaviors associated with the Dragonfly Doji can help traders make informed decisions based on technical analysis.

                The Dragonfly Doji is a candlestick pattern in technical analysis characterized by its small or non-existent body and a long lower shadow that is at least twice the length of the body. It typically forms after a downtrend and signals potential bullish reversal. The pattern reflects initial selling pressure followed by a strong rebound by buyers, suggesting exhaustion of bearish momentum. Traders often look for confirmation signals such as higher closing prices in subsequent sessions to validate the pattern's reliability before considering bullish positions.
                • #9 Collapse

                  Dragonfly Doji Candlestick Pattern:
                  Dragonfly Doji Candlestick Pattern stock market mein aik ahem technical analysis ka tool hai jo khas tor par reversal signals ko pehchanne ke liye istemal hota hai. Is pattern ko samajhna aur sahi tor par istemal karna bohot se tajiron ke liye faidemand sabit ho sakta hai.


                  Introduction:
                  Dragonfly Doji aik qisam ka Doji Candlestick Pattern hai jisme opening, closing, aur high price lagbhag barabar hoti hain, jabke low price bohot neeche hoti hai. Yeh pattern aksar us waqt banta hai jab market mein demand aur supply mein imbalance hota hai.


                  Pattern ki pehchaan:
                  1. Formation:
                  Dragonfly Doji tab banta hai jab ek lambi lower shadow ho aur koi upper shadow na ho. Iska matlab hai ke price ne trading session ke dauran kafi neeche tak safar kiya, magar session ke end tak wapas opening price ke aas paas aa gaya.
                  2. Trend Indication:
                  Yeh aksar market reversal ka indication deta hai, khas tor par agar yeh pattern downtrend ke end par bane. Yeh yeh zahir karta hai ke bears (bikri karne wale) ne pehle dominate kiya magar bulls (khareedne wale) ne session ke end tak control hasil kar liya.


                  Signal identification:
                  1. Bullish Reversal:
                  Agar downtrend ke end par Dragonfly Doji banta hai, to yeh bullish reversal ka signal ho sakta hai, yani market upar jaane ka imkaan hai.
                  2. Confirmation:
                  Is pattern ke baad aane wali bullish candle is signal ko confirm kar sakti hai. Yeh important hai ke traders confirmation ka intezar karein taake false signals se bacha ja sake.


                  Example:
                  Agar ek stock ka price pehle girta rahe aur phir ek session mein Dragonfly Doji banaye, to iska matlab ho sakta hai ke stock ne bottom touch kar liya aur ab rebound karne ka imkaan hai. Agar agli candle bullish ho, to yeh confirmation ho sakti hai ke price ab upar jaane lagega.


                  Conclusion:
                  Dragonfly Doji aik powerful candlestick pattern hai jo market reversals ko pehchanne mein madadgar hota hai. Isko sahi tarike se samajh kar istemal karne se traders apne trading decisions ko behtar bana sakte hain aur potential losses se bach sakte hain.


                  Click image for larger version

Name:	doji.png
Views:	23
Size:	107.5 کلوبائٹ
ID:	13016259
                  • #10 Collapse

                    Forex trading aur technical analysis mein candlestick patterns aik important role play karte hain. In patterns ke zariye traders market ki sentiment aur potential price movements ko understand kar sakte hain. Candlestick patterns mein Dragonfly Doji aik khas significance rakhta hai. Is article mein hum Dragonfly Doji candlestick pattern ko detail mein discuss karenge aur dekhenge ke yeh kaise identify hota hai aur isko trading mein kaise use kiya ja sakta hai.

                    Dragonfly Doji Candlestick Pattern Kya Hai?

                    Dragonfly Doji candlestick pattern tab banta hai jab open, high, aur close prices almost same hote hain aur low price significantly lower hota hai. Yeh pattern indicate karta hai ke market mein buying pressure strong hai aur sellers ne initially price ko neeche le jaane ki koshish ki magar buyers ne price ko wapas high level par close kar diya.

                    Characteristics of Dragonfly Doji

                    1. Long Lower Shadow:

                    Dragonfly Doji ka long lower shadow hota hai jo significant selling pressure ko show karta hai, magar yeh selling pressure buying pressure se overcome ho jata hai.

                    2. No Upper Shadow:

                    Is pattern mein upper shadow almost nahi hoti, ya bohot choti hoti hai. Yeh is baat ki nishani hai ke price high aur open/close levels ke beech bohot kam variation hai.

                    3. Open, High, and Close Prices:

                    Open, high, aur close prices almost same hote hain, jo buyers aur sellers ke beech equilibrium ko represent karta hai.

                    Significance of Dragonfly Doji

                    Dragonfly Doji pattern usually bullish reversal signal provide karta hai, especially agar yeh downtrend ke baad form ho. Yeh indicate karta hai ke market mein buyers dominate kar rahe hain aur price ko higher levels tak le ja sakte hain.

                    How to Identify Dragonfly Doji

                    1. Downtrend Context:

                    Dragonfly Doji ko downtrend ke context mein identify karna zaroori hai. Yeh pattern tab meaningful hota hai jab yeh downtrend ke baad appear ho.

                    2. Check for Lower Shadow:

                    Dragonfly Doji pattern mein long lower shadow hoti hai jo selling pressure ko indicate karti hai. Upper shadow ya to hoti nahi, ya bohot choti hoti hai.

                    3. Confirming Open, High, and Close Prices:

                    Open, high, aur close prices ko check karein ke yeh almost same hon. Yeh is baat ki confirmation hoti hai ke buyers ne price ko lower levels se wapas higher levels tak push kiya hai.

                    Trading with Dragonfly Doji

                    1. Confirmation:


                    Dragonfly Doji ke baad ek bullish confirmation candle ka wait karna zaroori hai. Yeh confirm karegi ke market sentiment bullish hai aur uptrend shuru ho sakta hai.

                    2. Entry Point:

                    Bullish confirmation candle ke close par entry lein. Yeh safer entry point hota hai jo potential uptrend ka benefit uthane mein madadgar hota hai.

                    3. Stop-Loss:

                    Stop-loss order ko Dragonfly Doji ke low ke neeche place karein. Yeh risk management strategy hai jo potential losses ko control karne mein madad karti hai.

                    4. Take-Profit:

                    Take-profit level ko predetermined resistance levels ya previous highs par set karein. Yeh profit booking ke liye important hai.

                    Example of Dragonfly Doji

                    Agar EUR/USD pair downtrend mein ho aur ek Dragonfly Doji pattern form ho jaye, to yeh indicate karta hai ke buyers market mein enter ho gaye hain aur price ko higher push kar rahe hain. Is pattern ke baad ek bullish candle ka wait karein aur uske close par entry lein. Stop-loss ko Dragonfly Doji ke low ke neeche set karein aur take-profit ko previous resistance level par set karein.

                    Conclusion

                    Dragonfly Doji candlestick pattern forex trading mein aik powerful tool hai jo potential bullish reversal ko indicate karta hai. Yeh pattern tab zyada significant hota hai jab yeh downtrend ke baad form hota hai aur buyers ke strong presence ko show karta hai. Is pattern ko sahi tarah se identify karna aur trading plan ke sath isko execute karna zaroori hai taake potential profits ko maximize kiya ja sake aur risks ko effectively manage kiya ja sake. Proper analysis aur confirmation ke sath, Dragonfly Doji forex market mein trading decisions ko enhance kar sakta hai.
                    • #11 Collapse

                      what is dragonfly Doji candlestick pattern

                      forex market mein dragonfly doji candlestick pattern aik kesam ka candlestick pattern hota hey jo keh forex market mein single otential trend reversal candlestick pattern hota hey yeh candlestik pattern pechlay price action kay analysis say he downside mein ya phir up side mein movement kar sakta hey jab forex market kay assert ke price high open close sab same hote hein
                      markt mein long lower shadow es bat ko identify karta hy keh candlestick kay doran mein selling jare the es ka matlab eh hota hey keh buyer price ko jazb karnay or selling ko oper ke taraf move karnay kay kabel hotay hein

                      Understanding Dragonfly Doji

                      forex market mein kame kay trend kay bad dragonfly Doji banana arket mein price kay ezafay ko indicate karte hey sell ka pressure kam ho jatay hey buy ka pressure increase ho jata hey forex market mein upper trend kay bad yeh zahair karta hey keh forex market mein ezafa hota ja raha hey dragonfly doji ke confirmation kay bad forex market mein price ke direction ke confirmation ho jate hey
                      forex market mein dragonfly doji pattern zyada tar nahi banta hey jab forex market mein yeh pattern banta hey to yeh aik intahai allamat ho sakte hey trend ke direction tabdel ho jate hey jab keh price mein ezafa ho jata hey sele kam say kam kuch hesay kay ley control hasel kar saktay hein jabkeh forex market ke price baghair kese tabdele kay tabdel ho jate hey or es kay bad forex market ke price mein ezafa ho jata hey
                      mumkana tor parberish wale dragonfly doji ko follow karnay wale candlestick ko reversal janay ke confirmation ke zaroorat hote hey jes kay sath candlestick following dragonfly doji ke confirmation ho jate hey candlestick open close or down sab aik jaisa hota hey ager confirmatio candlestick barah jate hey to yeh reversal wala signal fake ho jata hey or price jaree direction mein barah jate hey

                      Trading example with dragonfly Doji

                      forex market kay technical analysis mein up trend kay doran mein paida honay wala pattern hota hey kunkeh es kesam kay patternmein buying pressure mein tabdele hote hey pullback mumkana end ke taraf eshara frahm kar sakta hey forex market kay analysis kar aik long position mein entry talash kar saktay hein Doji pattern say buy karen or esko os time tak stop he rakh saktay hein jab tak yeh target ke price tak na ohnch sakay kuch trader mumkana losses ko kam karnay kay ley stop loss order ko kaim kar saktay hein or forex market ka trend omeed kay tor par wapes nahi aa sakta hey

                      bhali kay badlay bhali
                      • #12 Collapse

                        Dragonfly Doji Candlestick Pattern


                        Forex trading main candlestick patterns bohot important role play karte hain. In main se ek bohot hi significant pattern "Dragonfly Doji" hai. Yeh pattern traders ko market ka sentiment aur potential trend reversals identify karne main madad karta hai.
                        Click image for larger version

Name:	images.jpeg
Views:	15
Size:	7.1 کلوبائٹ
ID:	13016969
                        Dragonfly Doji Candlestick Pattern Kya Hai?

                        Dragonfly Doji candlestick ek aisa pattern hai jo tab banta hai jab opening, closing aur high prices lagbhag ek hi level par hoti hain, aur low price bohot neeche tak jati hai. Yeh ek single candlestick pattern hai jo market main indecision ko represent karta hai. Yeh pattern visually ek 'T' shape ki tarah dikhai deta hai, jahan par upper shadow ya bilkul nahi hoti ya bohot choti hoti hai aur lower shadow kaafi lambi hoti hai.

                        Pattern Ki Formation
                        Dragonfly Doji tab banta hai jab
                        Market open hoti hai kisi ek level par.
                        Uske baad prices neeche jati hain aur ek low point touch karti hain.
                        Phir prices wapas upar aati hain aur bilkul open price ke aas-paas close hoti hain.

                        Is formation se yeh pata chalta hai ke buyers ne price ko neeche se upar push kiya aur market main ek strong support level maujood hai.


                        Key Characteristics

                        No Upper Shadow
                        Dragonfly Doji main upper shadow ya to hoti hi nahi hai ya bohot choti hoti hai.

                        Long Lower Shadow

                        Lower shadow kaafi lambi hoti hai jo price ke neeche jane ka indication deti hai, lekin buyers ne price ko wapas upar push kiya hota hai.


                        Open, High aur Close Prices Same
                        Yeh teenon prices lagbhag ek hi level par hoti hain.

                        Market Sentiment Aur Interpretation
                        Dragonfly Doji pattern market main bullish reversal ka indication de sakta hai, khas tor par agar yeh downtrend ke baad form ho. Iska matlab hai ke market pehle neeche jati hai lekin buyers usko wapas upar le aate hain, jo future main price increase ka signal de sakta hai.


                        Trading Strategy

                        Support Level

                        Dragonfly Doji ko support level ke paas dekha jaye to yeh bohot significant ho sakta hai. Support level par yeh pattern buyers ke strong presence ka indication hai.


                        Confirmation Candlestick
                        Dragonfly Doji ke baad agla candlestick bullish ho to yeh confirmation hoti hai ke market ab upar ja sakti hai. Confirmation ke bina trade karna risky ho sakta hai.

                        Risk Management
                        Trading main hamesha stop loss lagana chahiye. Dragonfly Doji ke neeche stop loss set karna ek acha strategy ho sakta hai.


                        Examples in Forex Market
                        Forex market main Dragonfly Doji bohot commonly dekha ja sakta hai. Agar EUR/USD pair downtrend main ho aur support level par Dragonfly Doji form ho, to yeh trend reversal ka signal de sakta hai. Is pattern ko dekh kar experienced traders apni positions adjust karte hain aur buying opportunities dhundte hain.

                        Limitations

                        False Signals
                        Kabhi kabhi yeh pattern false signals bhi de sakta hai. Isliye hamesha confirmation ka wait karna chahiye.

                        Market Conditions
                        Yeh pattern har market condition main effective nahi hota. Sideways market main yeh zyada reliable nahi hota.

                        Note
                        Dragonfly Doji candlestick pattern Forex trading main ek powerful tool hai jo market ki indecision aur potential trend reversal ko identify karne main madad karta hai. Is pattern ko samajh kar aur effectively use karke traders apni trading strategies ko improve kar sakte hain. Lekin hamesha yad rakhen ke confirmation aur risk management zaroori hain taake aap apni investments ko protect kar saken aur long-term success hasil kar saken.


                        • #13 Collapse

                          Dragonfly Doji Candlestick Pattern in Forex Trading


                          Forex mein Dragonfly Doji candlestick pattern ek important technical indicator hai jo traders ke liye price action ka ek crucial signal deta hai. Is article mein hum Dragonfly Doji ke bare mein detail se baat karenge, uske characteristics, interpretation aur trading strategies ke bare mein.
                          1. Introduction to Dragonfly Doji Candlestick Pattern


                          Dragonfly Doji ek single candlestick pattern hai jo typically price reversal ke indications deta hai. Ye candlestick pattern market mein uncertainty aur price stability ka signal bhi ho sakta hai.

                          Dragonfly Doji ke formation mein upper wick absent hota hai aur lower wick nahi hota, iski wajah se yeh dragonfly ke jaise dikhta hai. Iska open, high, low aur close price almost same hote hain.
                          2. Understanding the Structure of Dragonfly Doji


                          Dragonfly Doji ka structure bahut unique hota hai. Ismein candle ka body bilkul upper wick ke bina hota hai, jabki lower wick either very short hota hai ya phir bilkul absent hota hai. Yeh candlestick shape dragonfly jaisa dikhta hai, jiski wajah se isko Dragonfly Doji kehte hain. Iska open, high, low aur close price almost same level par hota hai, indicating ke price movement during that period was very limited.
                          3. Characteristics of Dragonfly Doji


                          Dragonfly Doji ki key characteristics include:
                          • Absence of Upper Shadow: Iska sabse prominent feature hai upper shadow ka absent hona, indicating ke price high par koi significant selling pressure nahi tha.
                          • Absence or Short Lower Shadow: Lower shadow either bilkul absent hota hai ya bahut chota hota hai, indicating ke price low par bhi significant selling pressure nahi tha.
                          • Almost Equal Open, High, Low, Close: Candlestick ke open, high, low aur close almost same level par hote hain, indicating ke price movement negligible tha.
                          • Usually Occurs After a Downtrend: Dragonfly Doji candlesticks generally downtrend ke baad form hote hain, suggesting ke bearish trend ke baad bullish reversal ka possibility hai.
                          4. Significance of Dragonfly Doji in Forex Trading


                          Dragonfly Doji candlestick pattern bullish reversal ke liye powerful indicator hai jab market bearish trend ke baad reverse hone ki possibility ho. Jab traders Dragonfly Doji dekhte hain, especially after a prolonged downtrend, toh unhe bullish reversal ka expectation hota hai.

                          Is pattern ka significance market psychology se juda hua hai. Jab price initially low par open hota hai, sellers control mein hote hain lekin end of the period par buyers price ko upar le jaate hain, indicating ke buying pressure hai.
                          5. Psychological Interpretation of Dragonfly Doji


                          Dragonfly Doji candlestick pattern dekhne se traders ka ye samajh mein aata hai ke sellers ne initially control kiya tha lekin buyers ne end mein control regain kiya hai. Iski psychological interpretation yeh hai ke bearish trend ke baad price stability ke baad bullish movement ka potential hai.

                          Traders is pattern ko dekh kar market sentiment aur direction ko analyze karte hain. Dragonfly Doji bullish reversal ke potential ko highlight karta hai, suggesting ke buyers ne control regain kiya hai aur ab market price ko upar le jaane ka try kar raha hai.
                          6. Conditions Favoring Dragonfly Doji


                          Dragonfly Doji candlestick pattern market ke specific conditions mein form hota hai. Kuch key conditions include:
                          • Previous Downtrend: Is pattern ka formation usually downtrend ke baad hota hai, indicating ke bearish trend exhausted ho raha hai aur bullish reversal ka potential hai.
                          • Low Trading Volume: Is pattern ke formation time par low trading volume hota hai, indicating ke market mein activity kam hai aur price stability hai.
                          • Indecision or Uncertainty in the Market: Market mein indecision ya uncertainty hone par traders Dragonfly Doji dekh sakte hain, suggesting ke market direction clear nahi hai.
                          7. Trading Strategies Using Dragonfly Doji


                          Dragonfly Doji pattern ke basis par traders following strategies use karte hain:
                          • Bullish Reversal Confirmation: Agar Dragonfly Doji candlestick pattern downtrend ke baad form hota hai aur next candle bullish hai, toh ye bullish reversal signal ho sakta hai. Traders is signal ko confirmation ke liye use karte hain aur long positions enter karte hain.
                          • Stop Loss Placement: Dragonfly Doji ke low par stop loss placement karke risk management improve kiya ja sakta hai. Agar price downward move karta hai aur Dragonfly Doji ki low ko break karta hai, toh traders apne losses minimize kar sakte hain.
                          • Entry Points: Dragonfly Doji ke high breakout ke baad entry points determine kiya ja sakta hai. Jab price Dragonfly Doji high ko break karta hai, toh traders long positions enter karte hain bullish movement ke liye.
                          8. Real-World Examples of Dragonfly Doji in Forex


                          Real-world examples mein Dragonfly Doji pattern dekh kar traders ka confidence boost hota hai jahan pe price reversal hone ki expectations hote hain. Jab market mein significant downtrend ke baad Dragonfly Doji form hota hai aur next candle bullish move show karta hai, toh traders bullish reversal ka signal consider karte hain.

                          Traders historical charts aur real-time market analysis mein Dragonfly Doji pattern identify karte hain. Is pattern ki examples include various forex pairs aur timeframes jahan pe traders ne successful bullish reversals capture kiye hain.
                          9. Limitations and Considerations


                          Dragonfly Doji pattern ke saath trading karte waqt kuch limitations hain jaise ki false signals possibility aur market context ke misunderstanding. Isliye confirmatory signals aur risk management zaroori hain. Traders ko is pattern ke saath caution maintain karna chahiye aur sirf single indicator par rely nahi karna chahiye.

                          Traders ko historical data analyze karna chahiye aur multiple timeframes par Dragonfly Doji pattern ki consistency check karni chahiye. Limitations aur considerations include market volatility, false signals possibility, aur economic events impact jinhe traders ko monitor karna chahiye.
                          10. Combining Dragonfly Doji with Other Indicators


                          Dragonfly Doji ko other technical indicators jaise ki moving averages, RSI, aur trend lines ke saath combine karke more reliable trading signals generate kiye ja sakte hain. Traders isko confirmatory signals ke liye use karte hain aur overall market analysis improve karte hain.

                          Combining indicators improves trading accuracy aur reduces false signals possibility. Traders ko multiple indicators use karne par focus rakhna chahiye aur Dragonfly Doji pattern ke saath overall market trend aur momentum ko analyze karna chahiye.
                          11. Importance of Backtesting


                          Dragonfly Doji pattern ko effectively use karne ke liye traders ko historical data par backtesting karna chahiye taki iski reliability aur profitability measure ki ja sake. Backtesting helps traders understand pattern formation, market conditions, aur optimal entry/exit points identify karne mein help karta hai.

                          Traders historical charts analyze karte hain aur Dragonfly Doji pattern ke performance track karte hain various market conditions mein. Backtesting results ke basis par traders apne trading strategies improve karte hain aur pattern consistency verify karte hain.
                          12. Conclusion


                          Dragonfly Doji candlestick pattern forex trading mein ek valuable tool hai jo traders ko price reversal aur market direction ke signals provide karta hai. Is pattern ko samajhna aur sahi tareeke se apply karna traders ke liye critical hai. Trading mein success ke liye, traders ko is pattern ko samajhna aur effectively apply karna zaroori hai.

                          Dragonfly Doji pattern bullish reversal ke potential ko highlight karta hai aur traders ko market psychology aur price action analysis mein help karta hai. Is pattern ko identify karna, confirmatory signals use karna aur risk management follow karna traders ke liye important factors hain.
                          13. Risk Management with Dragonfly Doji


                          Dragonfly Doji pattern ke saath trading karte waqt risk management ka importance hai, jisme stop loss placement aur position size management include hota hai. Traders ko predefined risk tolerance set karna chahiye aur trading plan ko follow karna chahiye.

                          Is pattern ke saath trading karte waqt market volatility aur sudden price movements ka risk hota hai. Traders apne risk exposure ko control karte hain, stop loss use karte hain aur overall portfolio risk manage karte hain.
                          14. Future Trends and Adaptations


                          Future trends mein Dragonfly Doji pattern ke use mein improvements aur adaptations expected hain jisse ki modern market conditions mein bhi ye pattern effective rahe. Traders technological advancements aur quantitative analysis use karke Dragonfly Doji pattern ko enhance karte hain.

                          Traders ko latest market trends aur economic factors par focus rakhna chahiye jisse ki Dragonfly Doji pattern ke saath trading accuracy improve ho. Future trends mein traders algorithmic trading aur artificial intelligence ka use karke Dragonfly Doji pattern ke performance ko improve karte hain.
                          • #14 Collapse

                            **Dragonfly Doji Candlestick Pattern: Forex Trading Mein Iski Importance**
                            Forex trading mein technical analysis aur candlestick patterns market ke price movements aur reversals ko samajhne ke liye key tools hain. In patterns mein se ek fascinating pattern "Dragonfly Doji" hai. Yeh pattern market ke potential reversals aur trend changes ko signal karta hai aur trading decisions ko enhance karne mein madad karta hai. Is post mein hum Dragonfly Doji candlestick pattern ke features, formation aur forex trading mein iski importance ko discuss karenge.

                            **Dragonfly Doji Candlestick Pattern Kya Hai?**

                            Dragonfly Doji ek candlestick pattern hai jo ke market ke reversal aur indecision ko indicate karta hai. Yeh pattern ek single candlestick se milkar banta hai jiska shape ek dragonfly jaisa hota hai, isliye isse yeh naam mila hai. Dragonfly Doji pattern market ke low points par banta hai aur bullish reversal ka signal de sakta hai.

                            1. **Formation**:
                            - **Single Candlestick**: Dragonfly Doji ek single candlestick hoti hai jiska body bahut chhota hota hai aur closing price opening price ke aas-paas hoti hai. Is candlestick ka shadow (tail) long hota hai jo ke market ke low points se extend hota hai. Upper shadow (tail) ka length minimal ya nonexistent hota hai.
                            - **Characteristics**: Is pattern mein, body ke niche ek long shadow hota hai jo ke market ke low points ko show karta hai, aur upper shadow ya toh chhota hota hai ya bilkul nahi hota. Yeh long lower shadow market ke strong buying pressure ko indicate karta hai.

                            2. **Characteristics**:
                            - **Reversal Signal**: Dragonfly Doji pattern market ke downtrend ke baad bullish reversal ko signal kar sakta hai. Yeh pattern indicate karta hai ke sellers ne market ko neeche push kiya, lekin buyers ne price ko upar le aaya aur market ko recover kiya.
                            - **Indecision**: Dragonfly Doji bhi market ke indecision aur uncertainty ko indicate karta hai, jahan buyers aur sellers ke beech strong battle chal rahi hoti hai.

                            **Trading Procedure**

                            1. **Identification**:
                            - **Pattern Recognition**: Dragonfly Doji ko identify karte waqt, traders ko single candlestick ke shape aur shadow length ko dekhna hota hai. Accurate recognition se pattern ke signal ko validate kiya ja sakta hai.

                            2. **Entry Points**:
                            - **Buying Opportunity**: Dragonfly Doji ke baad, agar market mein bullish confirmation candlestick banta hai, to traders entry points ke liye buying opportunity consider kar sakte hain. Additional technical indicators jaise ke moving averages aur RSI bhi signal ko validate karne mein madadgar hote hain.

                            3. **Exit Points**:
                            - **Profit Targets**: Trading strategy mein profit targets aur stop-loss levels ko set karna zaroori hai. Dragonfly Doji ke baad, traders profit targets ko previous resistance levels aur stop-loss orders ko risk management ke liye set kar sakte hain.

                            **Risk Management**

                            Trading decisions lete waqt, risk management zaroori hai. Stop-loss orders aur proper position sizing se traders apni losses ko limit kar sakte hain aur market ke unexpected movements se protect ho sakte hain.

                            **Conclusion**

                            Dragonfly Doji candlestick pattern forex trading mein market ke potential bullish reversals aur indecision ko identify karne mein madad karta hai. Accurate pattern recognition aur careful analysis ke sath, traders is pattern ko successful trading strategies develop karne aur market ke behavior ko effectively interpret karne mein use kar sakte hain.
                            • <a href="https://www.instaforex.org/ru/?x=ruforum">InstaForex</a>
                            • #15 Collapse

                              **Dragonfly Doji Candlestick Pattern: Forex Trading Mein Samajhne Ka Tariqa**
                              Forex trading mein candlestick patterns ka use market trends aur reversals ko identify karne ke liye kiya jata hai. Dragonfly Doji candlestick pattern ek aisa formation hai jo market ke potential reversals ko signal karta hai. Aaj hum is pattern ko detail mein samjhenge aur dekhenge ke yeh Forex trading mein kaise kaam aata hai.

                              **Dragonfly Doji Kya Hai?**

                              Dragonfly Doji candlestick pattern ek single candlestick pattern hai jo ek specific shape banata hai aur market sentiment ko reflect karta hai. Yeh pattern typically downtrend ke baad develop hota hai aur bullish reversal signal provide karta hai. Dragonfly Doji ka naam iski shape ki wajah se pada hai, jo ek dragonfly ke wings jaisa hota hai.

                              **Pattern Ki Characteristics**

                              1. **Shape**: Dragonfly Doji ki shape ek long lower shadow aur chhoti body ke saath hoti hai jo upper shadow ke bina hoti hai. Is pattern ka body opening aur closing price ke near hota hai, aur lower shadow price ki lowest point ko dikhata hai.

                              2. **Price Action**: Is pattern ke dauran, price ek significant lower shadow banati hai, jo indicate karta hai ke sellers ne market ko niche push kiya, lekin closing ke waqt buyers ne price ko recover kar liya.

                              3. **Trend Reversal**: Dragonfly Doji bullish reversal signal provide karta hai, especially jab yeh downtrend ke baad develop hota hai. Yeh pattern indicate karta hai ke sellers ki dominance kam ho gayi hai aur buyers ka pressure increase hua hai.

                              **Trading Strategies**

                              1. **Confirmation**: Dragonfly Doji ki confirmation ke liye, traders ko next candlestick ke movement ko monitor karna chahiye. Agar next candlestick bullish (green) hoti hai aur Dragonfly Doji ke high ko break karti hai, to yeh confirmation hota hai ke bullish reversal ho raha hai.

                              2. **Entry Points**: Dragonfly Doji ke confirmation ke baad entry point consider kiya jata hai. Entry order ko pattern ke high ke upar place kiya jata hai, taake market ke bullish movement ka fayda uthaya ja sake.

                              3. **Stop-Loss Aur Target Levels**: Stop-loss ko Dragonfly Doji ke low ke niche set kiya jata hai, taake unexpected market movements se protection mile. Target levels ko pattern ke height aur previous resistance levels ke basis par estimate kiya jata hai.

                              **Conclusion**

                              Dragonfly Doji candlestick pattern Forex trading mein trend reversals ko identify karne ke liye ek valuable tool hai. Is pattern ki recognition aur confirmation ke through traders market ke potential reversals ko accurately predict kar sakte hain aur informed trading decisions le sakte hain. Practice aur experience se is pattern ko effectively use karne ke zariye, aap apni trading strategies ko enhance kar sakte hain aur market movements ko behtar samajh sakte hain.

                              اب آن لائن

                              Working...
                              X