what is evening star candlestick pattern
X
  • وقت
  • دکھائیں
Clear All
new posts
  • #1 Collapse

    what is evening star candlestick pattern
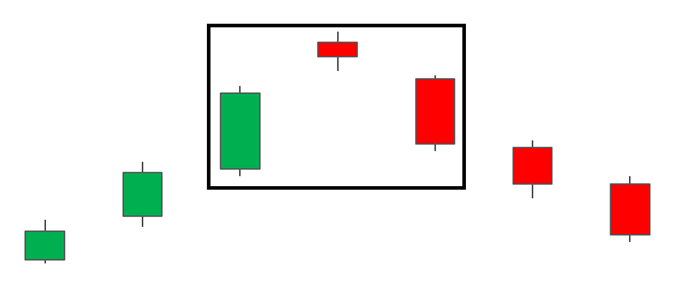
    what evening star candlestick pattern

    forex market mein evening star candlestick pattern aik kesam ka chart pattern hota hey jes mein technical analysis es bat ka pata laganay kay ley estamal keya jata hey lkeh forex market ka trend kab tabdel hota hey yeh aik bearish candlestick pattern hota hey jo keh forex market mein teen candlestick pattern hota hey aik bare white candlestick aik chote candlestick hote hey or kabhi kabhi yeh doji bhe ho sakte hey or aik bare red candlestick bhe ho sakte hey
    evening star trend ko upper trend kay sath attached kar sakta hey jo keh forex market mein es bat ko identify karta keh market mein oper ka trend kab end ho raha hota hey

    Understanding Evening Star Pattern

    evening star candlestick pattern bearish trend reversal candlestick pattern hota hey jo keh forex market mein up trend kay sab say oper zahair hota hey yeh forex market kay trend ko oper ke taraf trend ko kam karnay ke taraf eshara karta hey es say pehlay aik new step nechay ke taraf forex market kay chalnay ke taraf eshara karta hey or forex market mein down trend ke base bante hey
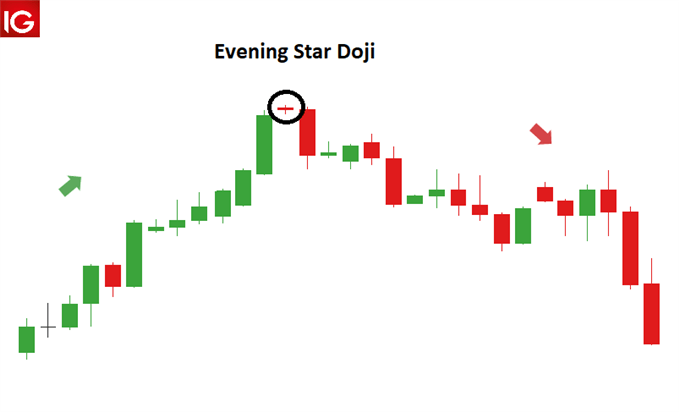

    Evening star Doji

    forex market mein evening star candlestick pattern 3 candlestick pattern hota center ke candle Doji bhe ho sakte hey yeh forex market mein aik he level par open bhe hote hey or close bhe aik he level hote hey yeh adam faisla bearish kay step ke rah humwar karta hey Doji kay bad bearish candlestick ka zahair hona bearish ke confirmation frahm karta hey


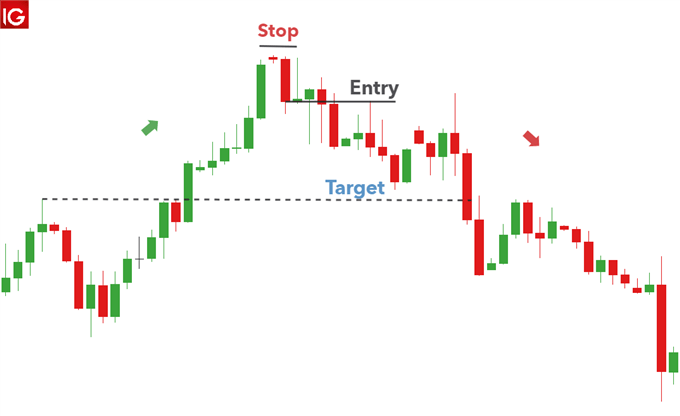
    Trade with Evening Star

    forex market ka chart daikhnay kay bad formation mokamal honay kay bad trader agle he candlestick ke opening mein enter ho saktay hein zyada qadamat passand trader apni entry ein takhair karta hey or yeh daikhnay kay ley intazar kar saktay hein keh forex market mein aya keh price action kam ho rehe hey ya zyada ho rehe hey es ke kharabe ke aik wajah yeh ho sakte hey keh trader bohut he kgharab level mein enter ho sakta hey khas tor par bullish say chalte hove market mein
    target ko support or resistance ke pechle level par he rakha ja sakta hey or forex market kay stop ko pechle swing kay oper herakh saktay hein kunkeh es level ka gap forex market ko reversal janay ko fake kar day ga chonkeh forex market ke koi guarantee nahi hote hey trader ko hamaisha positive rsk o reeward ratio kaim rakhna chihay or risk management say kam laya chihay


    bhali kay badlay bhali
  • <a href="https://www.instaforex.org/ru/?x=ruforum">InstaForex</a>
  • #2 Collapse

    Forex trading mein candlestick patterns ka istemal kar ke traders market ki movements ko analyze karte hain. In patterns mein se aik ahem pattern 'Evening Star' hai jo traders ke liye ahem hota hai. Is article mein hum 'Evening Star' candlestick pattern ke bare mein mukhtasar tafseelat par ghoor karenge.
    1. Candlestick Patterns ki Ahmiyat

      Forex trading mein candlestick patterns ko samajhna aur pehchanna zaroori hai. Ye patterns price action ko interpret karne mein madad dete hain aur traders ko potential reversals ya continuations ke baray mein signals provide karte hain.

      Candlestick patterns market ki psychology aur sentiment ko darshate hain. Har ek candlestick ek specific time period ko represent karta hai, jis mein price open, high, low, aur close levels shamil hotay hain. Candlestick patterns ki madad se traders market trends aur reversals ko identify kar sakte hain.

      Candlestick patterns ki tafseelat honi chahiye jaise ki single candle patterns (jaise ki dojis aur hammers) aur multiple candle patterns (jaise ki engulfing patterns aur harami patterns).
    2. Candlestick Basics

      Candlesticks market sentiment ko darshate hain. Har candlestick price movement ko represent karta hai aur is ke patterns traders ko market direction ke baray mein maloomat dete hain.
      • Components of a Candlestick: Har ek candlestick body aur wicks se bana hota hai. Body candle ki open aur close price range ko darshata hai. Agar candlestick bullish hai toh close price open price se zyada hota hai aur agar bearish hai toh reverse hota hai.
      • Candlestick Colors: Different trading platforms different colors ka use kartay hain to distinguish bullish aur bearish candlesticks ko. Generally, bullish candlesticks green color mein hotay hain aur bearish red color mein.
      • Types of Candlesticks: Traders ko dojis, hammers, shooting stars, aur engulfing patterns jaisay different types ke candlesticks par focus rakhna chahiye jo unko market ki movements samajhnay mein madad dete hain.
    3. Evening Star Introduction

      'Evening Star' ek bearish reversal pattern hai jo trend ki change ko indicate karta hai. Ye pattern typically uptrend ke baad ata hai aur bearish reversal ki possibility ko signal karta hai.

      Evening Star pattern three candles se banta hai: pehla candle bullish hota hai, doosra candle small range aur indecision ko darshata hai, aur teesra candle bearish hota hai jo pehlay ke uptrend ko reverse karta hai. Traders ko is pattern ko identify karne ke liye candles ke shapes aur relative sizes par focus karna chahiye.
    4. Components of Evening Star

      Evening Star pattern teen alag alag candlesticks se mil kar banta hai:
      • Pehla candlestick: Ek bullish candle hota hai jo uptrend ko indicate karta hai.
      • Doosra candlestick: Small body wala aur kam range wala candle hota hai jo indecision ya consolidation ko darshata hai.
      • Teesra candlestick: Ek bearish candle hota hai jo pehle ke bullish trend ko reverse karta hai.

      Evening Star pattern ka main feature hai teesra candle jo pehle ke bullish trend ko reverse karta hai aur bearish momentum ko shuru karta hai. Is pattern ko identify karte waqt, traders ko candles ke sizes, shapes, aur relative positions par dhyan dena chahiye.
    5. Evening Star Pattern Ki Identification

      Evening Star pattern ko identify karna zaroori hai taake traders sahi waqt par apne trades execute kar saken. Is pattern ki pehchan ki jati hai jab:
      • Pehla candle uptrend mein hai: Pehla candle bullish trend ko indicate karta hai.
      • Doosra candle small body ke saath hai: Doosra candle small range ya doji ke form mein hota hai, jo indecision ya market consolidation ko reflect karta hai.
      • Teesra candle bearish hai: Teesra candle bearish hota hai aur pehle ke uptrend ko break kar ke downtrend ki shuruat karta hai.

      Evening Star pattern ko confirm karne ke liye traders ko volume aur additional technical indicators ka use karna chahiye jaise ki RSI (Relative Strength Index) ya moving averages.
    6. Psychology behind Evening Star

      Evening Star pattern market sentiment ki change ko reflect karta hai. Pehle ke bullish sentiment ke baad traders uncertainty mein aate hain jo bearish reversal ki taraf point karta hai.

      Jab pehla candle bullish hota hai, traders bullish momentum mein hote hain aur uptrend ki expectation rakhte hain. Doosra candle small body ke saath aata hai jo market mein indecision ya consolidation ko darshata hai, aur teesra candle bearish hota hai jo bullish trend ko break karta hai. Is process se traders ko market sentiment ki change aur bearish momentum ki shuruat ka idea milta hai.
    7. Evening Star Pattern ki Validity

      Is pattern ki validity candlesticks ki size, range aur volume par depend karta hai. Stronger patterns woh hote hain jo zyada volume aur clear candlestick formations ke saath dikhai dein.
      • Candlestick Sizes: Candlesticks ki sizes ka analysis kar ke traders ko pattern ki strength aur validity ka pata chalta hai. Strong evening star patterns woh hote hain jo large size aur distinct features ke saath dikhai dein.
      • Volume Confirmation: Volume ki increase bearish reversal ko confirm karta hai. Agar teesra candle high volume ke saath bearish move karta hai, toh pattern ki validity aur strength zyada hoti hai.
      • Trading Strategies using Evening Star
      • ​​​Traders evening star pattern ko trading strategies mein istemal karte hain. Ye pattern sell signals provide karta hai jahan traders sell positions enter karte hain ya existing long positions ko close karte hain.
      • Entry Points: Evening Star pattern ke identification ke baad traders sell positions enter karte hain ya existing long positions ko close karte hain. Agar pattern ko confirm karne ke liye additional indicators ka use kiya jaye jaise ki moving averages ya RSI, toh entry points aur timing improve hoti hai.
      • Stop Loss Placement: Risk management ke liye stop loss placement zaroori hai. Agar pattern validate hota hai aur bearish move shuru hota hai, toh traders stop loss ko pehle ki high ya doosri resistance level ke just above set karte hain.
      • Take Profit Targets: Take profit targets ko set karte waqt traders previous support levels, Fibonacci retracement levels ya other technical indicators ka use karte hain. Ye targets pattern ki strength aur market conditions ke according set kiye jate hain.
    1. Risk Management

      Trading mein risk management ahem hai. Evening Star pattern ki confirmation ke baad stop loss aur take profit levels set karna zaroori hai taake traders losses ko minimize kar sakein.
      • Importance of Risk Management: Har trade mein risk ko manage karna crucial hai. Stop loss placement aur position sizing key elements hain jo traders ko protect karte hain unexpected market movements se.
      • Position Sizing: Har trade mein appropriate position size choose karna important hai. Risk per trade ko control kar ke traders apne overall portfolio ko manage karte hain.
      • Emotional Control: Trading mein emotional control maintain karna bhi zaroori hai. Jab pattern confirm hota hai, toh traders apni trading plan ke mutabiq execute karte hain bina emotions ke interfere kiye.
    2. Real-Life Examples

      Real-life examples se traders ko pattern samajhne mein madad milti hai. Historical charts par evening star patterns ki identification karke traders apni analysis improve kar sakte hain.
      • Case Studies: Historical charts par previous examples ki study kar ke traders evening star patterns aur unke outcomes ko analyze karte hain. Different market conditions aur time frames par examples se traders ko pattern ki versatility aur reliability ka idea milta hai.
      • Learning from Experience: Apni trading experience se bhi traders ko practical insights milti hain. Jab traders real-time market mein patterns ko identify karte hain aur unke reactions monitor karte hain, toh unki decision-making skills aur analysis capabilities improve hoti hain.
    3. Limitations of Evening Star

      Har trading pattern ki tarah, evening star pattern bhi false signals generate kar sakta hai. Is liye confirmatory indicators aur additional analysis zaroori hoti hai.
      • False Signals: Market volatility aur price fluctuations ke beech, evening star pattern false signals generate kar sakta hai. Isliye traders ko pattern ko confirm karne ke liye technical indicators ka use karna chahiye.
      • Market Conditions: Different market conditions mein pattern ki effectiveness vary ho sakti hai. Traders ko current market trends aur economic factors ke impact ko bhi consider karna chahiye pattern ki reliability determine karne ke liye.
    4. Technical Analysis Tools

      Technical analysis tools jaise ki moving averages, RSI, aur Fibonacci levels bhi evening star pattern ki confirmation mein madad dete hain.
      • Moving Averages: Moving averages trend analysis aur momentum ke liye helpful hote hain. Jab evening star pattern ke saath moving averages confirm karte hain, toh trading signals aur stronger ban jate hain.
      • RSI (Relative Strength Index): RSI overbought aur oversold conditions ko measure karta hai. Jab RSI evening star pattern ke sath confirmation deta hai, toh bearish reversal ki probability zyada hoti hai.
      • Fibonacci Levels: Fibonacci retracement aur extension levels market mein key support aur resistance levels identify karne mein help karte hain. Evening star pattern ke saath Fibonacci levels ka use kar ke traders entry aur exit points plan karte hain.
    5. Learning and Practicing

      Candlestick patterns ko samajhna aur istemal karna practice aur experience se hota hai. Traders ko regular practice aur market trends ke observation se pattern recognition mein maharat hasil karni chahiye.
      • Demo Trading: New traders ko candlestick patterns ko understand karne ke liye demo trading accounts ka use karna chahiye. Demo trading practice aur experience gain karne mein help karta hai bina real money risk kiye.
      • Continuous Education: Technical analysis aur candlestick patterns ki understanding ko improve karne ke liye traders ko continuous education aur market research par focus rakhna chahiye. Webinars, courses, aur books se traders apni knowledge base ko expand karte hain.
    6. Conclusion

      'Evening Star' candlestick pattern forex trading mein ek powerful tool hai jo bearish reversals ko identify karta hai. Is pattern ki samajh aur sahi istemal se traders apni trading strategies ko improve kar sakte hain aur consistent profits earn karne mein madad le sakte hain.
      • Final Thoughts: Evening star pattern ko identify karna, confirm karna, aur us par based trading strategies develop karna traders ke liye valuable skills hote hain. Is pattern ke saath risk management aur technical analysis ka sahi istemal kar ke traders apne trading journey mein success achieve kar sakte hain.
      • Continuous Improvement: Market conditions aur trends ko monitor kar ke traders ko apni strategies ko adapt karte rehna chahiye. Evening star pattern aur other candlestick patterns ke understanding ko refine karte huye, traders apne trading skills ko enhance kar sakte hain.
    • #3 Collapse

      The "Evening Star" candlestick pattern is a bearish reversal pattern commonly observed in technical analysis of financial markets, especially in candlestick charting. It typically consists of three candles:

      First Candle: A large bullish candle, indicating strong buying pressure

      Second Candle: A smaller candle with a narrow real body (the difference between open and close prices), which may be bullish or bearish, and ideally gaps up from the first candle's close.

      Third Candle: A large bearish candle that closes well into the real body of the first candle, ideally below the midpoint of the first candle's real body. This candle confirms the reversal signal.

      The pattern suggests a transition from bullish sentiment to bearish sentiment. It signifies that after a strong uptrend, buyers are losing momentum and sellers are gaining control, potentially leading to a reversal in the upward trend.

      Traders often look for confirmation signals such as lower closes or further bearish candles in subsequent sessions to confirm the validity of the Evening Star pattern before making trading decisions based on it.

      Let's delve deeper into the details of the Evening Star candlestick pattern:

      Components of the Evening Star Pattern

      First Candle
      :(Bullish Candle)
      This candle is typically a large bullish candle that occurs during an uptrend, signifying strong buying pressure and optimism among traders.
      The real body (the difference between the open and close prices) is usually large, indicating a significant price move during the session.
      Ideally, this candle closes near its high, showing that buyers were in control throughout most of the session.

      Second Candle :(Indecision or Transition)
      The second candle is smaller and can have different forms:
      It may be a small-bodied candle (doji or spinning top), indicating indecision in the market or a balance between buyers and sellers.
      Alternatively, it could be a small bullish candle that gaps up from the close of the first candle, suggesting that bullish momentum may still be present but weakening.

      Third Candle :(Bearish Candle)
      The third candle is a bearish candle that confirms the reversal signal initiated by the Evening Star pattern.
      It is typically a large bearish candle that closes well into the real body of the first candle (preferably below the midpoint of the first candle's real body).
      This candle's size and strong bearish close indicate that sellers have taken control, overpowering the earlier bullish sentiment.

      :Interpretation and Significance

      Bearish Reversal Signal: The Evening Star pattern is considered a strong bearish reversal signal. It suggests that after a period of upward price movement, the trend is losing momentum, and sellers are starting to dominate.

      Confirmation: Traders often wait for confirmation after observing an Evening Star pattern. This can include further bearish candles in subsequent sessions, lower closes, or other technical indicators aligning with the reversal.

      Volume Considerations: Higher trading volume during the formation of the Evening Star pattern can add further validity to the reversal signal, indicating strong participation by traders in the reversal.
      :Timeframe Consideration
      The effectiveness of the Evening Star pattern can vary depending on the timeframe of the chart being analyzed. It tends to be more reliable on daily charts but can also appear on shorter or longer timeframes.

      :Trading Strategy

      Entry: Traders may enter short positions (selling) or consider exiting long positions (if holding) once the Evening Star pattern is confirmed.

      Stop Loss: Place a stop-loss order above the high of the third candle to manage risk in case the pattern fails and the uptrend resumes.

      Target: Potential price targets for profit-taking can be based on support levels identified through technical analysis or Fibonacci retracement levels.

      In summary, the Evening Star candlestick pattern is a powerful bearish reversal signal characterized by three candles: a large bullish candle, a small indecisive or bullish candle, and a large bearish candle confirming a shift in market sentiment from bullish to bearish. Traders use this pattern in conjunction with other technical analysis tools to make informed trading decisions.

      Here's an abstract summarizing Evening Star candlestick pattern

      "The Evening Star is a bearish reversal pattern observed in technical analysis, consisting of three candles on a price chart. It typically begins with a large bullish candle during an uptrend, followed by a smaller candle showing indecision or weakening bullish momentum. The pattern concludes with a large bearish candle that closes well into the real body of the first candle, signaling a shift in sentiment from bullish to bearish. Traders interpret this pattern as a potential signal to enter short positions or exit long positions, with confirmation sought through subsequent bearish price action."

      This abstract captures the essence of the Evening Star pattern, highlighting its structure, interpretation, and implications for trading decisions.
      • #4 Collapse

        Evening Star candlestick pattern ek reversal pattern hai jo market ke top pe dekha jata hai aur yeh indicate karta hai ke price ka trend bullish se bearish mein badalne wala hai. Yeh pattern teen candlesticks se milkar banta hai: pehla ek bullish candlestick, doosra ek small candlestick (jo doji bhi ho sakti hai) aur teesra ek bearish candlestick.

        Pehli Candlestick: Bullish Candlestick

        Evening Star pattern ki pehli candlestick ek lambi bullish candlestick hoti hai jo market ki strength ko show karti hai. Yeh indicate karta hai ke buyers abhi bhi control mein hain aur price ko upar le ja rahe hain.

        Click image for larger version

Name:	maxresdefault.jpg
Views:	21
Size:	63.1 کلوبائٹ
ID:	13013492


        Doosri Candlestick: Small Candlestick


        Pattern ki doosri candlestick choti hoti hai aur yeh bullish ya bearish dono ho sakti hai. Is candlestick ka small body market mein indecision ko represent karta hai. Yeh indicate karta hai ke buyers ki strength kam ho rahi hai aur sellers bhi active ho rahe hain.

        Teesri Candlestick: Bearish Candlestick


        Pattern ki teesri candlestick ek lambi bearish candlestick hoti hai jo poori tarah se pehli bullish candlestick ke body ko cover karti hai. Yeh indicate karta hai ke sellers ne control le liya hai aur price niche girne ka chance barh gaya hai.

        Entry Point Kaise Choose Karein?


        Jab evening star pattern confirm ho jaye, toh traders ko apna entry point teesri candlestick ke close par set karna chahiye. Yeh ensure karta hai ke aap market ke reversal mein enter kar rahe hain.


        Stop Loss Kaise Set Karein?


        Trading mein risk management bohot zaroori hai. Evening star pattern trade karte waqt stop loss ko pattern ki second candlestick ke high ke thoda upar set karna chahiye. Yeh aapke losses ko limited rakhta hai agar market aapke against chala jaye.

        Click image for larger version

Name:	images (36).jpeg
Views:	16
Size:	70.1 کلوبائٹ
ID:	13013493


        Profit Target Kaise Decide Karein?


        Profit target set karne ke liye aap previous support levels ko dekh sakte hain. Yeh wo levels hain jahan se price ne pehle bounce kiya tha. Ek conservative approach yeh hogi ke aap apne profit target ko pehli candlestick ke low ke kareeb set karein.


        Risk/Reward Ratio


        Har trade mein risk/reward ratio ko consider karna bohot important hai. Ideal risk/reward ratio kam se kam 1:2 hona chahiye. Matlab agar aapka stop loss 1 dollar hai toh aapka profit target 2 dollars hona chahiye.
        • #5 Collapse

          EVENING STAR CANDLESTICK PATTERN
          Evening star candlestick pattern kya hy?
          As salam o alaikum dosto, Evening star lekin bearish reversal pattern hy jo trend ki reversal ko indicate karta hy. Ye typically uptrend ke baad nazar aata hy or bearish trend ki shuruaat ka signal deta hy.Evening star pattern teen alag alag candlesticks se bana hota hy. Pehla candle bullish hota hy jo ik strong uptrend ko reflect karta hy. Dusra candle small body wala hota hy jo bullish sentiment ki kamzori ko dikhata hy. Teesra candle bara bearish candle hota hy jo downtrend ki shuruaat ko confirm karta hy.Evening star pattern jab market main dikha jata hy, to ye bearish reversal ke possibility ko darust karta hy. Pehla candle uptrend ki shiddat ko dikhata hy. Dusra candle chhota hota hy or bullish sentiment kamzor hoti hy. Teesra candle strong bearish momentum dikhata hy.Evening star pattern dikhne se pehle, traders ko candles ke sizes or shapes ko closely observe karna chahiye. Agar pehla candle bullish hy, dusra candle small or indecisive hy, or teesra candle strong bearish hy, to ye ik potential evening star pattern hy.Evening star candlestick pattern forex trading main lekin powerful tul hy jo traders ko bearish reversals ko identify karne main madad deta hy. Isko sahi tareeqay se samajhna or istemal karna traders ke liye zaruri hy taake wo successful trading kar sakein.

          Importance of Evening star candlestick pattern:
          1. Candlestick Patterns Ki Ahmiyat
          Hello dosto, Forex market main candlestick patterns ka istemal trend or price action ke liye intehy ahmiyat rakhta hy. Ye patterns traders ko market ki movement ko samajhne or future price directions ka andaza lagane main madad karte hain.
          2. Evening star Candlestick Pattern
          Dear friends,"Evening star" (Evening Star) ik bearish reversal pattern hy jo uptrend ko indicate karta hy. Ye pattern teen alag-alag candles se banta hy:
          • Pehli Candle: Ik lamba bullish (upward) candle hota hy jo existing uptrend ko darust karta hy.
          • Dusri Candle: Iske baad aata hy chhota sa doji ya spinning top candle, jo confusion or indecision darust karta hy, or uptrend ki thamne ki nishani hy.
          • Teesri Candle: Teesi or aakhri candle ik lamba bearish (downward) candle hota hy jo pehli candle ke upar close hota hy. Ye price action ka confirmation deti hy or downtrend ki shuruaat ko darust karta hy.
          3. Evening star Pattern Ki Tashreeh
          Dear forex members, Jab Evening star pattern market main nazar aata hy, to ye ik potential sell signal samjha jata hy. Pehli bullish candle se trend ko darust kiya jata hy, dusri candle indecision ko darust karta hy or teesri candle bearish momentum ki entry ko confirm karta hy.

          • #6 Collapse

            **Evening Star Candlestick Pattern:**

            Evening Star ek candlestick pattern hai jo trading mein bearish reversal signal dene ke liye use hota hai. Yeh pattern market ke top par banta hai aur yeh signal deta hai ke trend jo pehle bullish tha, ab bearish hone wala hai. Yeh pattern technical analysis mein kaafi common aur reliable maana jata hai.

            **Introduction:**

            Candlestick patterns trading mein bahut importance rakhte hain aur inhe technical analysis ke tor par use kiya jata hai taake market trends aur price movements ko samjha ja sake. In patterns mein se ek kaafi mashhoor pattern hai, jo "Evening Star" kehlata hai.

            **Evening Star Candlestick Pattern Kya Hai:**

            Evening Star pattern teen alag candlesticks se mil kar banta hai:
            1. Pehla candlestick: Yeh ek lambi bullish candlestick hota hai jo strong uptrend ko represent karta hai.
            2. Doosra candlestick: Yeh ek chhoti candlestick hoti hai jo gap up ke sath open hoti hai aur ek indecisive market ko represent karti hai. Yeh doji ya spinning top ho sakti hai.
            3. Teesra candlestick: Yeh ek lambi bearish candlestick hoti hai jo pehle aur doosre candlestick ke beech se gap down ke sath open hoti hai aur niche close hoti hai. Yeh bearish reversal ko confirm karti hai.

            **Formation Aur Psychology:**

            Evening Star pattern tab banta hai jab market ek bullish trend mein hota hai. Pehla lamba bullish candlestick market ke strong buying pressure ko show karta hai. Doosra chhota candlestick is baat ki nishani hota hai ke buyers aur sellers dono hi confused hain aur market indecisive hai. Jab teesra bearish candlestick banta hai aur niche close hota hai, toh yeh is baat ka indication hota hai ke ab selling pressure dominate kar raha hai aur trend reverse hone wala hai.

            **Importance Aur Trading:**

            Evening Star pattern ko identify karna traders ke liye bohot zaroori hota hai kyunki yeh unhe market reversal ke signals de sakta hai. Jab yeh pattern banta hai, toh traders apni long positions ko close karne ka soch sakte hain aur short positions ko open karne ki planning kar sakte hain.

            **Technical Analysis Mein Use:**

            Technical analysis mein, Evening Star pattern ko dusre indicators aur tools ke sath mila kar use kiya jata hai taake trading decisions ko confirm kiya ja sake. Is pattern ko support aur resistance levels, moving averages aur other technical indicators ke sath combine karke dekhna chahiye.

            **Example:**

            Ek real-life example ki madad se samajhte hain:

            Suppose ek stock ka price continuously badh raha hai aur ek lamba green candlestick form karta hai. Agle din, yeh stock gap up ke sath open hota hai lekin us din ka candlestick chhota rehta hai aur market mein confusion ko show karta hai. Teesre din, stock ka price gap down ke sath open hota hai aur ek lamba red candlestick banata hai. Yeh pattern Evening Star kehlata hai aur yeh signal deta hai ke ab market mein bearish reversal ho sakta hai.

            **Conclusion:**

            Evening Star candlestick pattern ek kaafi powerful tool hai jo traders aur investors ko market ke potential reversals ke bare mein bata sakta hai. Is pattern ko samajhna aur use karna trading strategies mein faydemand ho sakta hai, lekin hamesha dusre indicators aur analysis ke sath combine karke dekhna chahiye taake zyada accurate trading decisions liye ja sakein.
            • #7 Collapse

              Forex trading mein mukhtalif takneeki tajziya kay auzar istemal hotay hain, aur candlestick patterns in mein se aham tareen hain. Ek aisa pattern jo traders ki aksar nazar mein aata hai wo "Sham ki Sitara" ya "Evening Star" pattern hai. Yeh article sham ki sitara candlestick pattern ki taraf mutwajjah hone ka maqsad rakhta hai, is ke forex trading mein ahmiyat, isay pehchanne ka tariqa, aur is pattern ke istemal se trading karne ke tareeqon par roshni dalta hai.
              Candlestick Patterns Ki Introduction


              Candlestick patterns forex charts mein qeemat ke harkaton ka tasawwur faraham karte hain. Yeh market ki jazbat aur mumkin mustaqbil ke price movements ke baray mein maahir banane mein madad dete hain jo pichli patterns ke aadhar par hotay hain.

              Candlesticks mein aik jism hota hai jo open aur close prices ko darshata hai, aur wicks (ya shadows) jo trading period ke dauran pohnchay gaye buland aur nichi prices ko zahir karte hain. Sham ki sitara jaise patterns se traders ko market ke rukh badalne ki peshan goiyan faraham hoti hain.
              Sham Ki Sitara Candlestick Pattern Kya Hai?


              Sham ki sitara pattern aksar teen candles ki sequence mein banne wala aik bearish reversal pattern hota hai. Yeh aam tor par uptrend ke akhir mein nazar aata hai aur neechay ki taraf murne ki alamat ka paigham pesh karta hai.
              Sham Ki Sitara Pattern Ke Hissay
              1. Pehli Candle (Bullish Candle): Sham ki sitara pattern aik bara bullish candle se shuru hota hai, jo taqatwar khareedari dabao ko zahir karta hai. Yeh candle aksar mojooda uptrend ko jari rakhta hai aur naye unchayiyan qaim karta hai.
              2. Doosri Candle (Chota Jism): Doosri candle chota jism ke sath banta hai, jo tashweesh ya khareedo farokht ke darmiyan tasalsul ko numayan karta hai. Yeh candle aksar aik chota upper shadow bhi ho sakta hai, jis se ye zahir hota hai keh khareedne wale price ko barhane ki koshish ki, lekin unhe muqabla mila.
              3. Teesi Candle (Bearish Candle): Pattern teesi candle ke sath mukammal hota hai jo pehli candle ke jism ke andar achi tarah band hota hai. Yeh candle reversal signal ko tasdeeq karta hai jabke ye zahir karta hai keh pehle bullish momentum ko barhane wale dabao ko bearish momentum ne murnay mein kamyabi hasil ki hai.
              Sham Ki Sitara Pattern Ki Pehchan Kaise Karein


              Sham ki sitara pattern ko sahi tarike se pehchanne ke liye traders ko ye sharaait dhiyan mein rakhni chahiye:
              • Uptrend Ki Tasdeeq: Pehli candle mein mojooda price movement mein tafseeli uptrend zahir hona chahiye.
              • Tashweesh Wala Candle: Doosri candle chota jism wala ho aur upper shadow ke sath aaye, jo tashweesh ya uptrend mein rokawat ka ishara karta hai.
              • Bearish Reversal: Teesi candle aik mazboot bearish candle hai jo pehli candle ke jism ke darmiyan band hota hai, jo bullish se bearish rukh ki taraf palat ki alamat deta hai.
              Sham Ki Sitara Pattern Ki Ahmiyat


              Sham ki sitara pattern forex trading mein ahmiyat rakhta hai kyun keh is ka istemal market ke rukh badalne ki mumkin alamat ko pesh karna hota hai. Traders is pattern ko bullish momentum ki kamzori ki nishani samajhte hain aur umeed karte hain keh bearish rukh jald hi aa sakta hai.
              Sham Ki Sitara Pattern Se Trading Karne Ke Tareeqe
              1. Tasdeeq Aur Waqt:
                • Tasdeeq Ke Liye Intezar Karein: Sham ki sitara pattern par trade karne se pehle teesi candle ka mukammal band hona zaroori hai. Ye tasdeeq madad deti hai keh reversal signal sahi hai aur ghalat samay par trade na karein.
                • Dakhil Aur Stop-Loss: Traders aam tor par teesi candle ke nichlay hissay ke neechay dakhil karte hain jo bearish jazbat ko tasdeeq karta hai. Risk ko kam karne ke liye teesi candle ke buland tareen hissay ke ooper stop-loss order lagayein jahan tak keh aap ko trade ke khilaaf honay wale nuqsanat se mehfooz rakhein.
              2. Risk Management Ke Tareeqe:
                • Position Size: Apni risk bardasht ke mutabiq aur account size ke hisab se munasib position size tay karain. Candlestick patterns par trading karte waqt zyada leverage se bachain.
                • Stop-Loss Orders: Stop-loss orders ka istemal karen takay agar market anay wale rukh ke khilaf chalay to nuqsanat ko had mein rakha ja sake. Trade ke dauran stop-loss levels ko tabdeel karte rahein ta keh munafa ko mehfooz karain ya nuqsanat ko kam karain.
              3. Doosre Indicators Ke Saath Tasdeeq:
                • Volume Analysis: Sham ki sitara pattern ke sath trading volume ka jayeza len. Pattern ke banne ke dauran volume mein kami aur tasdeeq candle par volume mein izafa is pattern ki tasdeeq ko mazbooti deta hai.
                • Support Aur Resistance Levels: Sham ki sitara pattern ke saath support aur resistance levels ko bhi shamil karen. Khas tor par bearish reversal signal jo kisi significant resistance level ke qareeb ata hai, is pattern ki sahiyat ko barhata hai.
              Forex Charts Mein Sham Ki Sitara Patterns Ke Usool


              Sham ki sitara pattern ke amal mein shamil karne ke liye aik hawali tashkhees ke liye soorat hal ko tashkeel dene ke liye ek tasawwur ke liye:
              • Chart Analysis Ke Manzar: Aik currency pair ke price movement mein wazeh uptrend ko pichle kai trading sessions mein pehchanen. Pattern aik taqatwar bullish candle (Day 1) ke sath shuru hota hai, jo aik chota jism wala candle (Day 2) ke sath aik upper shadow ke sath aata hai, aur ek bada bearish candle (Day 3) se samapt hota hai jo pehli candle ke jism ke darmiyan band hota hai.
              • Pattern Recognition: Traders is tasavvur ko pattern ki mumkin bearish rukh ke asar ke tor par dekhenge jo market ke bullish jazbat se bearish jazbat mein tabdeel hone ki daleel deti hai.
              Mehdoodiyat Aur Ghor-O-Fikr


              Jabke sham ki sitara pattern potential market reversals ke liye qeemti dalil faraham karta hai, isay tashkeel dene se pehle trade karne ke qabil aur mazeed factors ko ghor karna zaroori hai:
              • Ghalat Signals: Jaise ke kisi bhi takneeki tajziya tool, sham ki sitara pattern bhi ghalt signals dene ke qabil hai aur kabhi kabar ghalat signals bhi ho sakte hain. Traders ko isey doosre indicators aur analysis techniques ke sath tasdeeq karne ke liye istemal karna chahiye.
              • Market Sharaait: Market sharaait, khabar events aur maali maalumat jaise factors price movements ko asar andaz ho sakte hain aur takneeki signals ko override kar sakte hain. Traders ko apni trade making decision mein is tarah ke mazeed factors ko daimi tor par janne ke liye mustaamil rehna chahiye.
              • Risk Management: Candlestick patterns par trading karne par mustarad risk management strategies ko istemal karna zaroori hai. Hamesha apni risk tolerance mukarar karen, stop-loss orders set karen, aur kisi bhi aik trade par apne trading capital ka zyada hissa nuqsan mein dene se bachain.
              Ikhtitami Guftagu


              Sham ki sitara candlestick pattern forex traders ke liye qeemti tool hai jo price trends mein potential reversals pehchanne mein madad deta hai. Is ke hissay ko samajhne, forex charts par sahi tareeqe se pehchanne aur munasib trading strategies ko istemal karne se, traders apne trade making decisions ko barhane mein kamiyabi hasil kar sakte hain.
              Aakhir Mein


              Sham ki sitara pattern ke kaamyabi se trading karne ke liye amal, tajziya aur market dynamics ke achi samajh ki zaroorat hoti hai. Traders ko apni takneeki tajziya ke hunar ko tarteeb dena chahiye, market ke taraqqi pazeer sharaait ke mutabiq tashweesh karna chahiye, aur apne trading strategies mein risk management principles ko shamil karna chahiye jo forex trading mein lambi kamyabi ke liye zaroori hai.
              • #8 Collapse

                Sham Ki Sitara: Forex Trading Mein Evening Star Candlestick Pattern

                Forex trading mein candlestick patterns ka istemal aam hai, jo traders ko market ki movement ko samajhne mein madad deta hai. Ek aham candlestick pattern jo traders ke liye mahatvapurn hai, woh hai "Evening Star". Is article mein hum evening star candlestick pattern ke bare mein vistaar se baat karenge, aur yeh samajhne ki koshish karenge ki iska forex trading mein istemal kaise kiya ja sakta hai.
                1. Introduction to Candlestick Patterns


                Candlestick patterns forex trading mein price action analysis ka ek pramukh hissa hain. Yeh patterns price charts par candlesticks ke shapes aur formations ke roop mein dikhte hain, jo market sentiment aur potential reversals ko darshate hain.

                Candlesticks market price movement ko represent karte hain. Har candlestick ek specific time period (jaise 1 minute, 1 hour, ya 1 day) ke during ki price action ko darshata hai. Har candlestick ke 3 parts hote hain: open, high, low, aur close price.
                2. Understanding Candlesticks: The Basics


                Candlesticks ek visual representation provide karte hain market sentiment aur price action ka. Inki shapes aur sizes traders ko market dynamics ko analyze karne mein help karte hain.
                3. What is an Evening Star Candlestick Pattern?


                Evening star ek bearish reversal pattern hai, jo uptrend ke baad dikhai deta hai. Yeh teen candlesticks se bana hota hai:
                • First Candle (Bullish): Yeh candle uptrend ke dauran dikhai deta hai aur strong bullish sentiment ko indicate karta hai.
                • Second Candle (Indecision): Doji ya small body candle hota hai, jo market mein uncertainty ya indecision darshata hai.
                • Third Candle (Bearish): Yeh candle downtrend ke shuruaat ko darshata hai, indicating a potential reversal.
                4. Identifying the Evening Star Pattern


                Evening star pattern ko identify karne ke liye, traders ko in steps ko follow karna hota hai:
                • Pehle candle ek strong uptrend ke baad dikhai deta hai.
                • Doosre candle mein price movement slow hota hai, jo indecision ko show karta hai.
                • Teesre candle mein price downtrend mein move karta hai, confirming a reversal.
                5. Significance of the Evening Star Pattern


                Evening star pattern ki significance yeh hai ki yeh bearish trend reversal ko indicate karta hai, aur traders ko market direction ko anticipate karne mein madad deta hai.
                6. Example of an Evening Star Pattern


                Maan lijiye ki ek uptrend ke baad market ek evening star pattern dikha raha hai:
                • Pehla candle: Long green candle (bullish sentiment)
                • Doosra candle: Small doji or spinning top (indecision)
                • Teesra candle: Long red candle (bearish reversal)
                7. Trading Strategies Using the Evening Star Pattern


                Evening star pattern ka istemal karke traders bearish reversals ko spot kar sakte hain. Kuch common trading strategies include:
                • Entry Points: Sell positions initiate karna jab teesra candle complete hota hai.
                • Stop Loss Placement: High of the pattern ke upar stop loss place karna, to protect against false breakouts.
                • Profit Targets: Previous support levels ya Fibonacci retracement levels ke near exit points define karna.
                8. Technical Analysis Tools to Confirm the Pattern


                Evening star pattern ko confirm karne ke liye, traders technical analysis tools ka bhi istemal karte hain:
                • Volume Analysis: Increasing volume downtrend ke sath confirm karta hai.
                • Support and Resistance: Previous support levels se confirm karna.
                9. Risks and Considerations


                Har trading pattern ki tarah, evening star pattern bhi false signals generate kar sakta hai. Isliye, confirmation aur risk management crucial hota hai.
                10. Real-World Applications and Examples


                Real-world examples dekh kar traders ko is pattern ki effectiveness samajhne mein madad milti hai. Historical charts study kar ke is pattern ki accuracy analyze karna jaruri hai.
                11. Psychology Behind the Evening Star Pattern


                Evening star pattern ki psychology yeh darshata hai ki market sentiment initially bullish hota hai, phir indecision aata hai, aur fir bearish sentiment dominate karta hai.
                12. Importance of Timeframes in Analysis


                Timeframes ka selection bhi important hota hai. Short-term traders aur long-term investors ke liye different timeframes mein pattern ki interpretation alag ho sakti hai.
                13. Candlestick Patterns vs. Other Technical Indicators


                Candlestick patterns aur other technical indicators (jaise ki RSI, MACD) ka combination karke traders better trading decisions le sakte hain.
                14. Practical Tips for Using the Evening Star Pattern


                Traders ko reliable data aur pattern confirmations ke through decisions lena chahiye. Emotional trading se bache aur strict trading plan follow kare.
                15. Case Studies and Success Stories


                Case studies aur success stories se traders ko pattern ka real-world application aur potential samajhne mein madad milti hai.
                16. Common Mistakes to Avoid


                Kuch common mistakes include over-reliance on patterns without confirmation, aur risk management ignore karna.
                17. Conclusion


                Evening star pattern ek powerful tool hai bearish reversals spot karne ke liye. Is pattern ko samajhna aur effectively utilize karna traders ke liye critical hota hai.
                18. Future Trends in Candlestick Patterns


                Future mein candlestick patterns ki evolution aur new patterns development market dynamics ke according hoga.
                19. Final Thoughts


                Evening star pattern forex trading mein ek valuable technical tool hai, jo traders ko market trends aur reversals ko identify karne mein madad karta h
                • <a href="https://www.instaforex.org/ru/?x=ruforum">InstaForex</a>
                • #9 Collapse

                  Sham Ki Sitara: Forex Trading Mein Evening Star Candlestick Pattern

                  Forex trading mein candlestick patterns ka istemal aam hai, jo traders ko market ki movement ko samajhne mein madad deta hai. Ek aham candlestick pattern jo traders ke liye mahatvapurn hai, woh hai "Evening Star". Is article mein hum evening star candlestick pattern ke bare mein vistaar se baat karenge, aur yeh samajhne ki koshish karenge ki iska forex trading mein istemal kaise kiya ja sakta hai.
                  1. Introduction to Candlestick Patterns


                  Candlestick patterns forex trading mein price action analysis ka ek pramukh hissa hain. Yeh patterns price charts par candlesticks ke shapes aur formations ke roop mein dikhte hain, jo market sentiment aur potential reversals ko darshate hain.

                  Candlesticks market price movement ko represent karte hain. Har candlestick ek specific time period (jaise 1 minute, 1 hour, ya 1 day) ke during ki price action ko darshata hai. Har candlestick ke 3 parts hote hain: open, high, low, aur close price.
                  2. Understanding Candlesticks: The Basics


                  Candlesticks ek visual representation provide karte hain market sentiment aur price action ka. Inki shapes aur sizes traders ko market dynamics ko analyze karne mein help karte hain.
                  Click image for larger version

Name:	download.png
Views:	4
Size:	5.8 کلوبائٹ
ID:	13018355
                  3. What is an Evening Star Candlestick Pattern?


                  Evening star ek bearish reversal pattern hai, jo uptrend ke baad dikhai deta hai. Yeh teen candlesticks se bana hota hai:
                  • First Candle (Bullish): Yeh candle uptrend ke dauran dikhai deta hai aur strong bullish sentiment ko indicate karta hai.
                  • Second Candle (Indecision): Doji ya small body candle hota hai, jo market mein uncertainty ya indecision darshata hai.
                  • Third Candle (Bearish): Yeh candle downtrend ke shuruaat ko darshata hai, indicating a potential reversal.
                  4. Identifying the Evening Star Pattern


                  Evening star pattern ko identify karne ke liye, traders ko in steps ko follow karna hota hai:
                  • Pehle candle ek strong uptrend ke baad dikhai deta hai.
                  • Doosre candle mein price movement slow hota hai, jo indecision ko show karta hai.
                  • Teesre candle mein price downtrend mein move karta hai, confirming a reversal.
                  5. Significance of the Evening Star Pattern


                  Evening star pattern ki significance yeh hai ki yeh bearish trend reversal ko indicate karta hai, aur traders ko market direction ko anticipate karne mein madad deta hai.
                  6. Example of an Evening Star Pattern


                  Maan lijiye ki ek uptrend ke baad market ek evening star pattern dikha raha hai:
                  • Pehla candle: Long green candle (bullish sentiment)
                  • Doosra candle: Small doji or spinning top (indecision)
                  • Teesra candle: Long red candle (bearish reversal)

                  اب آن لائن

                  Working...
                  X