Three black crows candlestick pattern kia hai?
X
  • وقت
  • دکھائیں
Clear All
new posts
  • #1 Collapse

    Three black crows candlestick pattern kia hai?
    Taaruf:

    Three Black Crows candlestick pattern ek bearish reversal pattern hai jo typically uptrend ke baad appear hota hai aur potential trend reversal ko indicate karta hai. Yeh pattern traders ko signal karta hai ke market mein selling pressure dominate karne laga hai, jo ke price ko neeche le jaane ka potential rakhta hai.

    Click image for larger version

Name:	images - 2024-06-20T185244.402.png
Views:	16
Size:	3.4 کلوبائٹ
ID:	13011201

    Pattern Ki Structure:

    Three Black Crows pattern teen consecutive bearish (red ya black) candlesticks par mushtamil hota hai, jo gradually lower close hoti hain. Yeh candlesticks usually in points mein observe ki ja sakti hain:
    1. First Candlestick:
      • Pehla bearish candlestick uptrend ke end par form hota hai. Yeh candlestick high open aur low close dikhata hai, jo ke initial selling pressure ko signal karta hai.
    2. Second Candlestick:
      • Dusra bearish candlestick bhi high open aur low close ke sath form hota hai, jo pehle candlestick ke close ke kareeb ya slightly neeche open hota hai. Yeh additional selling pressure aur trend reversal ko confirm karta hai.
    3. Third Candlestick:
      • Teesra bearish candlestick bhi similar pattern follow karta hai, jo downtrend ke continuation ko indicate karta hai. Yeh candlestick dusre candlestick ke close ke kareeb ya slightly neeche open hota hai aur low close hota hai.
    Click image for larger version

Name:	images - 2024-06-20T185233.949.png
Views:	12
Size:	4.5 کلوبائٹ
ID:	13011202

    Trading Strategy:
    1. Identification:
      • Pehle uptrend ko identify karein aur phir Three Black Crows pattern ko confirm karein jab teen consecutive bearish candlesticks form hoon.
    2. Entry Points:
      • Jab pattern complete ho jaye aur third candlestick close ho jaye, tab sell position enter karni chahiye. Yeh pattern trend reversal aur strong selling pressure ko signal karta hai, jo short-selling ke liye favorable hota hai.
    3. Stop-Loss Placement:
      • Stop-loss order ko recent high ya third candlestick ke high ke upar place karein taake unexpected price movements se protection mil sake.
    4. Profit Targets:
      • Profit targets ko key support levels, previous swing lows, ya Fibonacci retracement levels ke basis par set karein. Yeh realistic aur achievable targets ensure karta hai.
    Click image for larger version

Name:	images - 2024-06-20T185227.204.jpeg
Views:	12
Size:	18.5 کلوبائٹ
ID:	13011203

    Natija:

    Three Black Crows candlestick pattern forex trading mein ek powerful bearish reversal signal provide karta hai jo uptrend ke baad strong selling pressure ko indicate karta hai. Proper identification aur accurate interpretation ke sath, traders is pattern ka use karke profitable short-selling opportunities identify kar sakte hain. Jaise kisi bhi trading strategy mein, proper risk management aur additional confirmation indicators ka use zaroori hai taake trading success ensure kiya ja sake.
  • <a href="https://www.instaforex.org/ru/?x=ruforum">InstaForex</a>
  • #2 Collapse

    Introduction

    forex market mein three black crows candlestick chart pattern aik kesam ka technical chart pattern hota hey jokeh forex market kay upper trend kay reversal janay ke paish goi karta hey candlestick pattern kese khas day kay start mein zyada ka or high or low ko dekhata hey high movement karnay walay stock kay ley candlestick green ya red bhe ho sakte hey jab nechay taraf barhtay hein to red ya black bh ho saktay hein
    three black crows pattern aik kesa ka jaree pattern hota hey jo keh forex market mein body wale candlestick par moshtamel hota hey or pechle candlestick nechay ke taraf close ho jate hey trader e indicator ko dosray technical indicator kay sath mela kar estamal kartay hein jaisay he reversal janay ke confirmation hote hey

    three black crows explain


    forex market mein three black crows aik kesam ka basree pattern hota hey forex market mein es pattern ko identify karnay kay bad fekar karnay ke koi zaroorat nahi hote hey ager ap es pattern ko samjh kar market ke movement ko samjh kar trade kay ley entry laytay hein to ap ko bohut he ache opportunity mell sakte hey bear jare teen sesion mein teen long body ke black candlestick banata hey jes min chotay baghair shadow kay wick hotay hein
    three black crows ke am shape mein say bulls ka session start hota hey laken es poray session kay doran price ko lows par dahkail deya jata hey end mein price kay bear session low session say close ho jata hey
    forex market kay trading action kay doran bohut short sa ya phir ghair majodah session ho ga es say nechay ke taraf trend ko bearish ka session qarar deya ja sakta hey
    three black crows aik idealy or log body wale candlestick hote hey jo keh low period kay ley bearish trend mein hota hey

    Trading strategy with Three Black crows pattern

    forex trader ko three black crows candlestick patter ka estamal kartay hovay trade karne chihay forex market mein trade kay ley upper trend kay ba forex arket mein he pattern banta hey es ko behtar tor par aik mesal say he samjh saktay hein
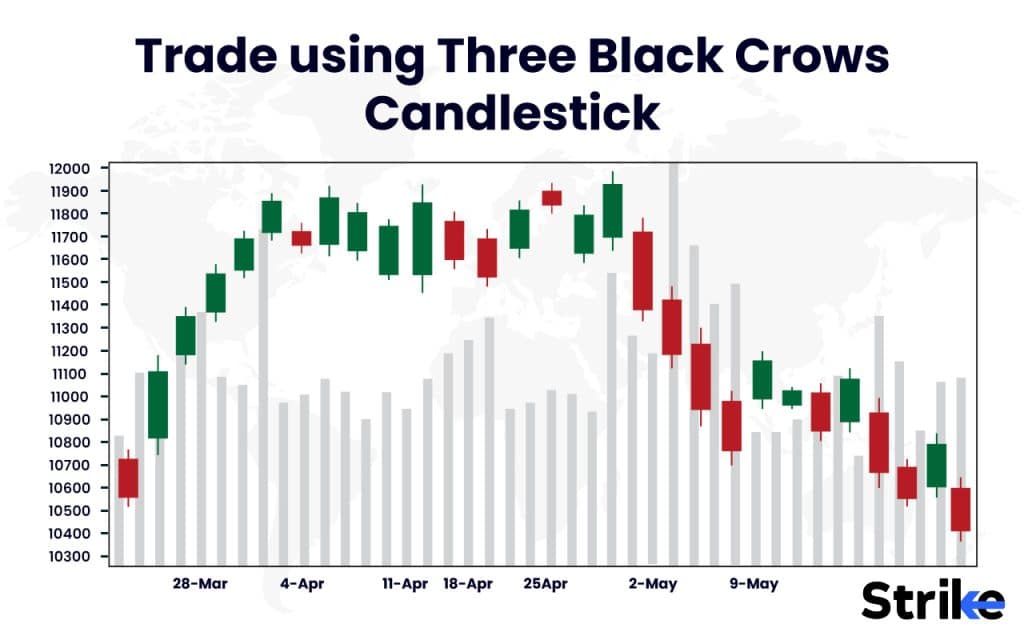
    oper deya geya chart pattern bank nifty ka chart pattern hey yahan par sab say important cheez yeh hote hey keh market mein stock ka start mein up trend hey three black crows ke formation ka criteria bhe mel raha hota hey pattern ke formation kay bad stock bearish trend mein move kar jata hey
    Last edited by ; 20-06-2024, 10:07 PM.
    bhali kay badlay bhali
    • #3 Collapse

      Three Black Crows Candlestick Pattern Kya Hai?

      Candlestick patterns market analysis mein bahut ahem hote hain. Yeh patterns traders ko market ke movements ko samajhne aur predict karne mein madad dete hain. Ek aham candlestick pattern jo traders ke liye useful hota hai, woh hai "Three Black Crows". Is article mein hum Three Black Crows candlestick pattern ke baray mein mukhtasar maloomat pesh kar rahe hain.

      1. Introduction to Candlestick Patterns

      Candlestick patterns technical analysis ka ek hissa hain jahan market ke price movements ko graphically represent kiya jata hai. Har candlestick ek specific time period ki price action ko darshata hai. Har ek candlestick apne open, high, low, aur close prices ko represent karta hai, jo ek samay ki trading session ko darshata hai.

      Candlestick patterns traders ke liye important hote hain kyunki inki madad se woh market ke behavior ko samajhte hain aur future price movements ko predict karne ki koshish karte hain. Har ek candlestick pattern unique hota hai aur alag-alag market conditions mein different meanings aur interpretations hoti hain.

      2. Three Black Crows Kya Hai?

      Three Black Crows ek bearish reversal pattern hai jo market mein uptrend ke baad dikhta hai. Is pattern mein typically teen consecutive long black (red) candles hoti hain jo neeche ki taraf close hoti hain. Iska matlab hota hai ke har agle candle ka close pehle candle ke low price ke qareeb hota hai.

      Three Black Crows pattern ki shanakht karna relatively simple hai kyunki ismein teen consecutive bearish candles hote hain, jo har ek ki closing price uski low price ke qareeb hoti hai. Yeh pattern market sentiment ko reflect karta hai aur bearish reversal ka indication deta hai.

      3. Three Black Crows Anatomy

      Three Black Crows pattern mein har ek candle dusre ke nichlay close par open hota hai aur phir neeche ki taraf close karta hai. Har succeeding candle last se neeche close hota hai, indicating strong bearish momentum. Yeh pattern dekhne mein simple hota hai lekin iske implications market sentiment ke liye significant hote hain.

      Har ek candlestick ki body aur wicks (ya shadows) bhi important hote hain. Body candlestick ka main part hota hai jo open aur close prices ke beech ka area hota hai. Agar ek candlestick ki body lambi hoti hai aur neeche ki taraf close hoti hai, to iska matlab hai ke sellers ne strong control maintain kiya hai aur price neeche gaya hai.

      4. Pattern Ki Identification

      Three Black Crows pattern ko identify karna relatively straightforward hota hai. Ismein teen consecutive bearish candles hone chahiye jin ki closing price har ek candle ki low price ke kareeb hoti hai. Is pattern ko confirm karne ke liye volume analysis aur other technical indicators ka bhi istemal hota hai.

      Traders jab Three Black Crows pattern ko identify karte hain to woh dekhte hain ke kya market mein ek uptrend ke baad price ek bearish reversal pattern show kar raha hai. Agar teen consecutive sessions mein candles neeche ki taraf close ho rahe hain aur har ek candle ki closing price low price ke kareeb hai, to yeh ek bearish reversal signal samjha jata hai.

      5. Three Black Crows Pattern Example

      Maan lijiye ke market ek uptrend ke baad hai aur phir teen consecutive sessions mein price kafi neeche close hoti hai, har ek candle low price ke kareeb. Yeh Three Black Crows pattern ka example ho sakta hai. Jab bhi aap is pattern ko observe karte hain, to aapko confirm karna hoga ke har ek candle ki closing price low price ke kareeb hai aur volume bhi confirmatory hai.

      Three Black Crows pattern ke example dekhne ke baad traders ko ek bearish reversal trade ki opportunity samajh mein aati hai. Is pattern ko confirm karne ke baad short positions enter kiye ja sakte hain, ideally jab market ka trend change hone ka indication hota hai.

      6. Psychological Significance

      Three Black Crows pattern bearish reversal ko darshata hai. Yeh pattern traders ko indicate karta hai ke uptrend khatam ho raha hai aur market ab neeche jaane ki possibility hai. Is pattern ki psychological significance hoti hai kyunki yeh traders ke sentiment ko reflect karta hai aur selling pressure ki presence ko indicate karta hai.

      Jab bhi Three Black Crows pattern form hota hai, to traders ka confidence strong bearish moves ke liye increase ho jata hai. Yeh pattern market mein ek shift ko show karta hai jahan buyers ka control kamzor ho raha hai aur sellers ka dominance badh raha hai. Isliye traders is pattern ko samajhte hain ke market ka sentiment bearish ho gaya hai aur ab short positions enter karne ki opportunity hai.

      7. Volume Analysis

      Is pattern ko confirm karne ke liye volume analysis bhi important hota hai. Agar Three Black Crows pattern ke sath high volume bhi hai, to yeh bearish reversal ki strong indication deta hai. Volume ek important parameter hai jo price movements ke sath confirmation provide karta hai.

      Jab bhi Three Black Crows pattern form hota hai, to volume ki analysis karna zaroori hai kyunki volume ki madad se confirm kiya ja sakta hai ke bearish moves mein kitna interest aur participation hai. High volume ke sath Three Black Crows pattern hone par traders ko ek strong bearish reversal signal milta hai jise woh apni trading decisions mein istemal kar sakte hain.

      8. Timeframe Consideration

      Three Black Crows pattern har timeframe par dekha ja sakta hai, lekin longer timeframes par zyada reliable hota hai, jaise hourly, daily, ya weekly charts par. Har timeframe ki apni importance hoti hai aur traders ko market ke different perspectives ko samajhne ke liye alag-alag timeframes par focus karna chahiye.

      Short-term traders hourly aur daily charts par Three Black Crows pattern ko monitor karte hain jabki long-term investors weekly aur monthly charts par is pattern ko analyze karte hain. Har timeframe par pattern ki identification aur confirmation ke liye appropriate technical analysis techniques ka istemal karna zaroori hai.

      9. False Signals

      Jaise har technical indicator ya pattern ki tarah, Three Black Crows bhi kabhi kabhi false signals de sakta hai. Isliye traders ko always confirmatory indicators ka use karna chahiye jaise ki volume, other candlestick patterns, aur trend lines. False signals ko minimize karne ke liye risk management techniques ka bhi istemal karna zaroori hai.

      False signals ko identify karna aur unse protect hona traders ke liye important hota hai kyunki yeh losses ko avoid karne mein madad karte hain. Jab bhi Three Black Crows pattern detect karte hain, to woh confirmatory factors ko bhi analyze karte hain taaki unki trading decisions ko validate kiya ja sake.

      10. Trading Strategies Using Three Black Crows

      Traders Three Black Crows pattern ko bearish reversal trade karne ke liye use karte hain. Is pattern ke confirm hone ke baad short positions enter kiye ja sakte hain stop loss aur target levels ke sath. Trading strategies ko develop karte waqt traders ko pattern ki confirmatory signals aur market conditions ka bhi dhyan rakhna chahiye.

      Ek common trading strategy Three Black Crows pattern ke istemal mein yeh hoti hai ke jab pattern form hota hai aur confirmatory indicators bhi positive hote hain, to traders short positions enter karte hain. Stop loss levels ko define karte hue aur risk management ko follow karte hue woh apne positions ko manage karte hain.

      11. Risk Management

      Har trading strategy mein risk management ka ahem hissa hota hai. Three Black Crows pattern ke use mein bhi stop loss levels ko define karna zaroori hai taaki losses minimize kiye ja saken. Risk reward ratio ko bhi consider karna important hota hai jisse ke potential profits ko maximize kiya ja sake.

      Traders ko apne trading plans mein risk management ko incorporate karna chahiye jismein stop loss levels ko define karte hue woh apni capital ko protect karte hain. Three Black Crows pattern ke sath trading karte waqt bhi risk management principles ko follow karna important hota hai taaki losses ko control kiya ja sake aur consistent profitability maintain kiya ja sake.

      12. Limitations of Three Black Crows

      Three Black Crows pattern ke bhi kuch limitations hote hain jaise false signals aur market conditions ke change hone par unreliable ho jana. Isliye traders ko is pattern ko interpret karte waqt cautious rehna chahiye aur confirmatory factors ka bhi istemal karna chahiye.

      Market volatility aur sudden price movements bhi Three Black Crows pattern ko influence kar sakte hain. Agar market mein sudden changes ya reversals hote hain to woh is pattern ke reliability ko affect kar sakte hain. Isliye traders ko always current market conditions ko monitor karte rehna chahiye jab bhi woh candlestick patterns ka analysis karte hain.

      13. Conclusion

      Three Black Crows candlestick pattern ek powerful bearish reversal indicator hai jo traders ko market ki direction ke baare mein useful insights deta hai. Is pattern ko samajhna aur sahi tarah se interpret karna traders ke liye zaroori hai. Candlestick patterns jaise Three Black Crows market analysis ke liye valuable tools hote hain aur inko effectively use karna traders ke liye consistent profitability achieve karne mein madad deta hai.

      Three Black Crows pattern ke study aur practice ke through traders apne technical analysis skills ko improve kar sakte hain aur market ke movements ko better predict karne mein saksham ho sakte hain. Isliye har trader ko candlestick patterns ki study aur unke practical application par focus karna chahiye jo unhe successful trading journey mein help karega.

      14. Final Thoughts

      Candlestick patterns jaise Three Black Crows market analysis ke liye valuable tools hote hain. Inko samajhna aur effectively use karna traders ko consistent profitability mein madad deta hai. Isliye har trader ko in patterns ke study aur practice par focus karna chahiye.

      Yeh tha mukhtasar jankari Three Black Crows candlestick pattern ke baray mein. Umeed hai ke yeh article aap ke liye informative raha hoga aur aapko candlestick patterns ki samajh mein madad milegi. Trading mein successful hone ke liye, technical analysis ke saath-saath risk management aur market psychology ko bhi samajhna zaroori hai.
      • #4 Collapse

        1. Candlestick Patterns: Introduction

        Forex trading, being a complex arena, relies heavily on technical analysis to gauge market sentiment and predict future price movements. Candlestick patterns are integral to this analysis as they offer visual insights into market behavior over specific time periods. Each pattern carries unique significance and helps traders make informed decisions based on price action.

        Expanding on Candlestick Patterns:

        Candlestick patterns date back to 18th century Japan and gained popularity in the West in the late 20th century due to their effectiveness in technical analysis. These patterns are formed by the open, high, low, and close prices of a security during a given period, typically depicted in a candlestick chart. They provide a graphical representation of market psychology, indicating whether buyers or sellers are in control at any given time.

        Understanding candlestick patterns involves recognizing various formations such as single candle patterns (like Doji and Hammer), dual candle patterns (like Bullish/Bearish Engulfing), and multiple candle patterns (like Three Black Crows and Three White Soldiers). Each pattern conveys specific information about potential price reversals, continuations, or indecision in the market.

        2. Three Black Crows: Kya Hota Hai?

        The "Three Black Crows" pattern is a potent bearish reversal pattern that typically appears after a strong uptrend in a market. It consists of three consecutive long-bodied black (downward) candles, each closing progressively lower than the previous one. This formation signals a shift in market sentiment from bullish to bearish and suggests potential further downward movement in prices.

        Expanding on Three Black Crows:

        Identifying the Three Black Crows pattern involves observing three consecutive candles where each opens within the body of the previous candle and closes below the prior candle's low. The candles should have minimal or no upper wicks (shadows), indicating strong selling pressure throughout the session.

        3. Three Black Crows: Pattern Ki Tashreeh

        To recognize the Three Black Crows pattern effectively, it's crucial to understand its structural components:
        • The first candle opens higher but closes significantly lower, indicating initial selling pressure after an uptrend.
        • The second candle opens lower than the previous close and continues to sell off, closing even lower.
        • The third candle opens lower than the second candle's close and continues the bearish momentum, often closing near its low for the session.

        This sequence demonstrates increasing seller dominance and confirms a potential trend reversal from bullish to bearish.

        4. Pehla Candle

        The first candle in the Three Black Crows pattern is pivotal as it sets the stage for subsequent bearish movements. It typically opens higher than the previous close but ends significantly lower, often with a long black body indicating substantial selling pressure. This candle's size and bearish close are critical in establishing initial market sentiment.

        Expanding on Pehla Candle:

        The first candle's characteristics help traders gauge the strength of the prevailing uptrend and the intensity of subsequent selling pressure. A large, bearish candle with a close near its low suggests strong selling conviction and sets the tone for potential further downside in prices.

        5. Dusra Candle

        The second candle in the Three Black Crows pattern opens lower than the first candle's close and continues the downward trajectory. It typically maintains a bearish tone throughout the session, closing even lower than its opening price. This candle's continuation of the bearish momentum reinforces the emergence of a potential trend reversal.

        Expanding on Dusra Candle:

        Traders closely monitor the second candle's behavior to confirm the strength of selling pressure initiated by the first candle. A strong bearish close, preferably near the session low, validates the continuation of the bearish trend and reinforces the bearish sentiment established by the first candle.

        6. Teesra Candle

        The third candle in the Three Black Crows pattern is crucial for confirming the bearish reversal. It opens lower than the second candle's close and continues to sell off throughout the session, closing near its low. This candle typically has a similar or larger body than the second candle, indicating sustained selling pressure and strong bearish sentiment.

        Expanding on Teesra Candle:

        The third candle completes the formation of the Three Black Crows pattern by extending the downtrend established by the first two candles. Its strong bearish close below the previous candle's low further solidifies the reversal signal, suggesting that sellers are firmly in control and likely to drive prices lower in the near term.

        7. Three Black Crows: Market Sentiment

        The Three Black Crows pattern is renowned for its ability to reflect a significant shift in market sentiment from bullish optimism to bearish pessimism. After a sustained uptrend, the emergence of three consecutive large black candles signals a reversal of fortunes for the bulls. Traders interpret this pattern as a strong indication of potential further downside in prices, prompting them to consider bearish strategies such as selling positions or entering short trades.

        Expanding on Market Sentiment:

        Market sentiment plays a crucial role in interpreting candlestick patterns like the Three Black Crows. The pattern's formation suggests that buyers have lost control, and sellers are aggressively stepping in to drive prices lower. This shift in sentiment is often accompanied by increased volume, further validating the pattern's reliability as a bearish reversal signal.

        8. Three Black Crows: Confirmation

        While recognizing the Three Black Crows pattern visually is essential, traders often seek additional confirmation before making trading decisions. They may use technical indicators such as the Relative Strength Index (RSI), Moving Average Convergence Divergence (MACD), or volume analysis to validate the pattern's signal. An increase in trading volume during the formation of the Three Black Crows pattern enhances its reliability as a bearish reversal signal.

        Expanding on Confirmation:

        Confirmation of the Three Black Crows pattern involves assessing various factors beyond visual identification. Traders look for a significant increase in volume, which indicates strong participation by sellers and reinforces the pattern's validity. Additionally, confirming indicators like the RSI or MACD showing overbought conditions or bearish divergences further support the likelihood of a bearish reversal.

        9. Three Black Crows: Trading Strategies

        Traders employ various strategies based on the Three Black Crows pattern to capitalize on potential bearish movements in the market:
        • Short Selling: After identifying the Three Black Crows pattern, traders may consider entering short positions to profit from anticipated downward price movements.
        • Put Options: Options traders may purchase put options or construct bearish option strategies to benefit from a decline in the underlying asset's price.
        • Risk Management: Implementing effective risk management techniques, such as placing stop-loss orders above the pattern's high or adjusting position sizes based on risk tolerance, is crucial to mitigate potential losses.

        Expanding on Trading Strategies:

        Each trader may adapt their strategy based on their risk tolerance, market conditions, and time horizon. Some traders prefer to wait for additional confirmations or use complementary technical indicators to refine their entry and exit points. The goal is to maximize profitability while managing risks effectively.

        10. Three Black Crows: Stop Loss Aur Target

        Setting appropriate stop-loss and profit-target levels is essential when trading based on the Three Black Crows pattern:
        • Stop Loss: Traders typically place a stop-loss order above the highest point of the pattern or above recent swing highs to limit potential losses if the market moves against their position.
        • Target Levels: Identifying potential support levels or using technical analysis tools such as Fibonacci retracements to determine profit-taking levels can help traders set realistic targets.

        Expanding on Stop Loss Aur Target:

        Stop-loss and target levels are integral parts of risk management in trading. They help traders maintain discipline and protect capital from excessive losses. Setting a stop-loss order ensures that losses are controlled if the market moves unexpectedly, while profit targets enable traders to secure gains at predetermined price levels.

        11. Three Black Crows: Risk Management

        Effective risk management is crucial when trading the Three Black Crows pattern to preserve capital and optimize trading performance:
        • Position Sizing: Determine the appropriate position size based on risk tolerance and account size to avoid overexposure to a single trade.
        • Diversification: Spread risk across multiple assets or trades to reduce the impact of adverse market movements.
        • Monitoring: Continuously monitor open positions and adjust stop-loss levels as the trade progresses to protect profits and minimize losses.

        Expanding on Risk Management:

        Risk management is a cornerstone of successful trading and involves proactive measures to mitigate potential losses. By adhering to sound risk management principles, traders can maintain consistency in their trading approach and increase their chances of long-term profitability.

        12. Three Black Crows: Real-Life Example

        To illustrate the application of the Three Black Crows pattern in real-life trading scenarios, consider the following hypothetical example involving a currency pair:

        Real-Life Example:

        Suppose a currency pair has been experiencing a prolonged uptrend, with prices steadily climbing over several weeks. Traders who are monitoring the charts notice the emergence of three consecutive large black candles on the daily chart. Each candle opens higher than the previous day's close but closes significantly lower, indicating a shift in market sentiment.
        • First Candle: The initial candle opens at a higher level but closes near its low, signaling the onset of selling pressure after the uptrend.
        • Second Candle: The second day opens lower than the previous day's close and continues to sell off throughout the session, closing even lower.
        • Third Candle: On the third day, the market opens lower than the second day's close and maintains a downward trajectory, closing near its low for the day.

        In this example, the formation of three consecutive black candles suggests that sellers have gained control, overpowering the previous bullish momentum. Traders who recognize this pattern may interpret it as a strong bearish reversal signal, prompting them to consider initiating short positions or tightening stop-loss levels on existing long positions.

        13. Three Black Crows: Conclusion

        The Three Black Crows pattern is a powerful tool in forex trading that provides valuable insights into potential trend reversals. By identifying this pattern after a sustained uptrend, traders can anticipate bearish price movements and adjust their trading strategies accordingly. However, it is essential to combine pattern recognition with other technical indicators and risk management techniques to enhance trading effectiveness and mitigate potential risks.

        Expanding on Conclusion:

        In conclusion, mastering candlestick patterns like the Three Black Crows requires both knowledge and practical experience in forex trading. Traders should continuously refine their skills in pattern recognition, confirmatory techniques, and risk management to navigate the complexities of the financial markets successfully.

        By understanding the nuances of the Three Black Crows pattern and its implications for market sentiment, traders can make informed decisions that align with their trading goals and risk tolerance. Whether trading for short-term gains or long-term investment strategies, integrating candlestick analysis into a comprehensive trading plan can improve overall profitability and consistency in trading outcomes.

        Final Thoughts

        Forex trading is inherently dynamic, influenced by a myriad of factors ranging from economic indicators to geopolitical events. Candlestick patterns like the Three Black Crows offer traders a visual representation of market sentiment and potential price movements, enhancing decision-making processes.

        As traders delve deeper into technical analysis and candlestick patterns, they empower themselves with tools to interpret market behavior effectively. Whether identifying trend continuations, reversals, or periods of indecision, the ability to leverage candlestick patterns such as the Three Black Crows enhances one's ability to navigate and capitalize on opportunities in the forex market.

        Continued learning, practice, and adaptation to evolving market conditions are essential for traders seeking sustainable success in forex trading. By integrating technical analysis tools like candlestick patterns into their trading strategies, traders can enhance their ability to identify high-probability trading opportunities and manage risks effectively.
        • #5 Collapse

          Three black crows is a bearish candlestick pattern that is used in technical analysis to predict the reversal of a current uptrend. Here's how it is identified:

          Appearance: The pattern consists of three consecutive long-bodied bearish candles. Each candle should open within the body of the previous candle and close near its low, creating a pattern where each session opens at or below the previous close, indicating strong selling pressure throughout the period

          Meaning: Three black crows suggest a strong shift in market sentiment from bullishness to bearishness. It typically forms after a price advance and indicates that sellers have taken control, pushing the price lower with each session

          Confirmation: Traders often look for other indicators or confirmation signals to validate the pattern, such as high trading volumes accompanying the pattern formation or additional technical indicators showing overbought conditions prior to the pattern

          Reversal Signal: As a reversal pattern, the appearance of three black crows after an uptrend suggests that further downside movement is likely. Traders might interpret it as a signal to sell or to avoid taking new long positions until the trend shows signs of reversing again

          Overall, the three black crows pattern is a powerful bearish indicator in candlestick charting, signaling a potential trend reversal and providing insights into market psychology shifting from optimism to pessimism.


          Characteristics of Three Black Crows Pattern

          : Formation
          The pattern consists of three consecutive long-bodied bearish (downward) candles
          Each candle opens within the body of the previous candle and closes near its low, indicating strong selling pressure throughout each session
          Ideally, each candle should have little to no upper shadow (wick) and a long real body, demonstrating a significant decline in price from open to close.

          : Market Contex
          Three black crows typically appear after an uptrend or during a rally. phas
          They signal a reversal of the uptrend and the potential beginning of a downtrend or a significant pullback
          The pattern reflects a transition in market sentiment from bullish (buyers in control) to bearish (sellers gaining control)

          Psychological Implications
          The formation of three black crows suggests that sellers are aggressively pushing prices lower over three consecutive trading sessions
          Each subsequent candle reinforces the bearish sentiment as it opens lower than the previous day’s close and continues to sell off throughout the session.

          . Volume Considerations
          Traders often look for confirmation through trading volumes. An increase in volume during the formation of the three black crows pattern strengthens its validity as a reversal signal.
          High volume on the third day of the pattern can indicate strong conviction among sellers.

          Confirmation and Trading Strategies
          Traders typically wait for the third candle to close to confirm the pattern
          Some may look for additional confirmation signals such as a break below key support levels, bearish indicators on oscillators (like RSI or MACD), or other bearish candlestick patterns.

          Risk Management:​​​​
          When trading based on three black crows, risk management is crucial. Stop-loss orders can be placed above the high of the third candle to manage potential losses if the pattern fails to confirm the reversal
          Traders may also consider waiting for a pullback or a confirmation of the downtrend before entering short positions

          Example:
          In practice, imagine a stock that has been steadily rising. The three black crows pattern might appear when the stock reaches a peak:
          - Day 1: The stock opens slightly below the previous day's close and closes significantly lower.
          - Day 2: Opens lower than the previous day's close and closes even lower than Day1
          - Day 3: Opens lower again, continues to sell off, and closes near the low of the day.

          This sequence indicates a strong shift in sentiment from buying to selling, suggesting that the uptrend may be reversing.

          Conclusion:
          The three black crows pattern is a powerful bearish reversal pattern in technical analysis, indicating a potential trend change from bullish to bearish. Traders use this pattern to make informed decisions about selling or avoiding long positions, based on the strong selling pressure exhibited over three consecutive trading sessions.

          Let's dive even deeper into the details of the three black crows candlestick pattern, covering its formation, psychology, interpretation, and potential trading strategies:

          Formation of Three Black Crows Pattern:

          . Candlestick Characteristic
          First Candle: The first candle in the pattern is a long and bullish (upward) candle, indicating a strong uptrend.
          Second Candle: The second candle gaps up slightly at the open but then closes within the real body of the first candle. It is also a long bearish candle, signaling a potential weakening of the uptrend.
          Third Candle: The third candle gaps up at the open again, but this time it closes within the real body of the second candle. It is also a long bearish candle, often closing near its low for the day

          . Key Points​​​​​​
          Each of the three candles should have significant real bodies (the difference between open and close prices)
          Ideally, there should be minimal or no upper shadows (wicks) on each candle, indicating that sellers dominated the entire trading session without allowing the price to recover much from its lows.

          .Psychological and Interpretation

          Market Sentiment Shift:
          The appearance of three consecutive long bearish candles suggests a dramatic shift in market sentiment from bullishness to bearishness.
          It reflects an increasing dominance of sellers who are pushing prices lower over the course of three sessions.

          Bearish Reversal Signal:
          The pattern is considered a strong bearish reversal signal, especially when it appears after a significant uptrend.
          It indicates that the buying momentum has weakened, and sellers have taken control, potentially leading to a reversal or a significant pullback in prices.

          . Volume Confirmation
          Traders often look for confirmation of the pattern through trading volumes. An increase in trading volume during the formation of the three black crows pattern strengthens its validity as a reversal signal.
          Higher volumes on the third day of the pattern can signify strong conviction among sellers.

          Trading Strategies

          . Confirmation and Entry
          Traders typically wait for the third candle to close to confirm the pattern. This helps in avoiding false signals that might occur if the pattern is not completed.
          Some traders might wait for a subsequent pullback or a confirmation of the downtrend before entering short positions.

          Stop-Loss and Risk Management

          Risk management is crucial when trading based on three black crows. Stop-loss orders are often placed above the high of the third candle to manage potential losses if the pattern fails to confirm the reversal.
          This approach helps traders limit risk while allowing for potential profits if the downtrend continues as expected.

          . Price Targets​​​​
          Traders might set initial price targets based on key support levels or Fibonacci retracement levels. These targets can help in determining where to take profits or adjust stop-loss orders as the trade progresses.

          Example Application:

          - Suppose a stock has been in an uptrend for several weeks, reaching new highs. Traders observing the price action notice the formation of three consecutive days where each day opens higher but closes significantly lower than the previous day, forming long bearish candles without upper shadows. This sequence indicates that sellers are gaining control and potentially reversing the uptrend.

          Conclusion:

          The three black crows pattern is a potent bearish signal in technical analysis, signaling a potential trend reversal from bullish to bearish sentiment. Traders use this pattern along with other technical indicators and volume analysis to make informed trading decisions. Proper risk management and confirmation techniques are essential when incorporating this pattern into a trading strategy.
          • #6 Collapse

            1. Introduction


            Candlestick patterns market mein technical analysis mein ek ahem tool hain jo traders ko market ke uchalne aur girne ke signals dene mein madad dete hain. In patterns mein se ek jo khaas ahmiyat rakhta hai wo hai "Three Black Crows."
            2. What is a Candlestick Pattern?


            Candlestick patterns aam tor par financial markets mein price movements ko graphically represent karte hain. Ye patterns market sentiment aur future price movements ke potential ko indicate karte hain.
            3. Candlestick Patterns ki Ahmiyat


            Traders candlestick patterns ka istemal karke securities ko khareedne aur bechne ke decisions mein mustaid honay ki koshish karte hain. Ye patterns trend reversals, continuations, ya market mein indecision ko point out kar sakte hain.
            4. Candlesticks ki Bunyadi Malumat


            Har candlestick ek mukhtalif arsay ki trading activity ko represent karta hai, aam tor par ek din ka. Har candlestick mein open, high, low, aur close prices darj hote hain jo us time frame mein hote hain.
            5. Three Black Crows Pattern Defined


            Three Black Crows pattern ek bearish reversal pattern hai jo teen mufeed surk (ya kala) candles se bana hota hai jin mein har ek candle neechay ki taraf move karte hue close hoti hai. Har candle previous candle ke body mein open hoti hai aur apni low ke qareeb close hoti hai.
            6. Three Black Crows ki Khasoosiyat
            • Teen lambi surk (ya kala) candles jo ek ke baad ek aati hain.
            • Har candle previous candle se neechay open hoti hai.
            • Har candle apni low ke qareeb close hoti hai, jis se zahir hota hai ke selling pressure zyada hai.
            • Behtar tareen scenario mein har candle ke upper shadow (wick) chota hota hai aur real body lambi hoti hai.
            7. Psychology ke Asar


            Ye pattern bullish se bearish ki taraf taqatwar shift ki alamat deta hai. Is se maloom hota hai ke consecutive sessions mein sellers dominate kar rahe hain aur price ko neechay ki taraf le ja rahe hain.
            8. Three Black Crows ko Identify aur Confirm Karna


            Traders Three Black Crows pattern ko identify karte hain jab teeno consecutive candles mentioned criteria ko follow karte hain. Is pattern ko confirm karne ke liye typically har candle ke saath trading volume bhi zyada hona chahiye.
            9. Three Black Crows ka Example


            Imagine karein ke ek stock jo ke uptrend mein tha, achanak teen consecutive dinon mein price neeche open hoti hai, close day ki low ke qareeb hoti hai aur har din ki low previous day ki low se kam hoti hai. Ye Three Black Crows pattern ko form karta hai.
            10. Three Black Crows se Trading Strategies
            • Short Selling: Traders is pattern ko confirm hone ke baad short-selling ya existing long positions ko exit karne ka faisla kar sakte hain.
            • Risk Management: Is pattern ke upar stop-loss orders lagana zaroori hai taake agar market expectations ke khilaaf move ho to nuqsan ko kam kiya ja sake.
            11. Limitations aur Considerations


            Three Black Crows pattern bearish reversal ko indicate karta hai lekin comprehensive analysis ke liye dusre technical indicators aur market conditions ko bhi ghor se dekhna zaroori hai.
            12. Variations aur Similar Patterns


            Is pattern ki variations mein Three Falling Peaks aur Evening Star shamil hain jo ke candlestick shapes aur sequences mein farq la sakte hain lekin unki general sentiment bearish hoti hai.
            13. Real-World Applications


            Traders different financial markets jaise ke stocks, forex, aur commodities mein candlestick patterns jaise Three Black Crows ka istemal karte hain taake price movements ko anticipate karke trading strategies ko adjust kar sakein.
            14. Historical Context


            Three Black Crows pattern Japanese candlestick charting techniques se wabasta hai jo ke centuries purani hain. Ye techniques modern financial markets mein adapt aur popular hui hain.
            15. Volume ki Ahmiyat


            Three Black Crows pattern ko confirm karne ke liye volume analysis ka istemal zaroori hai. Har candle ke formation ke waqt zyada trading volumes is bearish signal ko confirm karte hain.
            16. Aam Ghalatiyan


            Naye traders kabhi kabhi random price fluctuations ko Three Black Crows samajhte hain. Is liye zaroori hai ke confirmation ka intezaar kiya jaye aur mazeed market context ko bhi samjha jaye.
            17. Technical Analysis Tools


            Traders candlestick patterns ke saath doosre technical tools jaise moving averages, RSI (Relative Strength Index), aur MACD (Moving Average Convergence Divergence) ka istemal karte hain taake trading decisions ko enhance kiya ja sake.
            18. Conclusion


            Three Black Crows pattern financial markets mein bearish reversals ko indicate karta hai jo ke traders ko market sentiment aur price dynamics ke bare mein valuable insights deta hai.
            19. Final Thoughts


            Candlestick patterns jaise Three Black Crows ko samajhna aur recognize karna traders ki capability ko enhance karta hai volatile markets mein navigate karne mein, informed decisions lene mein aur risks ko effectively manage karne mein madad deta hai.

            In insights ko leverage karke, traders apne trading outcomes ko improve kar sakte hain aur market opportunities ko greater confidence ke saath exploit kar sakte hain. Continuous learning aur practice technical analysis ke mastery ke liye mukhtasir hai.
            • <a href="https://www.instaforex.org/ru/?x=ruforum">InstaForex</a>
            • #7 Collapse

              Forex Trading Mein Three Black Crows Candlestick Pattern: Aik Mukammal Guide

              Forex trading duniya bhar mein bohot se logon ke liye ek maqbool aur moaz shugal ban chuki hai. Is article mein hum ek ahem candlestick pattern, Three Black Crows, ke bare mein baat karenge jo traders ko market trends ko samajhne mein madad deti hai. Chaliye, is mukammal guide ke zariye is pattern ko samjhte hain.
              1. Three Black Crows Pattern Kya Hai?


              Three Black Crows aik candlestick pattern hai jo ke tezi se mandhi ke trend ko indicate karta hai. Yeh pattern teen consecutive bearish candles par mushtamil hota hai jo market mein mandhi ke aaghaaz ka pata deti hain. Pehli candle previous bullish trend ke baad banti hai aur aglay do candles usi trend ko continue karte hue market ke downtrend ka signal deti hain. Har candle ke open price previous candle ke close price ke aas paas hoti hai, jo ye batata hai ke market sellers ke control mein aa chuki hai. Is pattern ka paida hona yeh indicate karta hai ke market mein bear market ka aghaz ho raha hai aur sellers ne buyers ko dominate karna shuru kar diya hai.
              2. Is Pattern Ki Pehchan


              Is pattern ki pehchan karna aasan hai. Teeno candles ka close previous candle se niche hota hai aur har candle ka open price previous candle ke middle se thoda upar hota hai. Pehli candle ka shadow chhoti hoti hai ya bilkul nahi hoti, jabke aglay candles ka shadow bhi chhota hota hai. Yeh pattern sirf bearish market ke liye relevant hai. Teeno candles ki bodies bhi achi khasi lambi hoti hain, jo ke market ke strong bearish sentiment ko indicate karti hain. Yeh pattern aksar long downtrend ke baad nazar aata hai jo ke trend reversal ka sign hota hai.
              3. Pattern Ka Maani


              Three Black Crows ka mtlab yeh hota hai ke buyers market mein control kho chuke hain aur sellers ne qabza jama liya hai. Yeh market ke trend ke ulatne ka sign hota hai, jo ke uptrend se downtrend ki taraf ja raha hota hai. Iska matlab yeh hai ke market participants, jo ke pehle buyers the, ab apni positions close kar rahe hain aur naye sellers market mein enter ho rahe hain. Yeh trend reversal ka aik strong indication hota hai aur aksar market mein significant price decline ka sabab banta hai.
              4. Pattern Ka Timing


              Is pattern ka timing bohot ahem hota hai. Agar yeh pattern ek uptrend ke baad nazar aaye, to yeh ek mazid reliable indication hai ke market ab niche jane wali hai. Aam tor par, yeh pattern ek reversal trend ko dikhata hai. Market ke previous trend ko analyze karte hue is pattern ki appearance ko dekhna chahiye. Agar yeh pattern ek strong bullish trend ke baad nazar aaye, to yeh indication mazid strong ho jati hai ke market ab bearish territory mein enter ho rahi hai. Pattern ka timing ke saath analysis aur confirmation, forex trading mein profitable decisions lene ke liye bohot zaroori hai.
              5. Is Pattern Ka Forex Mein Istemaal


              Forex trading mein, Three Black Crows pattern ka istimaal karke traders apne trades ko manage kar sakte hain. Yeh pattern unhein batata hai ke ab market bearish trend mein enter ho rahi hai aur unhein apni positions exit karni chahiye ya sell trades initiate karni chahiye. Forex market mein, yeh pattern aksar major currency pairs par nazar aata hai aur us waqt sab se effective hota hai jab yeh high volatility market mein banta hai. Is pattern ka istimaal karte hue traders ko market ke broader trend aur macroeconomic indicators ka bhi khayal rakhna chahiye.
              6. Confirmatory Indicators Ka Role


              Three Black Crows pattern ko mazid confirm karne ke liye doosre technical indicators ka istimaal zaroori hai. Jaise ke moving averages, RSI, aur MACD. Yeh indicators pattern ki reliability ko mazid barhate hain. Agar yeh pattern moving averages ke niche banta hai ya RSI overbought zone se niche aati hai, to yeh mazid confirm karta hai ke market ab bearish trend mein enter ho chuki hai. MACD ka negative crossover bhi yeh indication de sakta hai ke ab market downward movement mein ja rahi hai. In confirmatory indicators ka istimaal karte hue traders apni trade decisions ko mazid solidify kar sakte hain.
              7. Pattern Ka Reliable Hone Ka Scale


              Is pattern ki reliability kaafi zyada hai lekin yeh market ki condition par bhi depend karta hai. Strong trends aur high volume markets mein yeh pattern ziyada accurate results de sakta hai. Agar market mein trend reversal ho raha ho aur yeh pattern tab nazar aaye, to iska significance mazid barh jata hai. Lekin, agar market mein low volume aur choppy price action ho, to is pattern ki reliability kam ho sakti hai. Yeh pattern long-term trends mein zyadatar reliable hota hai, lekin short-term trends mein yeh false signals bhi de sakta hai.
              8. Risk Management Ki Zaroorat


              Three Black Crows pattern ke basis par trade karte waqt risk management ka khayal rakhna zaroori hai. Stop-loss orders aur proper position sizing ki madad se potential losses ko kam kiya ja sakta hai. Aksar traders yeh galti karte hain ke sirf pattern ke basis par bade trades le lete hain aur risk management ko nazarandaz karte hain. Stop-loss ko appropriate level par set karna, jaise ke previous support level ke upar, ek acha risk management strategy hai. Position sizing ko market ke volatility ke hisaab se adjust karna bhi zaroori hai taake unexpected market movements ke asar ko kam kiya ja sake.
              9. Pattern Ka Timeframe


              Forex trading mein, yeh pattern mukhtalif timeframes par dikhayi de sakta hai. Lekin higher timeframes, jaise ke daily ya weekly charts, par is pattern ki accuracy aur reliability ziyada hoti hai. Lower timeframes, jaise ke hourly ya minute charts, par yeh pattern false signals bhi de sakta hai. Isliye higher timeframes ko analyze karna aur unhi par trading decisions lena zyada behtar hota hai. Higher timeframes par yeh pattern long-term trend reversal ka indication de sakta hai, jo ke traders ko market ke broader direction ke baray mein valuable information de sakta hai.
              10. Pattern Ka Psychology Par Asar


              Yeh pattern traders ki psychology par bhi asar andaz hota hai. Jab yeh pattern banta hai to market participants me panic aur fear ka mahsoos hota hai, jo selling pressure ko mazid barha sakta hai. Is pattern ka paida hona market mein bearish sentiment ko barhata hai aur aksar traders apni bullish positions ko close karne lagte hain. Yeh psychological effect market mein aur zyada selling pressure ko janam deta hai jo price decline ko mazid intensify karta hai. Market participants ke psychology ko samajhna aur uske mutabiq trading strategies ko adjust karna profitable trading ke liye bohot zaroori hai.
              11. Pattern Ka Scalping Mein Istemaal


              Scalping jaise short-term trading strategies mein Three Black Crows pattern ko dekha jata hai, lekin iska istimaal ziyada long-term positions ke liye kiya jata hai. Scalpers ke liye yeh pattern itna relevant nahi hota kyun ke yeh mostly long-term trend reversal ka indication deta hai. Scalping strategies mein quick price movements aur short-term trends ko analyze karna hota hai, jab ke Three Black Crows pattern mostly long-term trend ke changes ko indicate karta hai. Lekin scalpers is pattern ko apni short-term trend analysis ko confirm karne ke liye bhi use kar sakte hain.
              12. Pattern Ki Limitations


              Three Black Crows pattern ki kuch limitations bhi hain. Yeh pattern false signals bhi de sakta hai agar market me sufficient volume na ho ya agar doosri confirmations na mil rahi ho. Yeh pattern aksar low volume markets mein reliable nahi hota kyun ke wahan par price movements zyadatar speculative hote hain. Isi tarah, agar yeh pattern lower timeframes par nazar aaye, to iska relevance kam ho jata hai. False signals ko avoid karne ke liye, yeh zaroori hai ke is pattern ko doosre technical indicators ke saath cross-check kiya jaye aur macroeconomic factors ka analysis bhi kiya jaye.
              13. Pattern Aur Fundamental Analysis


              Is pattern ko sirf technical analysis ke zariye samajhna kafi nahi hai. Fundamental analysis, jaise ke economic indicators aur news events, bhi pattern ki confirmation aur analysis mein madadgar sabit ho sakti hain. Market ka broader economic environment, central bank policies, aur geopolitical events bhi market trends ko affect karte hain. Yeh zaroori hai ke Three Black Crows pattern ke saath saath economic calendar aur news events ko bhi monitor kiya jaye taake market trends ke baray mein comprehensive understanding hasil ho sakay.
              14. Pattern Ki Practical Application


              Practical application ke liye, traders ko demo accounts par is pattern ka istimaal karke practice karni chahiye. Yeh unhein real market mein is pattern ko effectively apply karne mein madad degi. Demo accounts par trading karke, traders apne trading strategies ko bina kisi financial risk ke test kar sakte hain. Yeh unhein pattern ki nuances aur uski interpretation ko samajhne mein madad degi. Practical application ka ek aur aspect yeh hai ke traders ko market ke broader context aur trend analysis ke sath is pattern ko integrate karna chahiye taake unki trading decisions ziada accurate aur profitable ho sake.
              Khatima


              Three Black Crows candlestick pattern ek powerful tool hai jo Forex traders ko market trends ko samajhne aur profitable trades karne mein madad karta hai. Lekin, is pattern ka istimaal karte waqt proper risk management aur additional confirmations zaroori hain. Forex trading mein success hasil karne ke liye, is pattern ko sahi tarike se samajhna aur apply karna bohot zaroori hai. Is pattern ko samajhne aur effectively apply karne se traders market ke bearish trends ko pehchan kar profitable trading decisions le sakte hain.

              اب آن لائن

              Working...
              X