Bsuc trend line trading strategy

No announcement yet.
`
X
  • وقت
  • دکھائیں
Clear All
new posts
  • #1 Collapse

    Bsuc trend line trading strategy
    Introduction

    yeh forex market ke aik series hote hey jo keh forex market kay trader ko bhe aik sath jama karte hey or forex market mein aik basic trading set up ke bhe tameer karte hey or forex market mein es method kay sath sath forex market ka tabadala kheyal karen gay agerchay forex market mein koi aik strategy kabel e yaqeen nahi hote hey forex market mein es kesam ke strategy kay sath mel kar he trading ke ja sakte hey takeh forex market ka trend saz mahol mazeed ache market mein entry oe exit kay hasel karnay mein madad kar saktay hein
    trend line trading strategy aik simple kesam ke trading strategy hote hey yeh aik or single kesam ka sab say important tool hota hey forex market ke price mein lower o upper limit kay asol ko mela kar aik bohut he acha trading method hota hey market mein aik dahlwan ka idea lagana aik objective he hota hey jo keh forex market mein es bat ko identify kar sakte hey market mein price kahan parsupport or resistance ko bhe identify kar sakte hey

    DXY Daily ka price chart

    Click image for larger version

Name:	Forex-Introduction-to-Basic-Trendline-Analysis_body_USDJPY_Trendline_Example.png
Views:	35
Size:	21.7 کلوبائٹ
ID:	13008414
    forex market kay trend line kay analysis forex market mein science say zyada art ke shape mein he ho saktay hein kunkeh es kay le kese bhe kesam ke subjectivity ke bhe zaroorat hote hey os nay kaha trend line banatay time market kese bhe kesam kay touch points hotay hein es ka matlab yeh hota hey keh trend line action bullish bhe ho sakta hey

    USD Index example


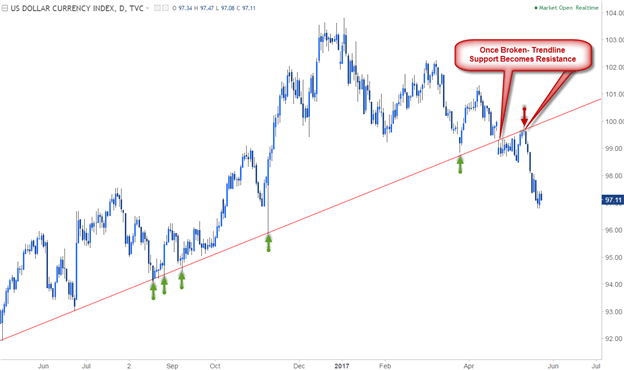
    nechay USD Index ke aik mesal de gay hey jes ka slop forex market mein bullish outlook ko paish karta hy jes mein forex market ke price ka trend zyada honay mein buy karnay ke bare planning bhe ho sakte hey hamara forex market mein entry point kahan hona chihay forex market mein trend line market mein pull back ka sab sayzyada saz gar mahol frahm kar sakta hey
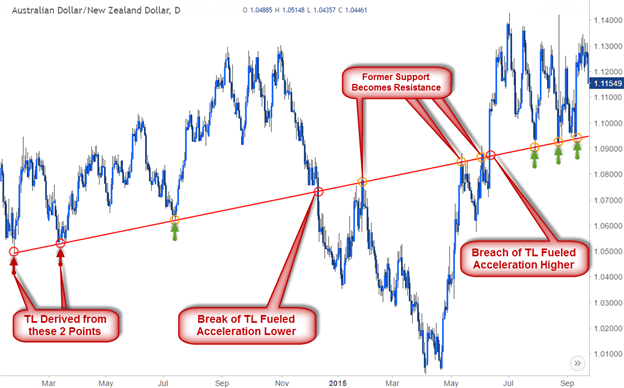
    AUD/NZD Daily Chart

    forex market mein trend line resistance say oper hote hey es line kay bad anay walay high point par support kay tor par bhe daikh saktay hein nechay de gay AUD/NZD ke nechay ke mesal de gay hey estarah single trend line spectrum kay tor par support or resistance kay tor par dramay paish kar sakte hey forex market ke dahlwan break ho jate hey 2015 say pehlay lower level bad mein wazah resistance kay tor par kam kar sakte hey
    bhali kay badlay bhali
  • <a href="https://www.instaforex.org/ru/?x=ruforum">InstaForex</a>
  • #2 Collapse

    Bollinger Bands Overview:


    Bollinger Bands are a technical analysis tool developed by John Bollinger. They consist of a simple moving average (usually 20 periods) and an upper and lower band that are based on standard deviations from the moving average.

    The formula is as follows: - **Middle Band (SMA)**: Typically a 20-period simple moving average (SMA). - **Upper Band**: SMA + (2 * Standard Deviation of price over 20 periods). - **Lower Band**: SMA - (2 * Standard Deviation of price over 20 periods).

    ​​​​​ MACD Overview:


    MACD (Moving Average Convergence Divergence) is another popular momentum indicator that shows the relationship between two moving averages of a security's price.
    It consists of: - **MACD Line**: The difference between a shorter-term EMA (Exponential Moving Average) and a longer-term EMA. -

    **Signal Line**:

    A 9-period EMA of the MACD Line. - **Histogram**: Represents the difference between the MACD Line and the Signal line


    ### Bollinger Bands and MACD Trend Line Strategy:

    This strategy combines the insights from Bollinger Bands and MACD to identify potential entry and exit points in the

    market based on trends and volatility

    ​​​​
    #### Entry Signals:


    1. **Bollinger Bands squeeze**

    This occurs when the Bollinger Bands contract towards the SMA, indicating low volatility. A squeeze suggests that a period of low volatility is likely to be followed by high volatility. Traders often look for a squeeze as a precursor to a breakout or significant moves in price


    MACD Crossover**:2


    Look for the MACD Line to cross above the Signal Line (bullish crossover) or below the Signal Line (bearish crossover). This crossover indicates a change in momentum.
    #### Exit Signals: 1. **Bollinger Bands Expansion**:

    ​​​​​​​After a squeeze, when the bands start to widen again, it suggests increasing volatility. Traders might consider exiting a position as volatility rises and the potential for a reversal increases. 2. **MACD Crossover Reversal**: If the MACD Line crosses back over the Signal Line in the opposite direction of your trade, it could signal a potential reversal or loss of momentum, prompting an exit from the trade. #### Strategy Execution: - **Identify Bollinger Bands Squeeze**: Monitor the Bollinger Bands for periods where the bands contract towards the SMA, indicating low volatility. - **Confirm with MACD**: Check the MACD for confirmation of momentum direction. Look for the MACD Line and Signal Line crossovers to align with the direction you expect the price to move after the squeeze. - **Entry**: Enter a long position when the price breaks above the upper Bollinger Band after a squeeze (bullish signal). Conversely, enter a short position when the price breaks below the lower Bollinger Band after a squeeze (bearish signal). - **Exit**:Consider exiting the trade as the Bollinger Bands start to widen again (indicating increasing volatility) or if there's a crossover in the MACD Line and Signal Line indicating a potential reversal. ### Risk Management: - **Stop Loss**: Always use a stop loss to limit potential losses if the trade moves against you. - **Take Profit**: Set a target profit level based on the risk-reward ratio and market conditions. - **Position Sizing**: Determine the appropriate position size based on your risk tolerance and account size. ### Conclusion: The Bollinger Bands and MACD trend line trading strategy combines volatility and momentum indicators to identify potential trend reversals and entry/exit points. It's essential to practice risk management and use additional technical analysis or fundamental analysis to complement this strategy. As with any trading strategy, backtesting and adapting to current market conditions are crucial for successful implementation.
    • #3 Collapse

      Forex Mein Bollinger Bands Aur Stochastic Oscillator Se Trend Line Trading Strategy

      Forex trading ek dynamic aur challenging field hai jahan har trader naye aur behtar tareeqe explore karta hai takay wo zyada munafa kamayen. Ek aam aur mufeed trading strategy jo beginner se le kar experienced traders tak istemal karte hain woh hai Bollinger Bands aur Stochastic Oscillator ke saath trend line trading. Is article mein hum is strategy ke bare mein mukhtasar tafseel se guftugu karenge aur isko practical examples ke zariye samajhenge.
      1. Bollinger Bands Aur Stochastic Oscillator Ki Mukhtasar Tafseel


      Bollinger Bands ek technical analysis tool hai jo price volatility aur trading range ko measure karta hai. John Bollinger ne 1980s mein ye indicator develop kiya tha. Ye bands price ke around ek upper aur ek lower boundary create karte hain jo ki standard deviation ke basis par calculate kiye jate hain. Typically, Bollinger Bands 20-period simple moving average (SMA) ke aas paas ek upper band (typically 2 standard deviations upar) aur ek lower band (2 standard deviations niche) create karte hain.

      Stochastic Oscillator bhi ek popular technical indicator hai jo price momentum ko measure karta hai. Dr. George Lane ne 1950s mein isko develop kiya tha. Ye indicator 0 se 100 ke beech range mein hota hai aur overbought (jab indicator 80 se upar jata hai) aur oversold (jab indicator 20 se neeche jata hai) conditions ko identify karta hai. Stochastic Oscillator ko usually 14-periods ke time frame par calculate kiya jata hai.
      2. Trend Line Trading Strategy Ki Ahmiyat


      Trend line trading strategy ka maqsad market ke trend ko identify karna hota hai taaki trader entry aur exit points ka sahi faisla kar sake. Ye strategy price movement ke patterns ko samajhne aur predict karne mein madad deti hai. Trend lines ko draw karne ke liye trader price ke significant highs aur lows ko connect karte hain.
      3. Bollinger Bands Ka Istemal


      Bollinger Bands ke istemal se trader price volatility ko measure kar sakte hain. Jab price upper Bollinger Band se nikalta hai ya lower Bollinger Band se bahar aata hai, to ye ek potential trading signal provide karta hai. Upper band se bahar nikalne par ye indicate karta hai ke market overbought ho sakta hai aur lower band se bahar aane par ye indicate karta hai ke market oversold ho sakta hai. Traders is signal ko confirm karne ke liye dusre indicators aur price action ka bhi istemal karte hain.
      4. Stochastic Oscillator Ka Istemal


      Stochastic Oscillator ke through trader overbought aur oversold conditions ko detect kar sakte hain. Jab indicator 80 ke upar jata hai, to ye overbought signal hai aur jab 20 ke neeche jata hai, to ye oversold signal hai. Overbought aur oversold zones ko confirm karne ke baad, traders reversal ya continuation signals ko identify karne ke liye Stochastic Oscillator ki readings ka istemal karte hain.
      5. Trend Line Ka Role


      Trend line price ke movement ko visualize karne ka ek tarika hai. Upward trend line ko higher lows ke basis par draw kiya jata hai jabki downward trend line ko lower highs ke basis par draw kiya jata hai. Trend lines price ke trend ko define karte hain aur traders ko entry aur exit points ke liye guidelines provide karte hain.
      6. Strategy Ka Istemal Kaise Karein


      Bollinger Bands aur Stochastic Oscillator ke saath trend line trading strategy ko implement karne ke liye trader ko kuch steps follow karne chahiye:
      • Step 1: Bollinger Bands aur Stochastic Oscillator ko apne trading platform par set karein.
      • Step 2: Price ke around Bollinger Bands ke behaviour ko observe karein aur upper aur lower bands ke touches ko dekhein.
      • Step 3: Stochastic Oscillator ki readings ko monitor karein overbought aur oversold zones ko identify karne ke liye.
      • Step 4: Trend line ko draw karein current price action ke basis par. Trend lines ke through price ke momentum ko samajhne aur future price direction ko predict karne ki koshish karein.
      7. Entry Points Ki Tafseel


      Entry points ko determine karne ke liye, trader ko following conditions ko dekhte hue trade karna chahiye:
      • Jab price lower Bollinger Band se bounce back karta hai upward direction mein aur Stochastic Oscillator oversold zone mein ho, to ye ek buy signal ho sakta hai.
      • Jab price upper Bollinger Band se bounce back karta hai downward direction mein aur Stochastic Oscillator overbought zone mein ho, to ye ek sell signal ho sakta hai.

      Entry points ko confirm karne ke liye traders price action, candlestick patterns aur dusre technical indicators ka bhi istemal karte hain.
      8. Exit Points Ki Tafseel


      Exit points ko decide karne ke liye trader ye factors consider karte hain:
      • Jab price trend line ko break karta hai ya trend reversal signal deta hai.
      • Jab opposite Bollinger Band ko touch karta hai. For example, agar price upper Bollinger Band se bahar gaya hai to trader lower Bollinger Band ko target kar sakta hai aur vice versa.
      • Jab Stochastic Oscillator opposite zone mein move karta hai (overbought se oversold ya vice versa), to ye ek exit signal ho sakta hai.

      Traders profit targets aur stop loss levels ko bhi set karte hain taki unka risk management sahi tareeke se ho sake.
      9. Risk Management


      Har trading strategy mein risk management ka tawazun zaroori hota hai. Stop loss aur take profit levels ko sahi tarah se set karna trading ki safety aur profitability ke liye crucial hai. Traders apne risk tolerance ke hisaab se stop loss levels set karte hain taki wo apne capital ko protect kar sake aur unexpected market movements se loss ko minimize kar sake.
      10. Real-Life Examples


      Real-life examples ke zariye samajhne ke liye, trader ko historical charts par ye strategy test karni chahiye aur past data par backtesting karna chahiye. Backtesting se trader ko strategy ke effectiveness aur potential ke bare mein pata chalta hai. Real-time market conditions mein bhi trader ko ye strategy implement karne ke results ko observe karna chahiye taki wo strategy ko refine kar sake aur apne trading approach ko improve kar sake.
      11. Psychological Aspects


      Trading mein psychological aspects ka bhi bohat bara role hota hai. Trader ko patience maintain karna aur emotions ko control karna zaroori hai taaki sahi waqt par sahi faisla kiya ja sake. Jab market volatile hota hai ya unexpected movements hote hain, tab trader ka emotional control aur discipline test hota hai. Successful traders apne trading plan ko stick karne aur apne decisions ko rationalize karne mein focused rehte hain.
      12. Conclusion


      Bollinger Bands aur Stochastic Oscillator ke saath trend line trading strategy ek mufeed aur reliable approach hai forex market mein. Is strategy ko samajhne aur perfect karne ke liye practice aur consistency ki zaroorat hoti hai. Har trader ko apne risk tolerance ke hisaab se is strategy ko customize karna chahiye aur apne trading style ke hisaab se adjustments karte hue ise implement karna chahiye. Market conditions aur price action ko samajhne ke liye traders ko continuous learning aur observation par bhi emphasize karna chahiye.
      13. Further Learning


      Further learning ke liye trader ko current market trends ko monitor karna chahiye aur successful traders ke experiences se seekh lena chahiye. Har naye concept aur technique ko samajhne ke liye education aur research ka hona bohat zaroori hai. Trader ko apne technical skills ko improve karne ke liye workshops, webinars, aur online resources ka istemal karna chahiye. Iske alawa, financial news aur market analysis ko regular basis par follow karna bhi trading knowledge ko enhance karne mein madadgar sabit ho sakta hai.

      Is article mein humne dekha ki Bollinger Bands aur Stochastic Oscillator ke saath trend line trading strategy kaise forex traders ke liye beneficial ho sakti hai. Ye approach market volatility aur price action ko analyze karne mein madad deta hai aur traders ko consistent profits kamane mein help karta hai. Trading ke field mein success achieve karne ke liye, traders ko strategy ko effectively implement karna, risk management ko prioritize karna, aur market ka deep understanding rakhna zaroori hai.
      • #4 Collapse

        Bsuc Trend Line Trading Strategy in Forex

        Forex trading me trend lines ka istemal bohot purani aur maqbool tareeqe hai. Bsuc trend line trading strategy ek aisi technique hai jo traders ko asaani se market trends ko samajhne aur unse faida uthane mein madad deti hai. Is article mein hum Bsuc trend line trading strategy ko mukammal taur par discuss karenge, jisse aap ko is technique ko behtar andaz mein samajhne mein madad milegi.
        1. Forex Trading ka Taruf


        Forex trading duniya ki sabse bari aur sabse zyadah liquid market hai. Is market mein currencies ka lena dena hota hai. Har roz, trillion dollars ki transactions hoti hain. Forex market 24 ghante, paanch din chalti hai, jis se traders ko behtareen moqe milte hain profit kamane ke liye. Is market mein different participants hote hain, jaise ke banks, financial institutions, corporations, aur individual traders. Forex trading mein profit kamane ke liye different strategies ka istemal hota hai aur trend line trading strategy inme se aik hai.
        2. Trend Lines Kya Hain?


        Trend lines woh lines hoti hain jo price chart par draw ki jati hain taake price ki direction aur trend ko identify kiya ja sake. Ye lines humein price ke highs aur lows ko connect karke market ke trend ko samajhne mein madad deti hain. Trend lines ko uptrend aur downtrend dono mein draw kiya ja sakta hai. Uptrend mein, trend line price ke low points ko connect karti hai, jabke downtrend mein, trend line price ke high points ko connect karti hai. Trend lines ko draw karne ka maqsad market ki general direction ko identify karna hota hai taake traders is information ka istemal karke profitable trades kar saken.
        3. Bsuc Trend Line Strategy ka Taruf


        Bsuc trend line strategy aik simple aur effective trading strategy hai jo market trends ko identify karne aur profitable trading decisions lene mein madadgar hai. Is strategy ka basic idea yeh hai ke jab price trend line ko break karti hai, toh yeh ek significant trading signal hota hai. Bsuc trend line strategy ko samajhne aur apply karne ke liye traders ko trend lines, support aur resistance levels, aur breakout signals ko ache tareeqe se samajhna zaroori hai. Yeh strategy her tarah ke market conditions mein kaam karti hai aur traders ko consistent profits hasil karne mein madad deti hai.
        4. Bsuc Trend Line Strategy ki Bunyadi Asasat


        Bsuc trend line strategy ki bunyad do cheezon par hai: support aur resistance levels. Trend lines ko support aur resistance levels ko identify karne ke liye istemal kiya jata hai. Jab price support level ko touch karti hai aur wahan se upar jati hai, toh yeh buying signal hota hai. Aisi hi, jab price resistance level ko touch karti hai aur wahan se neeche aati hai, toh yeh selling signal hota hai. Support levels woh levels hote hain jahan price neeche gir kar wapas upar jati hai, jabke resistance levels woh hote hain jahan price upar chadh kar wapas neeche aati hai. Trend lines in levels ko identify karne mein madadgar hoti hain.
        5. Trend Lines Draw Karna


        Trend lines draw karna bohot asaan hai. Uptrend mein, aap low points ko connect karke ek ascending trend line draw karte hain. Downtrend mein, aap high points ko connect karke ek descending trend line draw karte hain. Trend lines ko draw karte waqt hamesha do ya do se zyada points ko connect karna chahiye. Yeh ensure karta hai ke trend line accurate ho aur price movements ko ache tareeqe se represent kar rahi ho. Trend lines ko draw karte waqt yeh bhi zaroori hai ke aap false breakouts aur noise ko avoid karen. Accurate trend lines draw karne se aapko behtar trading signals milte hain.
        6. Trend Line Breakout


        Trend line breakout woh waqt hota hai jab price trend line ko cross karti hai. Breakout trading mein, jab price trend line ko cross karti hai, toh yeh ek significant signal hota hai ke trend change ho raha hai aur yeh buying ya selling ka moqa hai. Trend line breakout ke signals ko samajhne aur unko trading decisions mein implement karne se aap apne profits ko maximize kar sakte hain. Breakout trading ka maqsad market ke naye trends ko pehle identify karna aur unse faida uthana hota hai. Trend line breakouts trading ke moqon ko identify karne mein madadgar hote hain.
        7. False Breakouts se Bachna


        False breakouts woh hoti hain jab price temporarily trend line ko cross karti hai magar phir wapas apne trend mein aa jati hai. False breakouts se bachne ke liye confirmation signals ka intezar karna chahiye, jaise ke candlestick patterns ya volume indicators. Confirmation signals ka intezar karke aap false breakouts ke risk ko kam kar sakte hain aur apne trades ko behtar bana sakte hain. False breakouts se bachne ke liye proper analysis aur patience zaroori hai. Trend line breakouts ko confirm karne ke liye multiple indicators ka istemal karna chahiye taake aapke trading decisions accurate aur profitable hon.
        8. Entry Points


        Bsuc trend line strategy mein entry points identify karna bohot zaroori hai. Jab price trend line ko break karti hai aur confirmation signal milta hai, toh yeh entry point hota hai. Aap buy kar sakte hain jab ascending trend line break ho aur sell kar sakte hain jab descending trend line break ho. Entry points ko identify karte waqt proper analysis aur confirmation signals ka intezar zaroori hai. Entry points ko accurately identify karke aap profitable trades kar sakte hain aur market trends se faida utha sakte hain. Entry points ko samajhne aur implement karne se aap apne trading performance ko behtar bana sakte hain.
        9. Stop Loss Placement


        Stop loss placement ek zaroori hissa hai Bsuc trend line strategy ka. Stop loss ko trend line ke thoda neeche (uptrend mein) ya thoda upar (downtrend mein) place karna chahiye. Yeh aapke losses ko limit karne mein madad karega agar market aapki expectation ke khilaf chal jaye. Stop loss placement se aap apne capital ko protect kar sakte hain aur unnecessary losses se bach sakte hain. Stop loss placement ko accurate aur logical points par set karna chahiye taake aapke trades secure hon aur risk manage ho. Proper stop loss placement se aap apne trading strategy ko behtar bana sakte hain.
        10. Take Profit Targets


        Take profit targets set karna bhi zaroori hai. Yeh aapke trades ko timely close karne aur profits ko secure karne mein madad karta hai. Take profit target ko pehle ke support ya resistance level par set karna chahiye. Take profit targets se aap apne profits ko timely secure kar sakte hain aur unnecessary market movements se bach sakte hain. Take profit targets ko logical aur realistic points par set karna chahiye taake aapke trades profitable hon aur market trends se faida uthaya ja sake. Proper take profit targets set karke aap apne trading performance ko enhance kar sakte hain.
        11. Risk Management


        Forex trading mein risk management bohot zaroori hai. Bsuc trend line strategy ke saath proper risk management techniques ko istemal karna chahiye, jaise ke position sizing aur risk/reward ratio ko maintain karna. Risk management se aap apne capital ko protect kar sakte hain aur unnecessary losses se bach sakte hain. Risk management ka maqsad aapke trades ko secure karna aur aapke capital ko protect karna hota hai. Proper risk management techniques ko implement karke aap apne trading strategy ko effective aur profitable bana sakte hain.
        12. Timeframes ka Intekhaba


        Different timeframes par trend lines ko study karna bhi zaroori hai. Bsuc trend line strategy ko different timeframes, jaise ke daily, weekly, aur monthly charts par apply kar sakte hain. Short-term aur long-term trends ko samajhne ke liye multiple timeframes ka analysis zaroori hai. Timeframes ka intekhaba trading strategy ko behtar bana sakta hai aur market trends ko accurate tareeqe se identify karne mein madadgar hota hai. Different timeframes ko study karke aap apne trading decisions ko enhance kar sakte hain aur market trends se faida utha sakte hain.
        13. Technical Indicators ka Izaafa


        Technical indicators ka istemal Bsuc trend line strategy ko behtar bana sakta hai. Indicators jaise ke moving averages, RSI, aur MACD ko trend lines ke saath combine karke behtar trading signals hasil kar sakte hain. Technical indicators ka maqsad market trends ko accurate tareeqe se identify karna aur trading signals ko confirm karna hota hai. Technical indicators ko trend lines ke saath combine karke aap apne trading decisions ko behtar aur profitable bana sakte hain. Technical indicators ka istemal karke aap apne trading strategy ko enhance kar sakte hain.
        14. Bsuc Trend Line Strategy ka Nateeja


        Bsuc trend line trading strategy forex trading mein aik maqbool aur effective strategy hai. Yeh simple hai magar bohot powerful signals provide karti hai jo profitable trades ko execute karne mein madadgar hai. Proper risk management aur technical analysis ke saath, Bsuc trend line strategy aapko consistent profits hasil karne mein madad kar sakti hai. Is strategy ko apne trading plan mein shaamil karke aap behtar trading decisions le sakte hain aur forex market mein kamiyab ho sakte hain.

        Detailed Explanation:

        Forex trading me trend lines ko samajhna aur unhe sahi tareeqe se apply karna bohot zaroori hai. Trend lines humein market ki general direction aur price movements ke baare mein valuable information provide karti hain. Bsuc trend line strategy ek simple magar powerful strategy hai jo market trends ko identify karne aur profitable trading decisions lene mein madad karti hai. Is strategy ko apply karte waqt proper analysis aur risk management techniques ka istemal zaroori hai. Trend lines ko accurate tareeqe se draw karke aur confirmation signals ka intezar karke aap apne trades ko profitable bana sakte hain.

        Forex trading mein Bsuc trend line strategy ka istemal karke aap market trends ko accurately identify kar sakte hain aur profitable trades execute kar sakte hain. Is strategy ko samajhne aur apply karne ke liye aapko trend lines, support aur resistance levels, aur breakout signals ko ache tareeqe se samajhna zaroori hai. Proper risk management aur technical analysis ke saath, Bsuc trend line strategy aapko consistent profits hasil karne mein madad kar sakti hai. Is strategy ko apne trading plan mein shaamil karke aap behtar trading decisions le sakte hain aur forex market mein kamiyab ho sakte hain.

        • #5 Collapse

          Forex Trading Mein Trend Line Trading Strategy

          1. Forex Trading Ka Ta'aruf


          Forex trading yaani foreign exchange trading aik aisa bazaar hai jahan mukhtalif mulkon ki currencies ka lein dein hota hai. Yeh bazaar duniya ka sabse bara financial market hai jahan rozana trillion dollars ka lein dein hota hai. Forex market decentralised hoti hai aur yeh 24 ghante, panch din chalu rehti hai. Is mein currencies ke pairs ka lein dein hota hai, jaise USD/EUR ya GBP/JPY. Forex trading se traders ko profit kamane ka moka milta hai jab woh currency ke price fluctuations ka sahi andaaza lagate hain.
          2. Trend Line Trading Strategy Kya Hai?


          Trend line trading strategy aik technique hai jo forex trading mein istimaal hoti hai. Is strategy ka maqsood yeh hota hai ke market ke trend ko pehchana ja sake aur is trend ke mutabiq trades ki ja sakein. Trend lines simple lines hoti hain jo market ke highs aur lows ko connect karti hain. Yeh lines market ka trend depict karti hain aur trader ko batati hain ke kis direction mein price move kar raha hai. Trend line trading strategy se traders ko market ke overall trend ka pata chalta hai aur woh sahi waqt pe entry aur exit decisions le sakte hain.
          3. Trend Line Ki Pehchan


          Trend line market ke highs aur lows ko connect karti hai. Agar market upward ja rahi hai toh yeh ascending trend line hogi aur agar downward ja rahi hai toh descending trend line. Ascending trend line ka matlab hai ke market bullish hai aur price higher highs aur higher lows bana raha hai. Descending trend line ka matlab hai ke market bearish hai aur price lower highs aur lower lows bana raha hai. Trend lines se market ka trend clearly nazar aata hai aur trader ko sahi trade decisions lene mein madad milti hai.
          4. Uptrend Aur Downtrend


          Uptrend mein market ke har new high pehle se higher hotay hain aur har new low pehle se higher hota hai. Uptrend ka matlab hai ke market bullish hai aur price continuously upar ja raha hai. Downtrend mein har new low pehle se lower hota hai aur har new high pehle se lower hota hai. Downtrend ka matlab hai ke market bearish hai aur price continuously neeche ja raha hai. Uptrend aur downtrend ko samajhna forex trading mein bohot zaroori hai kyunki yeh trend lines draw karne mein madadgar hote hain.
          5. Support Aur Resistance


          Trend lines ko support aur resistance levels bhi kaha jata hai. Support wo level hai jahan price downward se upward jaati hai aur resistance wo level hai jahan price upward se downward jaati hai. Support aur resistance levels market ke key points hotay hain jahan price movement slow ho jati hai ya reverse ho sakti hai. Support level strong hota hai jab price us level se multiple times rebound karti hai aur resistance level strong hota hai jab price us level se multiple times reject hoti hai. Support aur resistance levels ko samajhna profitable trading ke liye bohot zaroori hai.
          6. Trend Line Kaise Draw Karein?


          Trend line draw karne ke liye 2 ya 2 se zyada significant points ki zaroorat hoti hai. Uptrend ke liye lowest points ko milaya jata hai aur downtrend ke liye highest points ko. Trend lines ko sahi tarike se draw karna bohot zaroori hai kyunki yeh accurate signals deti hain. Trend lines ko draw karte waqt hamesha major highs aur lows ko consider karna chahiye aur minor fluctuations ko ignore karna chahiye. Trend lines ko accurate draw karne se market ka clear trend samajhne mein madad milti hai.
          7. Breakout Kya Hota Hai?


          Jab price trend line ko todti hai toh isay breakout kehte hain. Breakout ke baad market ka trend change ho sakta hai ya continue kar sakta hai. Breakout trading mein traders breakout points pe trade karte hain kyunki yeh points major price movement ko indicate karte hain. Breakout ke baad agar price new trend follow karti hai toh yeh profitable trades ke liye best opportunities hoti hain. Breakout ko samajhna aur is pe trade karna trading strategy ka important hissa hai.
          8. Trend Line Trading Ka Faida


          Trend line trading se traders ko market ka trend pehchanay mein asaani hoti hai. Isse profitable trades karne ke chances barh jate hain. Trend lines simple aur effective tools hain jo market ke direction ko accurately depict karti hain. Trend line trading se traders ko market ke reversal points ka bhi pata chalta hai jahan se price apna direction change kar sakti hai. Trend line trading ka sabse bara faida yeh hai ke yeh strategy traders ko clear aur objective trading signals deti hai.
          9. Risk Management


          Forex trading mein risk management bohot zaroori hai. Trend line strategy ke saath proper risk management ka hona bhi laazmi hai jese stop-loss aur take-profit orders ka istemaal. Risk management se traders apne losses ko control kar sakte hain aur apne profits ko maximize kar sakte hain. Stop-loss order ek predefined level pe set hota hai jahan trade automatically close ho jati hai agar price us level tak pohanchti hai. Take-profit order bhi ek predefined level pe set hota hai jahan trade automatically close ho jati hai agar price us level tak pohanchti hai. Risk management ke baghair forex trading mein success hasil karna mushkil hota hai.
          10. Entry Points


          Trend line strategy ke mutabiq entry points wo hotay hain jab price trend line ko touch karte hue rebound karti hai. Yeh points profitable trades ke liye ideal hotay hain. Entry points ko identify karna trend line trading ka important hissa hai. Uptrend mein entry point wo hota hai jab price trend line ko touch karke upward move karti hai aur downtrend mein entry point wo hota hai jab price trend line ko touch karke downward move karti hai. Entry points pe trade karne se traders ko minimum risk aur maximum profit ka moka milta hai.
          11. Exit Points


          Exit points wo hotay hain jab price apni target position tak pohanch jati hai ya phir trend line ko todti hai. Yeh points loss se bachne ke liye zaroori hain. Exit points ko accurately identify karna forex trading ka important hissa hai. Uptrend mein exit point wo hota hai jab price apni resistance level tak pohanch jati hai aur downtrend mein exit point wo hota hai jab price apni support level tak pohanch jati hai. Exit points ko accurately identify karne se traders apne profits ko secure kar sakte hain aur losses ko minimize kar sakte hain.
          12. Multiple Time Frames


          Multiple time frames ka istemaal trend line trading mein helpful hota hai. Different time frames pe trend lines draw karke market ke overall trend ko samajhna asaan hota hai. Multiple time frames se traders ko market ke short-term aur long-term trends ka pata chalta hai. Short-term time frames jese 5-minute aur 15-minute charts se short-term trends identify kiye ja sakte hain aur long-term time frames jese daily aur weekly charts se long-term trends identify kiye ja sakte hain. Multiple time frames ka istemaal trend line trading ko aur zyada effective banata hai.
          13. Indicators Ka Role


          Technical indicators jese moving averages aur RSI ko trend lines ke saath mila kar istemaal karna effective hota hai. Yeh indicators additional confirmation dete hain. Moving averages se market ke overall trend ka pata chalta hai aur RSI se market ke overbought aur oversold conditions ka pata chalta hai. Indicators ko trend lines ke saath mila kar istemaal karne se traders ko accurate trading signals milte hain. Indicators ka role trend line trading mein bohot important hai kyunki yeh market ke momentum aur strength ka bhi pata dete hain.
          14. Patience Aur Discipline


          Forex trading mein patience aur discipline bohot zaroori hain. Trend line trading mein bhi yeh dono cheezen madadgar hoti hain, jese sahi entry aur exit points ka intezar. Patience se traders ko impulsive decisions lene se bachne mein madad milti hai aur discipline se trading plan ko follow karne mein madad milti hai. Forex trading mein success hasil karne ke liye patience aur discipline ka hona laazmi hai. Impulsive decisions aur emotions ko control mein rakhna successful trading ke liye zaroori hai.
          15. Practice Aur Experience


          Practice aur experience se trend line trading mein maharat hasil hoti hai. Demo accounts pe practice karke apni skills ko improve kiya ja sakta hai. Demo accounts real market conditions simulate karte hain jahan traders bina kisi risk ke trading kar sakte hain. Practice se traders ko market ka behavior samajhne mein madad milti hai aur experience se trading decisions lene mein confidence milta hai. Practice aur experience trend line trading ko successful banane mein bohot madadgar hote hain.
          16. Common Mistakes


          Common mistakes mein over-trading aur incorrect trend line drawing shamil hain. In mistakes se bachne ke liye proper knowledge aur practice ki zaroorat hai. Over-trading se traders unnecessary risks lete hain aur incorrect trend lines se inaccurate trading signals milte hain. Common mistakes ko avoid karne ke liye trend line trading ke basics ko samajhna aur practice karna bohot zaroori hai. Common mistakes se bachne se traders apne trading performance ko improve kar sakte hain.
          17. Real-Life Examples


          Real-life examples ko dekh kar trend line trading strategy ko samajhna asaan hota hai. Historical charts ko analyze karke trend lines ki effectiveness ko dekha ja sakta hai. Real-life examples se traders ko trend lines ko accurately draw karne aur trading signals ko interpret karne mein madad milti hai. Historical charts se traders ko market ke past behavior ka pata chalta hai jo future trading decisions lene mein helpful hota hai. Real-life examples ko dekh kar traders apne trading skills ko improve kar sakte hain.
          18. Continuous Learning


          Forex market constantly change hoti rehti hai, isliye continuous learning bohot zaroori hai. Nai strategies aur techniques ko seekhna profitable trading ke liye laazmi hai. Continuous learning se traders ko market ke latest trends aur developments ka pata chalta hai. Nai strategies aur techniques ko seekhne se traders apne trading performance ko improve kar sakte hain. Continuous learning forex trading mein success hasil karne ke liye bohot important hai.
          19. Conclusion


          Trend line trading strategy forex trading mein bohot effective hai. Proper knowledge, practice aur risk management se is strategy ko profitable banaya ja sakta hai. Trend line trading se traders ko market ke trend ko pehchanne aur profitable trades karne mein madad milti hai. Forex trading mein success hasil karne ke liye patience, discipline aur continuous learning zaroori hain. Trend line trading strategy ko sahi tarike se istemaal karne se traders apne trading goals ko achieve kar sakte hain aur forex market mein consistent profits kama sakte hain.
          Khatma


          Forex trading mein trend line trading strategy aik behtareen tool hai jo traders ko market ke trend ko pehchanay aur profitable trades karne mein madad karti hai. Is strategy ko sahi tarike se istemaal karne ke liye proper knowledge aur practice ki zaroorat hai. Trend line trading strategy se traders ko market ke key levels aur reversal points ka pata chalta hai jo profitable trading ke liye important hote hain. Forex trading mein success hasil karne ke liye trend line trading strategy ko sahi tarike se istemaal karna bohot zaroori hai.
          • #6 Collapse

            Basuc Trend Line Trading Strategy in Forex

            Forex market mein trading karnay ke liye mukhtalif strategies istemal ki ja sakti hain jo ke traders ko market trends samajhnay aur munafa kamane mein madad deti hain. Ek aham aur mufeed strategy jo beginners aur experienced traders dono ke liye faydemand ho sakti hai wo hai "Basuc Trend Line Trading Strategy". Is article mein hum is strategy ke baray mein mukhtasar taur par baat karenge aur samjhne ki koshish karenge ke ye kis tarah kaam karti hai aur kaise istemal ki ja sakti hai.
            1. Trend Lines Ki Ahmiyat


            Trend lines forex trading mein ek mukhtasar lekin zaroori tool hain jo market trends aur price movements ko samajhne mein madad deti hain. In lines ko draw karte waqt, traders high aur low prices ko connect karte hain, jo ke market ke current trend ko darust tareeqay se represent karte hain. Trend lines ke istemal se traders ko market ka direction aur trend ka pata lagana asan ho jata hai, jo ke trading decisions ko improve karta hai.
            2. Basuc Trend Line Strategy Ki Bunyadi Tashkeel


            Basuc trend line strategy ka asal maqsad market ke trends ko identify karna aur un par trade karna hai. Is strategy mein traders trend lines ko istemal karte hain jo ke market ke important support aur resistance levels ko show karte hain. Jab price trend line ko touch karti hai, ya usay cross karti hai, to isay entry aur exit points ke taur par istemal kiya jata hai.
            3. Trend Lines Ki Drawing Technique


            Sahi trend lines draw karna trading ke liye zaroori hai. Trend lines ko draw karte waqt highs aur lows ko istemal karte hue, traders ko consistent aur reliable trend lines mil sakti hain. Ek popular technique hai ki highs aur lows ko connect kar ke straight line draw karna, jo ke market trend ko represent karta hai. Agar trend lines sahi tareeqay se draw ki gayi hain, to traders ko market trends ko samajhne mein asani hoti hai aur unki trading accuracy improve hoti hai.
            4. Support Aur Resistance Levels Ki Tameer


            Trend lines support aur resistance levels ko bhi indicate karte hain. Support level neeche ki taraf hota hai jab ke resistance level oonchi taraf hota hai. Jab price trend line ko approach karti hai aur usay bounce back ya break karti hai, to ye support aur resistance levels traders ke liye important hotay hain. In levels se traders ko entry aur exit points tay karna asan ho jata hai aur unki trading strategy ka hissa banta hai.
            5. Entry Aur Exit Points Ka Intikhab


            Basuc trend line strategy ke istemal se traders ko entry aur exit points ka tay karna asan ho jata hai. Jab price trend line ko cross karta hai, ya usay bounce back karta hai, to ye traders ko entry aur exit signals provide karte hain. For example, jab price trend line ko break karta hai aur neeche jata hai, to ye sell signal ho sakta hai. Jab price trend line ko bounce back karta hai aur oonchi taraf jaata hai, to ye buy signal ho sakta hai. Is tareeqay se, trend lines traders ko market movement ke hisab se trading decisions lene mein madad deti hain.
            6. Stop Loss Aur Take Profit Levels Ka Tay Karna


            Har trade mein stop loss aur take profit levels ka tay karna zaroori hota hai. Trend lines ki madad se traders in levels ko define kar sakte hain. For example, agar trader long position le raha hai, to wo trend line ke neeche stop loss place kar sakta hai, jo ke price agar reversal karta hai to usay protect karega. Take profit level ko bhi trend line ke oonche side par set kiya ja sakta hai, jahan price ko expectation ke hisab se profit book kiya ja sakta hai. Is tarah, stop loss aur take profit levels ko trend lines ke istemal se define karna traders ke liye risk management ko improve karta hai.
            7. Trend Confirmation Ke Liye Indicators Ki Istemal


            Trend lines ko confirm karne ke liye traders mukhtalif technical indicators ka istemal bhi karte hain jaise RSI (Relative Strength Index), MACD (Moving Average Convergence Divergence), aur moving averages. Ye indicators trend ke strength aur direction ko confirm karte hain aur traders ko trading signals provide karte hain. For example, jab trend line breakout hota hai aur RSI overbought ya oversold zone mein enter karta hai, to ye strong confirmation ho sakta hai ke trend change hone wala hai. Is tarah se, indicators trend lines ke sath mil kar traders ko trading decisions lene mein madad dete hain.
            8. Market Sentiment Aur News Ka Tawazun


            Trend lines ke istemal se trading karte waqt market sentiment aur news ko bhi madaynazar rakha jata hai. Market sentiment aur news events bhi market trends aur price movements ko influence karte hain. For example, agar koi major economic news release hoti hai jo currency pair par impact daalti hai, to trend lines ke sath traders news ka tawazun rakh kar apni trading strategy ko adjust kar sakte hain. Agar market sentiment strong bullish ya bearish hai, to trend lines ki madad se traders usay confirm kar sakte hain aur trading opportunities ko identify kar sakte hain.
            9. Practice Aur Experience Ki Ahmiyat


            Basuc trend line strategy ko samajhne aur usay effectively istemal karne ke liye practice aur experience ki zaroorat hoti hai. New traders ko demo accounts istemal kar ke is strategy ko samajhna chahiye. Demo trading se traders real market conditions ko simulate kar ke trend lines ke istemal ka experience gain kar sakte hain aur apni skills ko improve kar sakte hain. Is tareeqay se, practice aur experience ke zariye traders trend lines ko better understand kar sakte hain aur unka trading performance improve hota hai.
            10. Psychological Factors Ka Impact


            Forex trading mein psychological factors ka bhi bara asar hota hai. Trend lines ki madad se traders apni emotions ko control kar ke trading decisions lenay mein behtar ho sakte hain. For example, agar trader trend line break ke baad emotional ho kar impulsive trading decisions leta hai, to isay apni trading strategy ke against ho sakta hai. Is liye, trend lines ko istemal kar ke traders apni trading approach ko systematic aur disciplined tareeqay se follow kar sakte hain, jo ke psychological factors ko manage karne mein madad deta hai.
            11. Risk Management Ki Ehmiyat


            Har trading strategy mein risk management ka hona zaroori hai. Trend lines traders ko ye facility deti hain ke woh apne risk ko control kar sakte hain aur successful trading kar sakte hain. Risk management ke tareeqay mein stop loss aur take profit levels ko set karna, position size ka tay karna aur market volatility ko consider karna shamil hota hai. Trend lines ki madad se traders apni risk management strategy ko improve kar sakte hain aur trading mein consistent performance achieve kar sakte hain.
            12. Historical Data Aur Backtesting


            Trend lines strategy ko test karne ke liye traders ko historical data aur backtesting ka istemal karna chahiye. Is tareeqay se, traders strategy ko past market conditions par test kar sakte hain aur uski effectiveness ko evaluate kar sakte hain. Backtesting ke zariye traders ko idea milta hai ke trend lines kis tarah work karti hain aur kis tarah different market scenarios mein perform karti hain. Is tareeqay se, historical data aur backtesting traders ke liye valuable tools hote hain jo ke unki trading decisions ko refine karte hain aur future market movements ko predict karne mein madad dete hain.
            13. Trading Plan Ki Tashkeel


            Basuc trend line strategy ko istemal karne ke liye traders ko ek mazboot trading plan banane ki zaroorat hoti hai. Plan mein entry aur exit rules ke sath risk aur money management strategies shamil hoti hain. Trading plan ke zariye traders apni trading approach ko organized tareeqay se follow kar sakte hain aur market ke fluctuations ke against protect bhi reh sakte hain. Ek comprehensive trading plan traders ko consistent trading performance achieve karne mein madad deta hai aur unki trading journey ko smooth banata hai.
            14. Conclusion


            Yeh article dikhata hai ke basuc trend line strategy forex trading mein kis tarah kam karti hai aur isay kaise traders apni trading approach mein shamil kar sakte hain. Is strategy ko samajhna aur istemal karna trading mein consistency aur success ke liye aham hai. Traders ko practice, discipline aur knowledge ke sath isay implement karna chahiye ta ke woh market trends ko samajh sake aur munafa kamane mein kamyabi haasil kar sakein.

            Is article mein humne dekha ke basuc trend line strategy ke istemal se forex trading ko kaise simplify kiya ja sakta hai aur traders ko market ke movements ko samajhne mein madad milti hai. Trend lines forex market mein powerful tools hote hain jo ke traders ko market trends ko samajhne aur un par trading decisions lene mein madad dete hain. Agar traders trend lines ko sahi tareeqay se istemal karte hain aur unko understand karte hain, to ye unki trading strategy ko strengthen karte hain aur unki overall trading performance ko improve karte hain.
            • #7 Collapse

              ### BSUC Trend Line Trading Strategy
              BSUC (Buy-Sell-Up-Change) trend line trading strategy ek popular technique hai jo traders ko market ke trends ko identify karne aur unke mutabiq trading decisions lene mein madad karti hai. Is strategy ka asal maqsad price movements ko analyze karna hai taake entry aur exit points ko behtar banaya ja sake. Is post mein, hum BSUC trend line trading strategy ke key elements aur iske faide samjhenge.

              **1. Trend Lines ka Concept:**
              Trend lines price action ko visualize karne ka ek effective tool hain. Ye lines market ke higher highs ya lower lows ko connect karti hain, jo traders ko trend ki direction aur strength ka andaza lagane mein madad deti hain. Jab price trend line ke paas aati hai, to ye potential reversal ya continuation points ko darshata hai.

              **2. BSUC Strategy ka Framework:**
              BSUC strategy ka basic framework four main steps par mabni hai:

              - **Buy (B):** Jab price bullish trend mein hoti hai aur trend line ke paas aati hai, traders ko buy signal milta hai. Ye moment aapko entry ka mauqa deta hai, jab price trend line ko test karti hai aur upar ki taraf wapas aati hai.

              - **Sell (S):** Jab price bearish trend mein hoti hai aur trend line ko break karne ki koshish karti hai, to ye sell signal hota hai. Is waqt traders ko apni short positions kholne ka sochna chahiye.

              - **Up (U):** Jab price trend line par support ya resistance ko test karte waqt bullish reversal dikhaati hai, to ye bullish market ka darshata hai. Traders ko is waqt apne positions ko hold karna chahiye ya naye buy orders dalne chahiye.

              - **Change (C):** Agar price trend line ko successfully break kar leti hai, to ye trend change ka signal hai. Traders ko is waqt market conditions ko assess karna chahiye aur positions ko adjust karna chahiye.

              **3. Confirmation Signals:**
              BSUC strategy ko confirm karne ke liye technical indicators ka istemal bhi kiya jata hai. Misaal ke tor par, RSI (Relative Strength Index) ya MACD (Moving Average Convergence Divergence) aapko market ke overbought ya oversold conditions dikhate hain. Agar ye indicators aapki trend line analysis ke sath match karte hain, to aapko trading decisions lene mein zyada confidence milega.

              **4. Risk Management:**
              Har trading strategy ki tarah, BSUC strategy mein bhi risk management bohot zaroori hai. Stop-loss orders ko set karna chahiye taake aap apne losses ko limit kar sakein. Aapko stop-loss ko trend line ke thoda neeche ya upar rakhna chahiye, jo market ki volatility ko dhyan mein rakhta hai.

              **5. Practice and Adaptation:**
              Is strategy ko implement karne ke liye practice zaroori hai. Market conditions hamesha change hote hain, isliye traders ko apne analysis ko adapt karna aana chahiye. Backtesting aur demo trading se aap is strategy ko behter samajh sakte hain aur apne trading skills ko improve kar sakte hain.

              **Conclusion:**
              BSUC trend line trading strategy ek powerful tool hai jo traders ko market ke trends ko samajhne aur unke mutabiq trading decisions lene mein madad karti hai. Agar aap is strategy ko sahi tarah se istemal karte hain, to yeh aapki trading performance ko behter bana sakta hai. Isliye, market analysis, risk management, aur continuous learning par focus karein taake aap is strategy se maximum faida utha sakein.
              • #8 Collapse

                BSUC Trend Line Trading Strategy

                1. Taqreer


                BSUC (Bollinger Bands, Stochastic, Ultimate Oscillator, aur CCI) ek maqbool trading strategy hai jo traders ko market ke trend aur price movement ko samajhne mein madad karti hai. Is maqalay mein hum is strategy ki tafseelat, istamal ka tareeqa, aur is se faida hasil karne ke tareeqon par baat karenge.
                2. Trend Line Kya Hai?


                Trend line ek aisi line hai jo market ke price movements ko darust karti hai. Yeh lines bullish aur bearish trends ko samajhne ke liye istemal hoti hain. Bullish trend mein prices upar ki taraf hoti hain jabke bearish trend mein prices neeche ki taraf ja rahi hoti hain.
                3. BSUC Strategy Ka Ibtida


                BSUC strategy ka asal maqsad price movements ka jaiza lena aur unhe analyze karna hai. Is strategy mein mukhtalif technical indicators ka istemal kiya jata hai jo traders ko entry aur exit points ka pata lagane mein madad dete hain.
                4. Bollinger Bands Ka Istemaal


                Bollinger Bands price volatility ko darust karti hain. Yeh do standard deviations par based hoti hain jo ek moving average ke 4 taraf hoti hain. Jab prices upper band ko cross karti hain, toh yeh overbought signal hota hai, jabke lower band ka cross hona oversold signal hota hai.
                5. Stochastic Oscillator


                Stochastic oscillator ek momentum indicator hai jo price ki current level ko recent price range ke saath compare karta hai. Is indicator se traders ko pata chalta hai ke market oversold ya overbought hai. Yeh entry aur exit points tay karne mein kaafi madadgar hota hai.
                6. Ultimate Oscillator


                Ultimate oscillator ek aur momentum indicator hai jo mukhtalif time frames ko combine karta hai. Yeh traders ko ek comprehensive view deta hai ke market kis taraf ja raha hai. Iska istamaal karte hue, agar oscillator 50 se zyada hota hai, toh yeh bullish signal hota hai.
                7. Commodity Channel Index (CCI)


                CCI ek versatile indicator hai jo price levels ko evaluate karta hai. Jab CCI 100 se upar hota hai, toh market overbought hota hai, jabke -100 se neeche hone par oversold hota hai. CCI ka istemal karte hue, traders ko potential reversal points ka pata lagta hai.
                8. Trend Line Drawing Ka Tareeqa


                Trend lines draw karna kaafi aasan hai. Sab se pehle, aapko significant highs aur lows ko identify karna hota hai. Bullish trend ke liye, aapko do ya zyada lows ko connect karna hota hai, jabke bearish trend ke liye aapko do ya zyada highs ko connect karna hota hai.
                9. Entry Points Ka Taqreeqi Jaiza


                BSUC strategy ka ek aham pehlu entry points ki identification hai. Jab price trend line ko touch karti hai aur indicators bullish signals dete hain, toh yeh entry ka mauqa hota hai. Is waqt market mein ghusne ka faisla karna chahiye.
                10. Exit Points Ka Taqreeqi Jaiza


                Exit points ka samajhna bhi utna hi zaroori hai. Jab price upper Bollinger Band ko cross karti hai ya indicators overbought signals dete hain, toh yeh exit ka mauqa hota hai. Is waqt position ko close karna behtar hota hai.
                11. Risk Management


                Koi bhi trading strategy bina risk management ke nahi chal sakti. Traders ko apne capital ka ek hissa risk mein daalna hota hai, lekin yeh zaroori hai ke is ki limit set ki jaye. Stop-loss orders ka istemal karna is ka aik behtareen tareeqa hai.
                12. Backtesting


                Backtesting ek zaroori process hai jisme traders apni strategy ko historical data par test karte hain. Yeh unhe yeh samajhne mein madad karta hai ke unki strategy kitni effective hai aur kis tarah se woh market conditions ke mutabiq kaam karti hai.
                13. Continuous Learning


                Trading ek dynamic field hai. Is liye, traders ko hamesha seekhte rehna chahiye. Market trends, new strategies, aur technical indicators ki updates ko follow karna zaroori hai. Is se unki trading skills mein behtari aati hai.
                14. Nihayat


                BSUC trend line trading strategy ek behtareen tareeqa hai market ke trends ko samajhne ka. Is strategy ke zariye, traders price movements ka jaiza le kar faida hasil kar sakte hain. Lekin, is strategy ko apnate waqt risk management aur continuous learning ko nahi bhoolna chahiye.

                • #9 Collapse

                  Bsuc trend line trading strategy

                  Bollinger Bands, Simple Moving Average (SMA), aur Relative Strength Index (RSI) ki madad se trading ki strategies bana sakte hain, jo traders ko market ki volatility aur price movements ka andaza lagane mein madad deti hain. Ek achi strategy mein trend line ka istemal karke entry aur exit points ko identify kiya ja sakta hai.
                  Trend lines ko draw karna asan hai. Aap price chart par do ya zyada high ya low points ko connect karke ek line bana sakte hain. Jab price is line ke upar move karta hai, toh yeh bullish trend ka signal hota hai, jab ke neeche move karna bearish trend ka indication hota hai. Traders in lines ka istemal karte hain taake price ki direction ka andaza laga sakein aur unke trading decisions ko support kar sakein.

                  Bollinger Bands ko trend ki strength aur volatility ko measure karne ke liye istemal kiya jata hai. Yeh bands price ke 20-period SMA ke aas paas draw hoti hain, aur iske upper aur lower bands price ki volatility ko show karte hain. Jab price upper band ko touch karta hai, toh yeh overbought condition ki taraf ishaara karta hai, jab ke lower band touch karne par oversold condition hoti hai. Yeh signals traders ko potential reversal ya continuation points dikhane mein madad karte hain.

                  SMA ko trend ki overall direction samajhne ke liye istemal kiya jata hai. Jab price SMA ke upar hoti hai, toh yeh bullish signal hota hai, aur agar price neechay hoti hai, toh bearish signal hota hai. Ek 50-period ya 200-period SMA ka istemal karke aap long-term trend ka pata kar sakte hain.

                  RSI ek momentum indicator hai jo 0 se 100 tak range karta hai. Iska istemal overbought ya oversold conditions ko identify karne ke liye hota hai. Agar RSI 70 se upar ho, toh yeh overbought condition ko darshata hai, jab ke 30 se neeche oversold condition ko dikhata hai. Is information ko trend lines ke saath combine karke, traders ko ek zyada reliable trading signal milta hai.

                  In sab indicators ka istemal karte hue, traders ko risk management strategies bhi apnani chahiye, jaise ke stop-loss orders set karna aur position sizing. Yeh strategy aapko market ki fluctuations se protect karne mein madad karegi aur long-term profitability ko ensure karegi. Trading ki duniya mein consistent success hasil karne ke liye patience aur discipline zaroori.
                  • #10 Collapse

                    # BSUC Trend Line Trading Strategy
                    BSUC trend line trading strategy ek effective approach hai jo traders ko market trends ko samajhne aur un par based trading decisions lene mein madad karti hai. Is strategy ka maqsad trend lines ka istemal karke entry aur exit points ko identify karna hai. Is post mein hum BSUC trend line strategy ki tafheem, iske faide, aur istemal ka tareeqa jaanenge.

                    ### 1. **BSUC Trend Line Kya Hai?**
                    BSUC ka matlab hai "Buy Sell Up and Confirm." Yeh strategy trend lines ka istemal karti hai, jo price movements ko darshati hain. Trend lines ko chart par draw karne se traders ko market ke bullish ya bearish trends ka pata chalta hai. Is strategy mein upward trend lines buying opportunities ko aur downward trend lines selling opportunities ko darshati hain.

                    ### 2. **Trend Line Ka Kaam**
                    Trend lines ki kahani yeh hai ke yeh price action ko visualize karne mein madad karte hain. Aam tor par, agar price trend line ko support ya resistance ke taur par touch karta hai, toh yeh signal hota hai ke price us taraf move karne ki sambhavana hai.

                    ### 3. **BSUC Trend Line Strategy Ki Ahmiyat**
                    Is strategy ki ahmiyat kuch khaas wajah se hai:

                    - **Trend Identification:** Trend lines se aapko market ke trends ko identify karne mein madad milti hai. Yeh aapko yeh samajhne mein madad karte hain ke kab market bullish ya bearish hai.
                    - **Entry aur Exit Points:** Trend lines ka istemal karke aap accurate entry aur exit points tay kar sakte hain, jo aapki profitability ko barhata hai.

                    ### 4. **BSUC Trend Line Trading Kaise Kiya Jaye?**

                    #### a. **Trend Lines Ka Drawing:**
                    Sabse pehle, aapko trend lines draw karni hongi. Bullish trend ke liye, low points ko connect karein, aur bearish trend ke liye, high points ko connect karein. Isse aapko clear picture milegi ke market kis direction mein ja raha hai.

                    #### b. **Confirmation Signals:**
                    Trend line ke touch hone par confirmation signals ka intezar karein. Yeh confirmation kisi bhi technical indicator, jaise RSI ya MACD, se mil sakta hai. Agar indicator bhi bullish ya bearish signal de raha hai, toh yeh confirmation hota hai.

                    #### c. **Entry Points:**
                    Jab price trend line ko touch kare aur confirmation mil jaye, toh aap buy ya sell position le sakte hain. Bullish trend ke liye, aap buy position lein, aur bearish trend ke liye sell position.

                    #### d. **Stop-Loss Orders:**
                    Risk management ke liye stop-loss orders zaroori hain. Stop-loss ko trend line ke neeche ya upar set karein, taake agar market aapke against chala jaye, toh aapki losses limit ho jayein.

                    ### 5. **Potential Risks**
                    BSUC trend line strategy ke sath kuch risks bhi hain:

                    - **False Breakouts:** Kabhi-kabhi price trend line ko break kar sakta hai lekin uske baad wapas aata hai. Yeh false breakout aapko loss mein daal sakta hai.
                    - **Market Volatility:** Sudden news ya economic events se market mein volatility aa sakti hai, jo aapke trades par asar dal sakti hai.

                    ### Aakhir Mein:
                    BSUC trend line trading strategy ek effective tool hai jo traders ko market trends ko samajhne aur trading decisions lene mein madad karti hai. Agar aap is strategy ko sahi tarike se samajh kar istemal karte hain, toh aapki trading performance mein behtar asar aa sakta hai. Hamesha yaad rakhein, trading mein research aur risk management bohot zaroori hain, isliye apne decisions ko soch samajh kar lein.
                    • <a href="https://www.instaforex.org/ru/?x=ruforum">InstaForex</a>
                    • #11 Collapse

                      Bsuc Trend Line Trading Strategy

                      Forex trading mein har trader apni strategy develop karta hai jo uski trading style aur market ke samajh ke mutabiq hoti hai. Bsuc Trend Line Trading Strategy ek simple aur asaan tareeqa hai jo beginners aur professional traders dono ke liye kaam kar sakti hai. Is article mein hum Bsuc Trend Line Trading Strategy ko detail mein discuss karenge.
                      1. Bsuc Trend Line Strategy ka Introduction


                      Bsuc Trend Line Trading Strategy ka asal maqsad market ke trend ko identify karna aur us trend ke sath trade karna hai. Trend line woh line hoti hai jo price ke high ya low points ko connect karti hai. Ye strategy simple hoti hai magar bohot effective agar sahi tareeqa se apply ki jaye. Ismein support aur resistance levels ka analysis bhi shamil hota hai jo kisi bhi trade ke liye zaroori hai.
                      2. Trend Lines Draw Karne ka Tareeqa


                      Trend line draw karne ke liye apko candlestick chart ka use karna hota hai. Sab se pehle, apko current trend identify karna hota hai:
                      • Uptrend: Jab price higher highs aur higher lows bana rahi ho.
                      • Downtrend: Jab price lower highs aur lower lows bana rahi ho.

                      Trend line draw karne ke liye, apko do ya zyada significant points ko connect karna hota hai. Uptrend ke liye low points ko connect karein aur downtrend ke liye high points ko connect karein. Is line ka kaam ye hai ke ye apko price ke future direction ka signal de sakti hai.
                      3. Bsuc Strategy ke Core Rules


                      Bsuc Trend Line Strategy mein kuch basic rules follow karna zaroori hai:
                      1. Trend ka Analysis: Pehle identify karein ke market uptrend mein hai ya downtrend mein.
                      2. Trend Line ka Accuracy: Sirf un points ko consider karein jo consistently touch ho rahe ho.
                      3. Breakout ka Wait: Jab price trend line ko todti hai, tabhi trade enter karein.
                      4. Stop Loss aur Take Profit: Risk management ke liye hamesha stop loss aur take profit levels set karein.
                      4. Entry aur Exit Points ka Taayun


                      Bsuc Strategy ka sabse important part entry aur exit points ko theek tareeqa se identify karna hai.
                      • Entry Point: Jab price trend line ko todti hai aur uska confirmation milta hai, tab trade enter karein. Uptrend ke case mein, buy karein aur downtrend ke case mein, sell karein.
                      • Exit Point: Jab price apne set target tak pohanch jaye ya phir price dubara trend line ke against move kare, tab ap trade close kar den.
                      5. Risk Management ka Importance


                      Forex trading mein risk management ek bohot zaroori element hai. Bsuc Trend Line Strategy ke sath agar ap apni risk management ko sahi tarah implement karein, to apke loss hone ke chances kam ho jate hain.
                      • Stop Loss: Trend line ke thoda neeche ya upar stop loss lagayein, taake unexpected moves ke case mein apka zyada nuksan na ho.
                      • Position Sizing: Apne account ka sirf 1-2% risk karein har trade mein.
                      • Emotions ko Control karein: Panic selling ya impulsive buying avoid karein.
                      6. Bsuc Trend Line Strategy ki Practical Example


                      Chaliye ek example lete hain:
                      • Scenario: EUR/USD pair ka chart dekhte hain.
                      • Trend: Uptrend identify hota hai.
                      • Trend Line: Price ke two major low points ko connect karte hain.
                      • Breakout: Price trend line ko todti hai aur upar jati hai. Yahan ap buy entry karte hain.
                      • Stop Loss: Trend line ke neeche lagate hain.
                      • Take Profit: Previous resistance level ke paas set karte hain.

                      Is tareeqa se ap dekhte hain ke Bsuc Trend Line Strategy ek systematic aur calculated approach hai jo trading ko asaan banati hai.
                      Conclusion


                      Bsuc Trend Line Trading Strategy ek effective aur simple trading strategy hai jo market trends ko samajhne aur profitable trades execute karne ke liye madadgar hai. Lekin, trading ke sath hamesha risk hota hai, isliye strategy ke sath risk management ko bhi zaroor implement karein. Sabar aur consistency is strategy ko successful banane mein bohot zaroori hai. Regular practice aur chart analysis ke sath ap is strategy ko aur improve kar sakte hain.

                      اب آن لائن

                      Working...
                      X