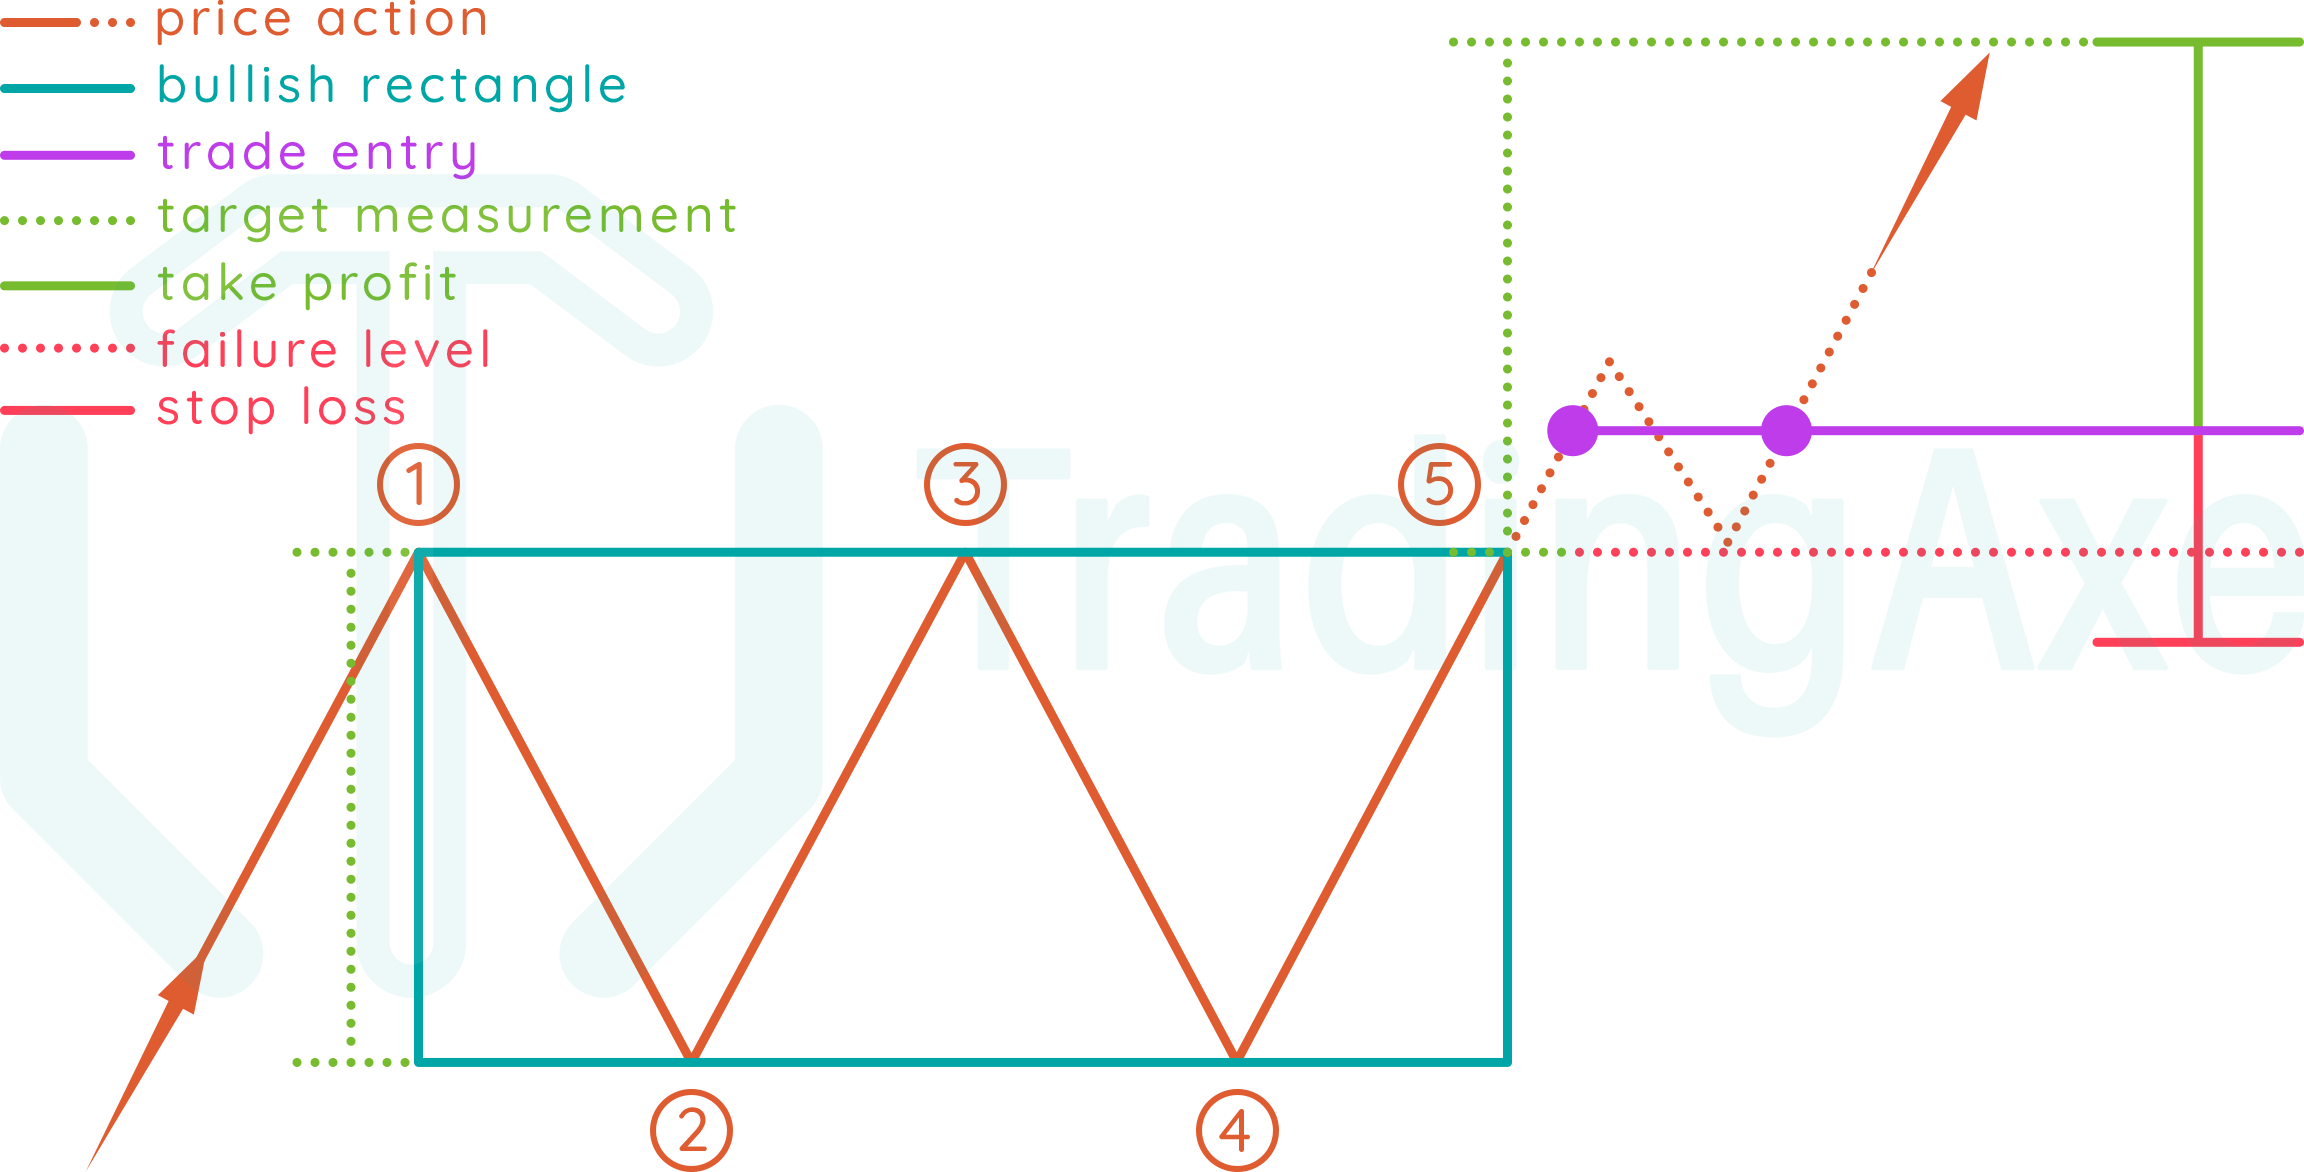
Bullish Rectangle Pattern

No announcement yet.
`
X
  • وقت
  • دکھائیں
Clear All
new posts
  • #1 Collapse

    Bullish Rectangle Pattern
    Asslaam O Alikum.!
    Bullish rectangle candlestick pattern ek important technical analysis tool hai jo traders ko market mein uptrend ke potential opportunities ke baare mein maloomat deta hai. Yeh pattern market mein consolidation ke baad bullish move ko suggest karta hai.
    ​​​​​​

    Bullish Rectangle Pattern Kiya hota hai:
    Dosto Bullish rectangle candlestick pattern ek continuation pattern hai jo uptrend ke dauraan market mein short-term pause ya consolidation ko represent karta hai. Yeh pattern typically rectangle shape mein hota hai, jisme price range defined hoti hai. Rectangle ke upper aur lower boundary ko support aur resistance levels ke roop mein consider kiya jata hai. Pattern ka confirmation tab hota hai jab price rectangle ke upper boundary ko break karta hai aur uptrend continue hota hai.
    Click image for larger version  Name:	image_172715.png Views:	27 Size:	3.4 KB ID:	12997131

    Identification Bullish Rectangle:
    Dosto Bullish rectangle candlestick pattern ko pehchanne ke liye, traders ko kuch important points par dhyan dena chahiye.

    1. Market mein previous uptrend hona chahiye.
    2. Rectangle shape formation ka dhyan dena chahiye jisme price range defined hoti hai.
    3. Candlesticks ki wicks aur bodies ka analysis karna chahiye. Consolidation ke doran wicks choti hoti hai aur bodies small hoti hai.
    4. Pattern ka confirmation upper boundary break ke baad hota hai.


    Trading Strategy:
    Dosto Bullish rectangle candlestick pattern ko trading strategy mein istemal karne ke liye, traders ko kuch steps follow karne chahiye.
    Click image for larger version  Name:	image_172408.png Views:	20 Size:	60.4 KB ID:	12997132
    1. Pattern ki confirmation ke liye upper boundary break ka wait karein.
    2. Entry point ko determine karein upper boundary break ke baad.
    3. Stop loss aur target levels ko set karein. Stop loss usually rectangle ke lower boundary ke neeche aur target rectangle ke height se calculate kiya ja sakta hai.


    Conclusion:
    Dosto Bullish rectangle candlestick pattern ek valuable technical analysis tool hai jo traders ko market mein uptrend ke continuation ke baare mein maloomat deta hai. Traders ko is pattern ko samajhna aur istemal karna chahiye, lekin hamesha risk management ke saath trading karein.

    Note:
    Dosto Yeh tha bullish rectangle candlestick pattern trading ke roman Urdu mein maloomat. Agar aapko aur details chahiye ya koi sawal ho, toh zaroor poochhein.
    Last edited by ; 26-06-2024, 10:20 AM.
  • <a href="https://www.instaforex.org/ru/?x=ruforum">InstaForex</a>
  • #2 Collapse

    Forex Trading Mein Bullish Rectangle Pattern Ka Istemal

    Forex trading mein Bullish Rectangle Pattern ek aham aur mufeed chart pattern hai jo traders ko market mein behtar faisle lene mein madad deta hai. Is pattern ka sahi istemal karke traders market ki trend ko samajh sakte hain aur sahi waqt par trading decisions le sakte hain. Is article mein, hum Bullish Rectangle Pattern ke baray mein mazeed tafseel se baat karenge aur iska istemal karke trading strategies ko samajhenge.

    1. Bullish Rectangle Pattern Kya Hai?

    Bullish Rectangle Pattern ek bullish continuation pattern hai jo uptrend ke doran develop hota hai. Is pattern mein price ek rectangle shape banata hai jismein price horizontal resistance aur support levels ke darmiyan trade karta hai. Jab price rectangle pattern ko breakout karta hai aur upper resistance level ko cross karta hai, toh ye ek bullish signal hai.

    Bullish Rectangle Pattern ka primary feature ye hai ke price ek horizontal range mein trade karta hai aur phir ek bullish breakout ke saath uptrend ko continue karta hai. Is pattern ko pehchane ke liye traders ko chart par rectangle shape dhoondhna hota hai jismein price consolidate ho rahi hoti hai.

    2. Kaise Pehchanein Bullish Rectangle Pattern?

    Bullish Rectangle Pattern ko pehchane ke liye traders ko chart par rectangle shape dhoondhna hota hai jismein price horizontal lines ke darmiyan trade kar rahi hoti hai. Yeh generally ek uptrend ke doran develop hota hai. Rectangle pattern ko pehchane ka aik tareeqa ye bhi hai ke jab price ek range mein trade kar raha ho aur phir ek consistent uptrend mein break kare, toh ye Bullish Rectangle Pattern ka indication hai.

    Is pattern ko pehchanne ke liye, traders ko price ke movements ko closely observe karna hota hai aur rectangle shape ko identify karna hota hai jismein price consolidate ho rahi hai.

    3. Rectangle Pattern Ka Formation

    Bullish Rectangle Pattern ka formation market mein ek consolidation phase ke doran hota hai jab price ek horizontal range mein trade karta hai. Jab market mein buying pressure zyada hoti hai aur price consolidate hone lagta hai, toh rectangle shape ban jata hai.

    Is pattern ka formation thora waqt leta hai aur traders ko patience ke sath price ke movements ko observe karna hota hai. Rectangle pattern ka formation market ki volatility aur trading volume par bhi depend karta hai.

    4. Bullish Rectangle Pattern Ka Matlab

    Bullish Rectangle Pattern ka matlab hota hai ke market mein buying pressure barh rahi hai aur price consolidate ho rahi hai ek rectangle shape mein. Jab price rectangle pattern ko breakout karta hai aur upper resistance level ko cross karta hai, toh ye ek bullish signal hai aur traders ko buying opportunities provide karta hai.

    Is pattern ka matlab hota hai ke market mein bullish momentum hai aur uptrend ko continue hone ki expectations hain. Traders ko is pattern ko samajh kar apne trading strategies ko adjust karna chahiye.

    5. Entry Points Aur Stop Loss

    Bullish Rectangle Pattern mein entry point tab hota hai jab price rectangle pattern ko breakout karta hai aur upper resistance level ko cross karta hai. Traders ko breakout ke saath hi entry lena chahiye taake wo trend ke saath chal sakein.

    Entry point ke sath sath, stop loss bhi important hota hai taake traders apni positions ko protect kar sakein. Stop loss lower support level ke neeche rakha ja sakta hai taake losses ko minimize kiya ja sake.

    6. Target Price

    Target price ko calculate karne ke liye traders rectangle pattern ka height measure karte hain aur phir usi height ko breakout point se upar le jaate hain. Ye target price kaafi accurate hota hai aur traders ko idea deta hai ke price kahan tak ja sakta hai.

    Target price ko calculate karne ke liye, traders ko rectangle pattern ka height measure karna hota hai jo breakout point se upper resistance level tak hota hai. Phir is height ko breakout point se upar le ja kar target price milta hai.

    7. Bullish Rectangle Pattern Ka Istemal

    Bullish Rectangle Pattern ka istemal karke traders uptrend ke doran buying opportunities dhoondhte hain aur market trend ko samajhte hain. Is pattern ka sahi istemal karke traders apni trading ko improve kar sakte hain aur profits ko maximize kar sakte hain.

    Is pattern ko samajhne ke liye traders ko price ke movements ko closely monitor karna hota hai aur rectangle pattern ka formation identify karna hota hai. Phir breakout ke waqt entry lena aur stop loss aur target price set karna hota hai.

    8. Trading Strategies

    Traders Bullish Rectangle Pattern ko istemal karke trading strategies develop kar sakte hain jaise breakout trading ya phir trend following strategies. Breakout ke waqt entry lena aur phir trend ke saath chalne wale trades lena is pattern ke effective strategies hain.

    Traders ko apne trading plan ko is pattern ke mutabiq adjust karna chahiye aur market ki conditions ko samajh kar sahi waqt par trades leni chahiye. Bullish Rectangle Pattern ko istemal karke traders apne trading strategies ko refine kar sakte hain aur consistent profits generate kar sakte hain.

    9. Market Analysis

    Market analysis ke doran Bullish Rectangle Pattern ko dekh kar traders market trend ka andaza lagate hain aur apni trading decisions ko uske mutabiq adjust karte hain. Is pattern ko samajhne ke liye traders ko market ki movements ko closely monitor karna hota hai aur price ke patterns ko analyze karna hota hai.

    Market analysis ke doran traders ko rectangle pattern ke formations par dhyan dena hota hai aur phir breakout ke waqt entry lena hota hai. Bullish Rectangle Pattern ki analysis karne se traders market ki trend ko samajh sakte hain aur sahi waqt par trades lena sikh sakte hain.

    10. Risk Management

    Risk management Bullish Rectangle Pattern ki trading mein bhi ahem hai. Traders ko apne trades ke liye proper stop loss levels aur risk management techniques ka istemal karna chahiye taake wo apne losses ko minimize kar sakein.

    Risk management ke doran traders ko apni positions ko monitor karna hota hai aur sahi waqt par stop loss lagana hota hai. Is pattern ki trading mein risk ko control karna important hai taake traders apne capital ko protect kar sakein.

    11. Psychological Aspect

    Psychological aspect bhi Bullish Rectangle Pattern ki trading mein important hai. Traders ko patience aur discipline maintain karna hota hai jab wo is pattern ka istemal karte hain. Emotions ko control karna aur sahi waqt par entry aur exit lena bhi traders ke liye ahem hai. Is pattern ki trading mein greed aur fear se bachna important hai aur traders ko apne trading plan ko follow karna chahiye.

    Psychological aspect ko samajhne ke liye traders ko apne emotions ko control karna hota hai aur sahi waqt par trading decisions lena hota hai. Discipline aur patience ke sath trading karna Bullish Rectangle Pattern ki trading mein successful hone ka key factor hai.

    12. Real-Life Examples

    Real-life examples ke zariye traders Bullish Rectangle Pattern ko samajh sakte hain aur iska istemal karke apni trading ko improve kar sakte hain. Historical price data ko analyze karke traders ko rectangle pattern ke formations aur uske outcomes ke bare mein pata chalta hai.

    Real-life examples se traders ko idea milta hai ke Bullish Rectangle Pattern kis tarah ka hota hai aur kaise iska istemal karke trading ki ja sakti hai. Isse traders apne knowledge ko enhance karte hain aur apni trading skills ko develop karte hain.

    13. Advantages of Bullish Rectangle Pattern

    Bullish Rectangle Pattern ka istemal karne ke kai faide hain jaise clear entry aur exit points, target price ka easy calculation, aur market trend ka acha andaza. Is pattern ko samajhne ke baad, traders ko market mein behtar faisle lene mein madad milti hai aur wo apni trading ko improve kar sakte hain.

    Advantages of Bullish Rectangle Pattern:
    • Clear entry aur exit points provide karta hai.
    • Target price ka easy calculation hota hai rectangle pattern ki height ke zariye.
    • Market trend ka acha andaza lagane mein madad karta hai.
    • Traders ko buying opportunities provide karta hai uptrend ke doran.

    14. Conclusion

    Toh, Bullish Rectangle Pattern ek powerful trading tool hai jo traders ko market trend ka acha andaza lagane mein madad karta hai aur unhe uptrend ke doran buying opportunities provide karta hai. Lekin, traders ko is pattern ka sahi istemal karne ke liye proper knowledge aur experience hona zaroori hai.

    Is pattern ko samajhne ke liye, traders ko price ke movements ko closely observe karna hota hai aur rectangle pattern ka formation identify karna hota hai. Phir breakout ke waqt entry lena aur stop loss aur target price set karna hota hai.

    Overall, Bullish Rectangle Pattern ka istemal karke traders apni trading ko improve kar sakte hain aur consistent profits generate kar sakte hain. Lekin, is pattern ka istemal karne se pehle traders ko proper research aur analysis karna chahiye aur sahi risk management techniques ka istemal karna chahiye.
    • #3 Collapse

      Bullish Rectangle Pattern
      Bullish rectangle pattern aik technical analysis tool hai jo financial markets mein continuation pattern ke tor par use hota hai. Yeh pattern indicate karta hai ke market current trend ko continue karega. Bullish rectangle pattern khas tor par uptrend ke dauran banta hai aur suggest karta hai ke price break ke baad upward movement continue karegi.

      Pattern Ki Shakal

      Bullish rectangle pattern do parallel horizontal lines se mil kar banta hai jo support aur resistance levels ko define karti hain. Is pattern mein price ek range ke andar trade karti rehti hai, jo do horizontal lines ke darmiyan hoti hai.

      1. Upper Line (Resistance):

      Yeh line high points ko connect karti hai jahan price repeatedly resist karti hai aur niche aati hai.

      2. Lower Line (Support):

      Yeh line low points ko connect karti hai jahan price repeatedly support milta hai aur wapas upar jati hai.

      Pattern Ki Identification

      1. Uptrend:

      Pehle yeh pattern uptrend ke baad banta hai.

      2. Parallel Horizontal Lines:

      Do parallel horizontal lines ko identify karna hota hai jo support aur resistance levels ko define karti hain.

      3. Range-Bound Movement:

      Price in lines ke darmiyan move karti hai, repeatedly support aur resistance levels ko touch karti hai.

      Strategy Ka Tareeqa

      1. Pattern Ki Confirmation:

      Pattern identify aur confirm karna hota hai. Bullish rectangle pattern tab valid hota hai jab price clearly do horizontal lines ke darmiyan trade karti hai.

      2. Entry Point:

      Entry point tab hota hai jab price upper resistance line ko breakout kar jati hai. Yeh indicate karta hai ke market uptrend continue karega.

      3. Stop Loss:

      Risk management ke liye stop loss set karna zaroori hai. Yeh stop loss lower support line ke thoda neeche set kiya jata hai.

      4. Take Profit:

      Profit target set karte waqt previous price movements, Fibonacci extensions, aur moving averages ko dekha jata hai.

      Advantages aur Disadvantages

      Advantages:

      - Clear continuation signal deti hai.
      - Entry aur exit points ko define karna asaan hai.

      Disadvantages:

      - Har pattern successful nahi hota, false breakouts bhi ho sakte hain.
      - Pattern ko identify karna mushkil ho sakta hai, especially in volatile markets.

      Conclusion

      Bullish rectangle pattern aik reliable continuation pattern hai jo traders ko uptrend ke continuation ko predict karne mein madad deta hai. Is pattern ko sahi tarah se identify aur use karne se profitable trades kiya ja sakta hai. Lekin, is pattern ke sath trade karte waqt risk management aur market conditions ko dekhna zaroori hai. Accurate analysis aur disciplined approach se yeh pattern trading mein significant benefits de sakta hai.
      • #4 Collapse

        Title: Forex Trade Mein Bullish Rectangle Pattern Ki Tafseelat

        Heading 1: Forex Trade Mein Bullish Rectangle Pattern Ka Ahmiyat

        Bullish Rectangle pattern forex trading mein ek ahmiyat ka hamil hai, jo traders ko market mein aane wale bullish movement ko samajhne mein madad deta hai. Yeh pattern market analysis mein istemal hota hai takay traders ko potential buying opportunities ka pata chal sake aur unhe profit kamane ka mauka mil sake.

        Heading 2: Bullish Rectangle Pattern Kya Hai?

        Bullish Rectangle pattern ek technical analysis pattern hai jo market mein uptrend ya price consolidation ke doran aksar dekha jata hai. Is pattern mein price ek horizontal support aur resistance level ke darmiyan consolidate hoti hai aur phir ek breakout ke sath upar chali jati hai. Yeh pattern bullish movement ki continuation ko darust karta hai.

        Heading 3: Bullish Rectangle Pattern Ki Pehchan Kaise Ki Jaye?

        Bullish Rectangle pattern ki pehchan karne ke liye traders ko price chart par dhyan dena hota hai. Is pattern mein price ek rectangle ya box ke andar trade karta hai, jismein ek horizontal support aur ek horizontal resistance level hota hai. Price consolidation ke doran volume usually kam hota hai, jo ki ek important indicator hai ki market kis direction mein ja sakta hai.

        Heading 4: Bullish Rectangle Pattern Ki Formation

        Bullish Rectangle pattern ki formation mein do main components hote hain: price consolidation aur breakout. Price consolidation mein price ek horizontal range mein trade karta hai aur phir ek breakout hota hai jab price resistance level ko cross karke upar jaata hai. Is breakout ke baad traders ko bullish movement ka expectation hota hai.

        Heading 5: Bullish Rectangle Pattern Ki Tareef

        Bullish Rectangle pattern ek continuation pattern hai jo bullish trend ke doran market mein dikhai deta hai. Yeh pattern ek bullish bias ko confirm karta hai aur traders ko uptrend ke continuation par trading karne ka indication deta hai.

        Heading 6: Bullish Rectangle Pattern Ka Istemal

        Bullish Rectangle pattern ka istemal karke traders market mein aane wale potential buying opportunities ka pata laga sakte hain. Jab price breakout karta hai aur rectangle ke upper boundary ko cross karta hai, tab traders ko long positions lena ka mauka milta hai.

        Heading 7: Bullish Rectangle Pattern Ki Tafsili Tafseelat

        Bullish Rectangle pattern ki tafsili tafseelat mein traders ko rectangle ke andar price ke behavior par dhyan dena hota hai. Price consolidation ke doran volume ko monitor karna bhi zaroori hai, kyun ke kam volume ek potential breakout ka indication ho sakta hai.

        Heading 8: Bullish Rectangle Pattern Mein Trading Strategy

        Bullish Rectangle pattern mein trading strategy banate waqt traders ko rectangle ke breakout ke baad entry aur exit points ko decide karna hota hai. Entry point usually upper boundary ke breakout ke baad set kiya jata hai, jabki exit point stop loss aur target price ke based hota hai.

        Heading 9: Bullish Rectangle Pattern Ki Strengths

        Bullish Rectangle pattern ki kuch strengths hain jaise ki yeh ek clear bullish bias ko indicate karta hai aur traders ko uptrend ke continuation par trading karne ka indication deta hai. Is pattern ka formation relatively simple hota hai aur iski accuracy bhi achi hoti hai.

        Heading 10: Bullish Rectangle Pattern Ki Weaknesses

        Bullish Rectangle pattern ki weaknesses mein se ek yeh hai ki yeh false breakouts ke shikar ho sakta hai, jismein price breakout to karta hai lekin phir se rectangle ke andar chala jata hai. Iske alawa, yeh pattern sirf bullish trend ke doran hi dikhai deta hai, isliye sideways market conditions mein iska istemal mushkil ho sakta hai.

        Heading 11: Bullish Rectangle Pattern Ka Trading Mein Istemal

        Bullish Rectangle pattern ka trading mein istemal karne ke liye traders ko price chart par rectangle ke formation aur breakout ko dhyan se dekhna hota hai. Agar price breakout ke baad rectangle ke upper boundary ko cross karta hai, to traders ko long positions lena ka mauka milta hai.

        Heading 12: Bullish Rectangle Pattern Ki Exit Strategy

        Bullish Rectangle pattern ki exit strategy mein traders ko apne long positions ko hold karna hota hai jab tak price trend continuation show karta hai. Stop loss aur target price ko set karna bhi zaroori hota hai takey traders apne profits ko secure kar sakein.

        Heading 13: Bullish Rectangle Pattern Ki Risk Management

        Bullish Rectangle pattern ki trading mein risk management bahut zaroori hai. Traders ko apne positions ke liye stop loss order lagana chahiye takey unka loss limit mein rahe aur profits ko maximize kar sakein.

        Heading 14: Bullish Rectangle Pattern Ka Backtesting

        Bullish Rectangle pattern ka backtesting karke traders apni trading strategy ko test kar sakte hain aur pattern ki accuracy ko evaluate kar sakte hain. Backtesting se traders ko pata chalta hai ki kis tarah se yeh pattern unki trading performance ko improve kar sakta hai.

        Heading 15: Bullish Rectangle Pattern Ka Real-Life Example

        Ek real-life example ke roop mein, maan lijiye ki ek trader rectangle pattern ko observe karta hai aur jab price upper boundary ko cross karta hai, to wo long position le leta hai. Phir, jab price trend continuation show karta hai, trader apne position ko hold karta hai aur profits kamata hai.

        In tafseelat ke zariye, Bullish Rectangle pattern ki importance, formation, aur trading strategy ko samajhna asan ho jata hai jo ke forex traders ke liye faydemand ho sakta hai. Is pattern ko samajh kar, traders market mein achi trading opportunities ka fayda utha sakte hain aur apni trading performance ko improve kar sakte hain.
        • #5 Collapse

          Forex Market Mein Bullish Rectangle Pattern=-=-=-=

          Forex market mein bullish rectangle pattern ek chart pattern hota hai jo continuation pattern ke roop mein jaana jata hai. Yeh pattern tab banta hai jab price ek upward trend mein hoti hai aur phir ek horizontal range mein consolidate karti hai, jahan price support aur resistance levels ke beech move karti hai.


          Forex Market Mein Bullish Rectangle Pattern Ke Ehem Nukaat=-=-=-=

          Is pattern ko pehchanne ke liye kuch khas points hain:
          1. Uptrend Pehle Se Maujood Hai: Bullish rectangle pattern tab banta hai jab market already ek uptrend mein hoti hai.
          2. Horizontal Range: Price ek specific range ke beech move karti hai, jahan upper line resistance aur lower line support ko represent karti hai.
          3. Multiple Touches: Resistance aur support lines ko kam se kam do baar touch karna chahiye. Zyada touches pattern ki strength ko badhate hain.
          4. Breakout: Price finally resistance level ko breakout karti hai, jo continuation of uptrend ko signify karta hai.
          Forex Market Mein Bullish Rectangle Pattern Ki Trading Strategy=-=-=-=
          • Entry Point: Jab price resistance level ko breakout karti hai, to waha entry lena chahiye.
          • Stop Loss: Support level ke neeche stop loss set karna chahiye, kyunki agar price waha tak pahunchti hai, to pattern fail ho sakta hai.
          • Target: Target price ka calculation resistance level aur support level ke beech ki height ko resistance level se upar add karke kiya ja sakta hai.
          Is tarah se bullish rectangle pattern ek useful tool hai jo traders ko market trends ko samajhne aur profitable trades karne mein madad karta hai.
          • #6 Collapse

            Bullish Rectangle Pattern in Forex: Emaandari ka Raaz

            Forex market mein traders ki tafteesh har pal naye patterns aur signals ke liye hoti hai. In signals mein se ek important aur common pattern hai "Bullish Rectangle". Is article mein hum is pattern ke hawale se tafseel se guftagu karenge.

            1. Introduction:

            Forex market mein bullish rectangle pattern ek popular aur aham technical analysis tool hai jo traders ko future price movements ka andaza lagane mein madad karta hai. Yeh pattern uptrend ke doran banne wala hota hai aur traders ke liye valuable information provide karta hai.

            Bullish rectangle pattern ko dekh kar traders future price movements ko predict karte hain aur sahi trading decisions lete hain. Is pattern ka sahi samajhna aur istemal karna forex market mein success ke liye zaroori hai.

            2. Bullish Rectangle Pattern Kya Hai?

            Bullish rectangle pattern ek continuation pattern hai jo uptrend ke doran banata hai. Ye ek rectangle shape mein hota hai jismein price range horizontal lines ke darmiyan ghoomti hai. Jab price ek specific range mein horizontally move karta hai, aur support aur resistance levels ke darmiyan rectangle shape ban jata hai, to ye bullish rectangle pattern form hota hai.

            Traders bullish rectangle pattern ko uptrend ke continuation ka signal samajhte hain. Is pattern ke formation ke baad, traders future price movements ko predict karke apni trades ko plan karte hain.

            3. Kaise Banata Hai?

            Is pattern ko dekhne ke liye, traders ko rectangle shape ka structure tay karna hota hai jismein price bars ya candles horizontal lines ke darmiyan ghoom rahe hote hain. Yeh horizontal lines support aur resistance levels ko represent karte hain.

            Traders ko rectangle pattern ko identify karne ke liye price movements ko closely monitor karna hota hai. Jab price ek specific range mein horizontally move karta hai aur support aur resistance levels ke darmiyan ghoomta hai, to bullish rectangle pattern ban jata hai.

            4. Components:

            Rectangle pattern mein do mukhya components hote hain: horizontal resistance line aur horizontal support line. In dono lines ke darmiyan price movement hoti hai. Horizontal resistance line price ke upar ghoomti hai jabki horizontal support line price ke niche ghoomti hai.

            Traders ko in dono lines ko identify karke rectangle pattern ko confirm karna hota hai. In lines ke darmiyan ghoomti price movement bullish trend ko indicate karta hai.

            5. Bullish Rectangle Pattern ki Nishaan Dahi:

            Is pattern ki nishandahi ke liye traders ko price bars ya candles ke darmiyan horizontal lines ka rectangle shape dekhna hota hai. Jab price ek specific range mein horizontally move karta hai aur rectangle shape form hota hai, to ye bullish rectangle pattern ki nishandahi hai.

            Traders ko is pattern ki sahi nishandahi ke liye price movements ko closely observe karna hota hai. Sahi nishandahi ke baad, traders apni trades ko plan karte hain aur sahi entry aur exit points tay karte hain.

            6. Price Targets:

            Bullish rectangle pattern mein price ka target generally rectangle ke height ka size hota hai. Traders is height ko calculate karke future price movements ka andaza lagate hain. Rectangle pattern ke height ko calculate karne ke liye traders horizontal lines ke darmiyan ka distance measure karte hain.

            Is distance ko calculate karke traders price ka target set karte hain. Target set karne ke baad, traders apni trades ko execute karte hain aur profit earn karte hain.

            7. Volume Analysis:

            Is pattern ki confirmation ke liye traders ko volume analysis bhi karna hota hai. Agar volume rectangle ke andar badhta hai, to ye bullish rectangle pattern ki validity ko confirm karta hai. Volume rectangle pattern ke formation ke doran increase hona chahiye, jo pattern ki authenticity ko verify karta hai.

            Traders ko volume analysis ke doran rectangle pattern ke formation ke sath sath volume ke changes ko observe karna hota hai. Sahi volume analysis ke baad, traders apni trades ko execute karte hain aur profit earn karte hain.

            8. Trading Strategies:

            Bullish rectangle pattern ko trade karne ke liye traders price breakout ke baad entry karte hain. Jab price rectangle pattern ke upper resistance level ko break karta hai, to ye breakout signal provide karta hai.

            Traders is breakout ke baad entry karte hain aur stop loss aur target levels ko set karte hain. Stop loss ko set karne ke baad, traders apni trades ko execute karte hain aur profit earn karte hain.

            9. Example:

            Maan lijiye, EUR/USD currency pair mein bullish rectangle pattern dekha gaya hai, jismein price horizontal lines ke darmiyan ghoom rahi hai. Traders is pattern ki madad se future price movements ka andaza lagate hain.

            Jab price rectangle pattern ke upper resistance level ko break karta hai, to ye bullish breakout signal provide karta hai. Traders is breakout ke baad entry karte hain aur stop loss aur target levels ko set karte hain.

            10. Importance in Forex Trading:

            Bullish rectangle pattern forex trading mein ahem role ada karta hai kyun ke ye uptrend ke continuation ko darust karta hai aur traders ko sahi entry aur exit points provide karta hai. Is pattern ko samajhne aur istemal karne se traders apni trading performance ko improve kar sakte hain.

            Bullish rectangle pattern ke formation ke baad, traders future price movements ko predict karte hain aur sahi trading decisions lete hain. Is pattern ka sahi samajhna aur istemal karna forex market mein success ke liye zaroori hai.

            11. Benefits:

            Is pattern ka istemal karne se traders ko price movements ko samajhne mein asani hoti hai aur unko sahi trading opportunities milte hain. Bullish rectangle pattern ke formation ke baad, traders sahi entry aur exit points tay karke profit earn kar sakte hain.

            Traders ko is pattern ka sahi istemal karke uptrend ke doran sahi trading decisions lena chahiye. Isse unki trading performance improve hoti hai aur wo ache returns generate kar sakte hain.

            12. Risks:

            Lekin, har pattern ki tarah, bullish rectangle pattern bhi 100% effective nahi hota. Kabhi kabhi false breakouts aur fake signals bhi aate hain jo traders ko nuqsan mein daal sakte hain. Is liye, traders ko thorough analysis aur risk management ke sath trading decisions lena chahiye.

            Traders ko rectangle pattern ki formation ke baad price movements ko closely monitor karna chahiye. False breakouts ko identify karne ke liye traders ko price ke breakout ke confirmation ka wait karna chahiye. Agar breakout ke baad price phir se rectangle ke andar chala jata hai, to ye false breakout ho sakta hai.

            Traders ko sahi risk management ke sath apni trades ko execute karna chahiye. Stop loss aur target levels ko sahi tareeke se set karna zaroori hai taake nuqsanat se bacha ja sake.

            13. Conclusion:

            Bullish rectangle pattern forex trading mein ek mufeed tool hai jo traders ko sahi direction mein guide karta hai. Is pattern ka sahi samajhna aur istemal karna traders ke liye ahem hai taake wo market mein successful ho sakein aur ache returns generate kar sakein.

            Is pattern ke istemal se traders ko uptrend ke continuation ka pata lagta hai aur wo sahi entry aur exit points tay karke profit earn kar sakte hain. Lekin, sahi analysis aur risk management ke bina, is pattern ka istemal karna mushkil ho sakta hai.

            14. Final Thoughts:

            Bullish rectangle pattern ke samajhna aur istemal karna forex traders ke liye zaroori hai taake wo market mein successful ho sakein. Is pattern ko samajhne ke liye traders ko price movements ko closely observe karna chahiye aur sahi trading decisions lena chahiye.

            Is pattern ka sahi istemal karke traders apni trading performance ko improve kar sakte hain aur ache returns generate kar sakte hain. Lekin, har pattern ki tarah, bullish rectangle pattern ka bhi sahi tareeke se istemal karne ke liye thorough analysis aur risk management ki zaroorat hai.

            • #7 Collapse

              1. Bullish Rectangle Pattern: Aham Pehchan

              Bullish Rectangle pattern forex trading mein aik continuation pattern hai jo uptrend ke dauran ban sakta hai. Is pattern ko typically rectangle ya box-like shape mein dekha jata hai jahan price action consolidation phase mein rehti hai. Yeh pattern is liye ahem hai kyun ke iska matlab hota hai ke market temporary rukawat mein hai aur phir se uptrend ka aaghaz hone ki sambhavna hai.

              Technical terms mein, Bullish Rectangle pattern ko support aur resistance ki parallel lines se define kiya jata hai jo horizontal trading range banate hain. Is range-bound behavior ke dauran volume amuman kam ho jata hai, jo market participants ke indecision ko darshata hai jab tak ke clear breakout signal na ho.

              2. Pattern Ki Tashkeel aur Mukhtalif Mamool

              Rectangle pattern ki tashkeel jab hoti hai to market consolidation phase mein daakhil hota hai, jahan price action horizontal movements ke andar trade hoti hai. Is phase mein buyers aur sellers ke darmiyan ek temporary balance hota hai jahan price ek defined range ke andar rehti hai.

              Rectangle pattern ke khasoosiyat yeh hain ke isme price range-bound rehti hai aur support aur resistance levels clear hote hain. Yeh horizontal trading range market ke stability aur temporary indecision ko reflect karta hai jab tak ke breakout ya continuation signal na mil jaye.

              3. Bullish Rectangle Ki Pehchan Ke Liye Zaruri Shara'it

              Bullish Rectangle pattern ko pehchanne ke liye traders ko kuch zaruri shara'it samajhna zaroori hai:
              • Price uptrend mein honi chahiye jab pattern form hota hai.
              • Rectangle mein clearly defined support aur resistance levels hone chahiye.
              • Volume usually decrease karta hai rectangle banne ke dauran, jo consolidation ki nishani hai.

              Yeh shara'it ek saath aaye to yeh confirm karte hain ke Bullish Rectangle pattern mojood hai aur potential bullish continuation ki possibility hai.

              4. Bullish Rectangle Pattern Ke Maujoodgi Mein Market Psychology

              Bullish Rectangle pattern ke maujoodgi mein market psychology ek consolidation aur indecision phase ko indicate karta hai. Traders price range-bound behavior ko dekhte hain aur samajhte hain ke market temporary stability mein hai jab tak ke clear breakout signal na ho.

              Is phase mein buyers aur sellers apne positions ko adjust karte hain aur price ka next directional move ka wait karte hain. Yeh phase market participants ke liye ek opportunity ho sakti hai apne positions ko optimize karne aur next trend ke liye tayyar hone ka.

              5. Bullish Rectangle Pattern Ka Breakout

              Bullish Rectangle pattern ka breakout tab hota hai jab price rectangle ke upper resistance level ko convincingly break karta hai. Yeh breakout traders ke liye ek bullish signal hota hai aur iska matlab hota hai ke uptrend ki continuation ki possibility zyada hai.

              Breakout ke waqt traders usually ek confirmatory candle close ka wait karte hain upper resistance level ke upar entry ke liye. Breakout ke baad traders apne target aur stop-loss levels set karte hain jo pattern ke measurements aur market conditions ke mutabiq hote hain.

              6. Entry Point aur Stop-loss Ke Liye Strategy

              Bullish Rectangle pattern strategy istemal karne wale traders ke liye entry point breakout ke upper resistance level ke upar confirmatory candle close hone par hota hai. Iske baad traders apne stop-loss levels set karte hain jo typically rectangle ke lower support level ke thode neeche rakhe jate hain.

              Stop-loss levels ka istemal tab hota hai jab trade reverse hota hai aur losses ko minimize karne ke liye. Entry aur stop-loss levels set karne ke baad traders apne target levels bhi set karte hain jo pattern ke measurements aur breakout ke baad ki expected move ke mutabiq hote hain.

              7. Price Target Ki Tadad Kaise Ki Jaati Hai

              Price target ko calculate karne ke liye traders rectangle pattern ke height ko measure karte hain jo support aur resistance levels ke darmiyan distance hota hai. Yeh distance breakout level ke upar add kar ke estimate kiya jata hai ke price uptrend mein kitni had tak move kar sakta hai.

              Is calculation se traders ko ek rough idea mil jati hai ke breakout ke baad price ka expected move aur potential profit kya ho sakta hai. Price target set karte waqt traders market volatility aur overall trend ke bhi impact ko consider karte hain.

              8. Real-life Example aur Practical Application

              Haqeeqi zindagi mein, agar ek trader Bullish Rectangle pattern ko identify karta hai aur breakout ka wait karta hai, to jab breakout hota hai woh entry karne ka faisla kar sakta hai. Iske baad woh apne target aur stop-loss levels set kar ke trade ko manage karta hai.

              Real-life examples se traders ko practical insights milti hain ke pattern ko kaise effectively istemal kiya ja sakta hai. Har trade ke liye apne risk tolerance ke mutabiq entry aur exit points set karna bhi important hota hai jisse losses ko control kiya ja sake aur profits maximize kiya ja sake.

              9. Technical Indicators Ki Istemal

              Bullish Rectangle pattern ke sath traders technical indicators jaise ke Relative Strength Index (RSI) aur Moving Average Convergence Divergence (MACD) ka istemal karte hain. Yeh indicators unko confirm karne mein madad karte hain ke breakout genuine hai aur uptrend ki continuation ki possibility zyada hai.

              RSI jaise momentum indicators aur MACD jaise trend-following indicators traders ko price movement aur market sentiment ke baray mein detailed information dete hain. In indicators ki madad se traders apne trading decisions ko validate karte hain aur breakout ke confirm hone ke baad apne positions ko adjust karte hain.

              10. Risk Management aur Position Sizing

              Har trading strategy mein risk management aur position sizing ka ahem hissa hota hai. Bullish Rectangle pattern ke trade mein bhi traders ko apne risk ko manage karna aur apni position ko control karna zaroori hai.

              Risk management ke liye traders apne stop-loss levels aur position sizes ko set karte hain jo unki risk tolerance aur trading plan ke mutabiq hoti hain. Position sizing ka istemal tab hota hai jab traders apne capital ko effectively allocate karte hain aur har trade mein apne risk ko limit karte hain.

              11. Trading Plan Banane Ka Ahmiyat

              Bullish Rectangle pattern ko trade karne se pehle traders ko ek comprehensive trading plan banana zaroori hai. Is plan mein entry points, stop-loss levels, price targets aur overall market conditions ko evaluate kiya jata hai.

              Ek well-defined trading plan traders ko disciplined aur organized trading approach provide karta hai. Iske zariye traders apne emotions ko control karte hain aur logical decisions lete hain jo unke trading success ke liye ahem hoti hain.

              12. Psychological Aspect aur Emotions Ka Control

              Trading mein psychological aspect aur apne emotions ka control rakhna bhi zaroori hai. Bullish Rectangle pattern ke trade karte waqt traders ko patience maintain karna aur apne trading plan ke mutabiq action lena chahiye.

              Emotional control ke liye traders ko apne trading rules ko follow karna chahiye aur apne decisions ko logic aur analysis par base karna chahiye. Is tarah se traders apne trading journey mein consistent aur profitable reh sakte hain.

              13. Conclusion: Bullish Rectangle Pattern Ke Fawaid

              Bullish Rectangle pattern ek powerful tool hai jo traders ko market ke uptrend ko identify karne mein madad deta hai. Is pattern ko samajhna aur effectively istemal karna traders ke liye ek valuable skill hai jo unhe consistent profits aur trading success mein madad deta hai.

              Is pattern ke mukammal understanding aur uske sahi istemal se pehle traders ko pattern ki sahi pehchan aur confirm breakout ka wait karna chahiye. Breakout ke baad traders apne trading plan ke mutabiq positions lenge aur apne risk ko effectively manage karke apne trading goals ko achieve karenge.

              Is article se ummeed hai ke Bullish Rectangle pattern ke bare mein aapko mazeed samajh aur maloomat mili hogi jo ke aapke forex trading career mein madadgar sabit hogi. Trading mein success ke liye knowledge, practice aur discipline ka hona zaroori hai jo traders ko long-term success tak pohancha sakta hai.
              • #8 Collapse

                Bullish Rectangle Pattern
                Click image for larger version

Name:	download (7).jfif
Views:	36
Size:	12.0 کلوبائٹ
ID:	13003174
                Bullish Rectangle pattern aik technical analysis ka tool hai jo traders aur investors ko market trends ko samajhne mein madad karta hai. Yeh pattern ek continuation pattern ke taur par pehchana jata hai, jo market ki bullish momentum ko sustain karne ki nishani hoti hai. Ismein do parallel horizontal lines hoti hain jo ek rectangle ya chaukandey shape banati hain.

                Yeh pattern usually us waqt banta hai jab ek stock ya asset ki price ek uptrend mein hoti hai, aur phir temporarily consolidation phase mein enter hoti hai. Is phase ke dauran, price ek defined range mein trade karti hai, jo upper resistance line aur lower support line ke beech hoti hai. Yeh lines parallel hoti hain aur ek range ya rectangle banati hain.
                Structure Aur Pehchan


                Bullish Rectangle pattern ko pehchannay ke liye kuch specific characteristics hoti hain:
                1. Uptrend: Yeh pattern ek strong uptrend ke baad form hota hai. Pehle se chalti hui bullish momentum zaroori hoti hai taake is pattern ko ek continuation pattern ke taur par dekha ja sake.
                2. Consolidation Phase: Uptrend ke baad price ek defined range mein trade karti hai. Yeh range ek horizontal channel ya rectangle ke shape mein hoti hai jismein price baar baar resistance aur support levels ko test karti hai.
                3. Parallel Lines: Is range mein upper resistance aur lower support levels parallel hoti hain, jo ek rectangular shape create karti hain.
                4. Volume: Is pattern ke formation ke dauran volume ka kam ya zyada hona bhi ek indication hota hai. Usually, consolidation phase mein volume kam hota hai aur breakout ke waqt volume mein significant increase dekha jata hai.
                Interpretation Aur Trading Strategy


                Bullish Rectangle pattern ka formation market participants ko ek significant information provide karta hai. Is pattern ko samajhne ke liye kuch important points hain:
                1. Entry Point: Jab price upper resistance line ko breakout karti hai, yeh ek buy signal hota hai. Is waqt pe, traders position lete hain aur price ke aage badhne ki umeed hoti hai.
                2. Stop Loss: Stop loss ko lower support line ke thoda neeche place kiya jata hai. Yeh isliye taake agar market unexpected direction mein move kare, to losses ko minimize kiya ja sake.
                3. Target Price: Target price usually pattern ke height ke barabar hota hai. Yeh height lower support line se upper resistance line ke distance ke equal hoti hai.
                Example


                Agar ek stock ki price 100 se 150 ke range mein consolidate ho rahi hai, aur pehle se strong uptrend mein thi, to yeh bullish rectangle pattern kehla sakta hai. Jab yeh stock 150 ke resistance level ko breakout karega, to next target price 150 + (150-100) = 200 ho sakta hai.
                Advantages aur Limitations


                Advantages:
                1. Clear Signal: Is pattern ke breakout se clear buy signal milta hai jo trading decisions ko simplify karta hai.
                2. Risk Management: Stop loss ko easily identify kiya ja sakta hai jo risk management ko behter banata hai.
                3. Predictive Power: Yeh pattern trend continuation ka strong indication deta hai jo future price movements ko predict karne mein madadgar hota hai.

                Limitations:
                1. False Breakouts: Kabhi kabhi market mein false breakouts hote hain jo misleading signals de sakte hain.
                2. Time Consuming: Yeh pattern form hone mein waqt lag sakta hai jo patience demand karta hai.
                3. Volume Confirmation: Breakout ke waqt volume confirmation zaroori hota hai jo har waqt available nahi hota.
                Conclusion


                Bullish Rectangle pattern technical analysis ka aik valuable tool hai jo market ki bullish momentum ko sustain karne ka signal deta hai. Yeh pattern trading strategies ko refine karne aur informed decisions lene mein madadgar hota hai. Halankeh ismein kuch limitations bhi hain, lekin proper analysis aur risk management ke sath yeh pattern successful trading ka zariya ban sakta hai. Is pattern ko effectively use karne ke liye traders ko iske structure, interpretation aur trading strategies ko acche se samajhna chahiye.
                • #9 Collapse

                  **Bullish Rectangle Pattern: Forex Trading Mein Iska Role**
                  Forex trading mein technical analysis ek essential tool hai jo market trends aur price movements ko samajhne mein madad karta hai. Bullish Rectangle Pattern ek aisa pattern hai jo trend continuation aur price consolidation ko signal karta hai. Aaj hum bullish rectangle pattern ko detail mein samjhenge aur dekhenge ke forex trading mein isse kaise use kiya ja sakta hai.

                  **Bullish Rectangle Pattern Kya Hai?**

                  Bullish Rectangle Pattern ek continuation pattern hai jo ek established uptrend ke baad banta hai. Yeh pattern market ke consolidation phase ko show karta hai jahan price ek defined range ke andar move karti hai. Is pattern ko identify karne ke liye, price chart par do parallel horizontal lines draw ki jati hain jo support aur resistance levels ko define karti hain.

                  **Pattern Ki Characteristics**

                  1. **Uptrend:** Bullish Rectangle Pattern tab banta hai jab market pehle ek strong uptrend me hoti hai. Pattern ke formation ke dauran, price ek narrow range ke andar move karti hai, jo market ki consolidation aur indecision ko reflect karta hai.

                  2. **Support aur Resistance Levels:** Is pattern ke dauran, price ek defined support aur resistance levels ke beech move karti hai. Support level pattern ke neeche hota hai aur resistance level pattern ke upar hota hai.

                  3. **Pattern Completion:** Bullish Rectangle Pattern complete hota hai jab price resistance level ko break kar deti hai aur uptrend ko resume karti hai. Pattern ke complete hone ke baad, market bullish momentum ko continue karti hai.

                  **Bullish Rectangle Pattern Ki Trading Strategies**

                  1. **Pattern Identification:** Pehle, chart par bullish rectangle pattern ko accurately identify karna zaroori hai. Pattern ke dauran, ensure karein ke price support aur resistance levels ke beech move kar rahi hai aur ek defined rectangular shape form kar rahi hai.

                  2. **Entry Point:** Entry point generally pattern ke resistance level ke break hone ke baad consider kiya jata hai. Jab price resistance level ko break karti hai, to bullish momentum ka signal milta hai aur trade entry ke liye suitable hota hai.

                  3. **Stop-Loss Orders:** Effective risk management ke liye stop-loss orders ko set karein. Stop-loss ko pattern ke support level ke neeche set karein taake potential losses ko minimize kiya ja sake agar market aapke expected direction ke against move kare.

                  4. **Take-Profit Targets:** Profit taking ke liye clear targets set karein. Bullish Rectangle Pattern ke zariye identify kiye gaye bullish trend ke according, short-term aur long-term targets define karein.

                  5. **Confirmation Indicators:** Additional technical indicators jaise RSI (Relative Strength Index), MACD (Moving Average Convergence Divergence), aur moving averages ka use karke pattern ki reliability ko confirm karein. Indicators aapko market ke momentum aur trend direction ko validate karne mein madad karte hain.

                  **Conclusion**

                  Bullish Rectangle Pattern forex trading mein ek useful continuation pattern hai jo market consolidation aur uptrend continuation ko signal karta hai. Accurate pattern identification, entry points, stop-loss orders, aur additional confirmation indicators ka use karke, aap is pattern ko trading strategies mein effectively incorporate kar sakte hain. Is pattern ke zariye, aap market ke bullish momentum ko capture kar sakte hain aur apne trading decisions ko better inform kar sakte hain.
                  • #10 Collapse

                    ## Bullish Rectangle Pattern Kya Hai?
                    Bullish rectangle pattern ek technical analysis pattern hai jo traders ko market ke bullish reversal ya continuation ka signal deta hai. Yeh pattern aksar consolidation ke doran banta hai, jahan prices ek specific range mein move karte hain. Is post mein, hum bullish rectangle pattern ki pehchan, formation, aur trading strategies par baat karenge.

                    ### 1. **Pattern Ki Pehchan**

                    Bullish rectangle pattern do parallel horizontal lines ke beech banta hai. Is pattern mein price ek upper resistance level aur lower support level ke beech fluctuate karta hai. Jab prices is range mein consolidate hoti hain, to yeh traders ko signal deti hai ke market kis direction mein move karne wala hai. Is pattern ki pehchan karne ke liye, aapko yeh dekhna hoga:

                    - Do ya zyada touch points resistance level par
                    - Do ya zyada touch points support level par
                    - Consolidation ka doran, price ki stability

                    ### 2. **Formation**

                    Bullish rectangle pattern tab form hota hai jab price kisi bullish trend ke baad consolidate hoti hai. Yeh pattern aksar market ke overbought conditions ko indicate karta hai, jahan traders profits book karte hain. Is dauran, buyers aur sellers ke darmiyan equilibrium banta hai.

                    Jab price support level tak girti hai, to buyers entry karte hain, aur jab resistance level tak badhti hai, to sellers profit lene lagte hain. Is tarah, ek rectangle shape form hota hai. Yeh pattern tab bullish mana jata hai jab price resistance level ko break kar leti hai.

                    ### 3. **Trading Strategies**

                    Bullish rectangle pattern se fayda uthane ke liye kuch effective trading strategies hain:

                    - **Breakout Entry**: Jab price upper resistance level ko break kare, to yeh bullish signal hota hai. Is waqt, traders entry le sakte hain aur stop-loss lower support level ke thoda neeche rakh sakte hain.

                    - **Target Setting**: Target ko set karne ke liye, aap pattern ki height ka istemal kar sakte hain. Agar aapko rectangle ki height pata hai, to aap isay breakout point se jod kar target price tay kar sakte hain.

                    - **Volume Confirmation**: Breakout ke waqt trading volume ka bhi khayal rakhein. Agar volume breakout ke sath barhta hai, to yeh signal strong hai. Lekin agar volume low hai, to cautious rahna behtar hai.

                    ### 4. **Risk Management**

                    Har trading strategy ki tarah, bullish rectangle pattern ka istemal karte waqt risk management bhi bohot zaroori hai. Traders ko chahiye ke wo apne risk tolerance ke mutabiq position size tay karein aur stop-loss orders set karein taake unexpected market movements se bacha ja sake.

                    ### 5. **Conclusion**

                    Bullish rectangle pattern forex aur stock trading mein ek useful tool hai jo price action aur market behavior ko samajhne mein madad karta hai. Is pattern ko sahi tarike se pehchankar aur trading strategies ko apply karke, aap profitable trades kar sakte hain. Hamesha yaad rakhein ke market ki volatility aur risk management ka khayal rakhna bohot zaroori hai, taake aap trading mein success hasil kar saken.
                    • <a href="https://www.instaforex.org/ru/?x=ruforum">InstaForex</a>
                    • #11 Collapse

                      **Bullish Rectangle Pattern**
                      Bullish Rectangle pattern aik technical analysis pattern hai jo price consolidation aur potential bullish breakout ko indicate karta hai. Yeh pattern zyada tar stocks aur forex markets mein dekha jata hai aur traders ke liye entry aur exit points tay karne mein madadgar hota hai. Is pattern ko sahi tareeqe se pehchan kar traders market ke upward movements ka faida utha sakte hain.

                      1. **Definition**
                      Bullish Rectangle pattern aik continuation pattern hai jo bullish trend ke dauran banta hai. Yeh pattern price ko consolidate karne ka signal deta hai, jahan price ek specific range mein move karti hai. Iska formation zyada tar price ke upward movement ke baad hota hai.

                      2. **Formation**
                      - Is pattern ki formation do parallel horizontal lines se hoti hai: ek upper resistance line aur doosri lower support line.
                      - Price pehle upar jaati hai, phir consolidate karne ke liye ek range mein move karti hai, jis se rectangle shape banta hai.
                      - Is pattern ka duration kuch din se lekar kuch weeks tak ho sakta hai.

                      3. **Identification**
                      Bullish Rectangle ko identify karne ke liye, traders ko price chart par horizontal support aur resistance levels dhoondne chahiye. Agar price do ya zyada baar upper resistance aur lower support ko test karti hai, to yeh bullish rectangle ka signal hota hai.

                      4. **Breakout**
                      - Bullish Rectangle pattern ka breakout tab hota hai jab price upper resistance level ko successfully cross karti hai.
                      - Breakout ke waqt trading volume ka analysis bhi zaroori hai. High volume breakout ko confirm karta hai aur bullish trend ki strength ko dikhata hai.

                      5. **Entry Point**
                      Entry point ko breakout ke waqt consider karna chahiye. Jab price resistance level ke upar close hoti hai, to traders market mein buy kar sakte hain.

                      6. **Stop Loss**
                      Stop loss ko lower support level ke neeche set karna chahiye. Yeh risk management ke liye zaroori hai taake agar price unexpected direction mein move kare to losses minimize kiye ja sakein.

                      7. **Profit Target**
                      Profit target ko rectangle ki height ko measure kar ke breakout point se project karke tay kiya ja sakta hai. Is tareeqe se traders ko expected profit zone ka andaza ho jata hai.

                      8. **Volume Confirmation**
                      Bullish Rectangle pattern ke waqt trading volume ka dekhna zaroori hai. Agar breakout ke waqt volume high hai, to yeh bullish trend ko confirm karta hai. Low volume ke sath breakout weak signal de sakta hai.

                      9. **Limitations**
                      - Yeh pattern false breakouts bhi de sakta hai, is liye confirmation signals ka intezar karna zaroori hota hai.
                      - Market conditions bhi pattern ki reliability ko affect kar sakti hain, is liye traders ko overall market sentiment ko samajhna hoga.

                      10. **Conclusion**
                      Bullish Rectangle pattern trading ka aik effective tool hai jo price consolidation aur bullish breakout ko identify karne mein madad karta hai. Is pattern ki pehchan aur sahi trading strategy se traders market ke upward trends ka faida utha sakte hain. Isko technical analysis ke sath combine karke trading performance ko enhance kiya ja sakta hai.

                      اب آن لائن

                      Working...
                      X