Ichimoku Kinko Hyo indicator in forex trading....
X
  • وقت
  • دکھائیں
Clear All
new posts
  • #1 Collapse

    Ichimoku Kinko Hyo indicator in forex trading....
    Ichimoku Kinko Hyo indicator kya hai?

    Ichimoku Kinko Hyo (IKH), jise "a glance at a chart in equilibrium" ke roop mein bhi jana jata hai, ek technical analysis indicator hai jo trend, momentum aur support/resistance levels ko samajhne mein traders ki madad karta hai. yah kai alag-alag indicators ko ek chart mein jodkar kam karta hai aur traders ko ek nazar mein bazaar ki sthiti ka jaayza lene mein madad karta hai.
    Click image for larger version

Name:	Trading-Using-Ichimoku-Kinko-Hyo.png
Views:	21
Size:	325.7 کلوبائٹ
ID:	12996571


    IKH ke 5 pramukh hisse hain:
    1. Tenkan-sen (TK): yah ek moving average hai jo 9 aur 26 samay avadhiyon ke beech ki kimat ka ausat hai.
    2. Kijun-sen (KJ): yah ek moving average hai jo 26 aur 52 samay avadhiyon ke beech ki kimat ka ausat hai.
    3. Senkou Span A (SA): yah TK aur KJ ke bich ke madhya bindu se 26 samay avadhiyon aage badhta hai.
    4. Senkou Span B (SB): yah TK aur KJ ke bich ke madhya bindu se 52 samay avadhiyon aage badhta hai.
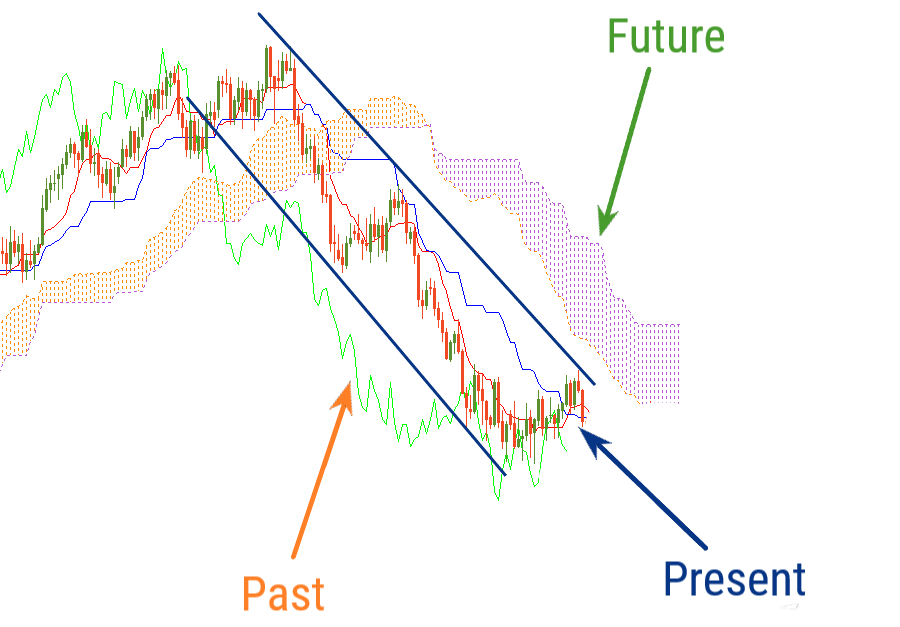
    5. Chikou Span (CS): yah vartman kimat ko 26 samay avadhiyon piche badhata hai.


    IKH ka use kaise karen:
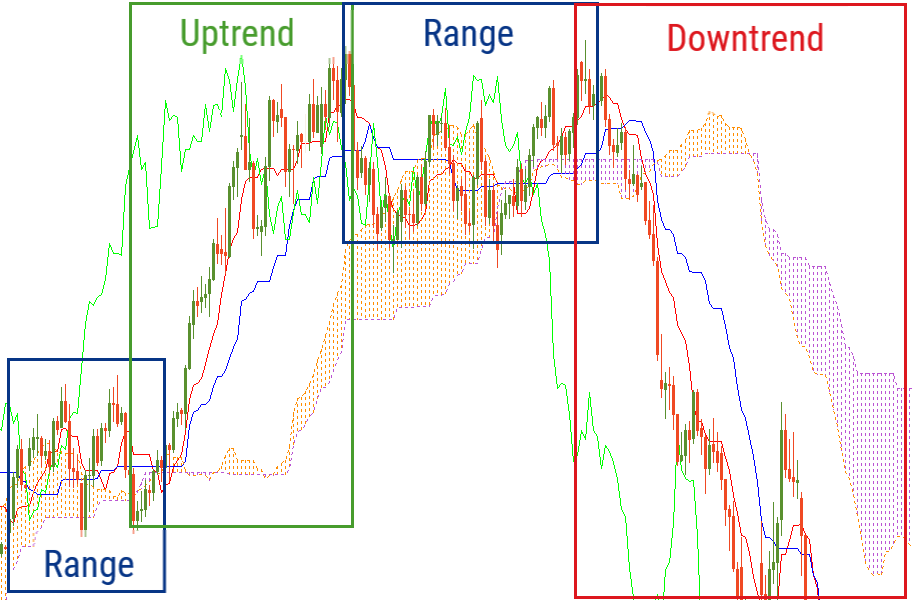
    Trend direction:
    • TK KJ se upar hai aur SA SB se upar hai: yah ek uptrend ka sandesh deta hai.
    • TK KJ se niche hai aur SA SB se niche hai: yah ek downtrend ka sandesh deta hai.
    • TK KJ ko paar karta hai: yah trend mein badlav ka sandesh deta hai.

    Momentum:
    • CS kimat se upar hai: yah bullish momentum ka sandesh deta hai.
    • CS kimat se niche hai: yah bearish momentum ka sandesh deta hai.

    Support/resistance:
    • SA aur SB: ine lines ka use support aur resistance levels ke roop mein kiya ja sakta hai.
    • TK aur KJ: ine lines ka use secondary support aur resistance levels ke roop mein kiya ja sakta hai.
    Click image for larger version

Name:	grade5-ichimoku-kinko-hyo-indicators.png
Views:	17
Size:	51.7 کلوبائٹ
ID:	12996572


    IKH ka upyog karne ke liye kuchh Suggestion:
    • IKH ko anya technical indicators ke sath jodkar use karen.
    • IKH se signals lene se pahle trend direction ki tasdik karen.
    • risk management ka use karen aur apne trade ko rokane ke liye stop-loss order ka use karen.

    IKH ek powerful technical analysis tool hai jo traders ko trend, momentum aur support/resistance levels ko samajhne mein madad kar sakta hai. halanki, yah yad rakhna mahatvpurn hai ki koi bhi indicator foolproof nahin hai aur hamesha risk management ka upyog karna chahie.

    Mujhe ummed ha ka ya jankari app sab ke liey helpfull rahi hoghi = thanks =
  • <a href="https://www.instaforex.org/ru/?x=ruforum">InstaForex</a>
  • #2 Collapse

    Introduction


    Ichimoku Kinko forex market mein aik kesam technical tool hota hey jo keh forex market mein zyada imkani trade ko bhe identify kar sakta hey yeh forex market main cloud trading system say melta julta technical system hota hey
    Ichimoku kinko short term forex trading ko identify kar sakta hey yeh forex market kay tehnical analysis bohut zyada help full bhe ho sakta hey
    Ichimoku kinko forex market Japanese tool hota hey jo keh forex trader kay chart ke bullish movement ko bhe identify kar sakta hey yeh forex market mein zyada sahi tarekay say bhe identify keya ja sakta hey or yeh forex market kay strong trend ko identify karnay mein bhe madad kar sakta hey
    forex market Ichimoku Kinko indicator download kar kay estamal keya jata hey or yeh forexmarket kay technical analysis mein estamal hota hey

    Understanding Ichimoku Kinko Hyo

    yeh forex market mein aik mofeed kesam ka technical indicator hota hey yeh forex market mein technical indicator he estamal hota hey es ka naam Japanese candlestick say he leya jata hy yeh aik tawazon kesam ka chart pattern hota hey es indicator par moshtamel forex trader aik he nazar mein sab kuch sekh kar challay jatay hein jes mein ap ko forex market kay hallat kay baray jananay ke zaroorat hote hey

    Ichimoku kinko indicator mein 2 kesam ke moving average line estaal ke jate hey senkou span b baray period kay moving average ko indicate kar sakte hey jabkeh senko span A chotay period ke moving average line ko bhe indicate kar sakte hey es tarah jab hota hey to forex market cloud bullish ka samjha jata hey ager senkou span A bara ho or senkou span B chota ho to es kesam kay trend ko bearish ka trend samjha jata hey

    Ichimoku kinko ko forex market mein estamal

    Ichimoku kinko ko forex market ke position trading or trend trading mein he estamal keya ja sakta hey jab forex market aik side par movement karte hey Horizontal line ke movement ke jate hey forex market ke price irad gerd kay otar charhao ko he identify kar sakte hey cloud weak ho to zyada tar apna rang badal jata hey
    ager price Tenkan Kijun say oper ke taraf movement karte hey to forex market mein bullish cloud solid ho jata hey Ichimoku es moamllay mein price kay oper he movement kar sakta hey
    ager price Tenkan Kijun say nechay movemet kar rehe hey to Ichimoku price ko low ko identify kar sakta hey

    forex market mein Ichimoku Kinko aik dosray ke price ko cross kar kay trading signal ko cross kar sakte hey jab bhe koi new trend start hota heyforex market yeh indicator mokhtalef kesam kay signal ko identify kar sakta hey
    Last edited by ; 10-06-2024, 09:40 AM.
    bhali kay badlay bhali
    • #3 Collapse


      Forex Trading Mein Ichimoku Kinko Hyo:
      Ichimoku Kinko Hyo, jisay aksar "Ichimoku Cloud" bhi kaha jata hai, aik comprehensive technical analysis tool hai jo pehli martaba Goichi Hosoda nay 1960s main develop kiya tha. Yeh indicator khas tor par forex trading main kafi mashhoor hai kyun ke yeh traders ko multiple information aik hi chart par provide karta hai. Roman Urdu main hum is indicator ke mukhtalif components aur unka use samjhenge.


      Component of Ichinoku Kinko Hyo:
      1. Tenkan-sen (Conversion Line):
      Formula: (9-period high + 9-period low) / 2
      Role: Yeh short-term trend ko show karta hai. Agar yeh line kijun-sen ke upar hoti hai to yeh bullish signal hai, aur agar niche hoti hai to bearish signal hai.

      2. Kijun-sen (Base Line):
      Formula: (26-period high + 26-period low) / 2
      Role: Yeh medium-term trend ko show karta hai. Kijun-sen ko support aur resistance levels ke tor par bhi use kiya jata hai.

      3. Senkou Span A (Leading Span A):
      Formula: (Tenkan-sen + Kijun-sen) / 2, shifted 26 periods ahead
      Role: Yeh cloud ka pehla hissa banata hai aur future main support aur resistance levels ko indicate karta hai.

      4. **Senkou Span B (Leading Span B):
      Formula: (52-period high + 52-period low) / 2, shifted 26 periods ahead
      Role: Yeh cloud ka dusra hissa banata hai aur strong support aur resistance levels ko show karta hai.

      5. Chikou Span (Lagging Span):
      Formula: Current closing price, plotted 26 periods back
      Role: Yeh indicator ka sabse unique hissa hai jo past ke price action ke sath current price ko compare karta hai. Agar chikou span current price action ke upar hota hai to yeh bullish signal hota hai.


      Usage In Forex Trading:
      1. Trend Identification:
      Agar price cloud ke upar hota hai to yeh bullish trend hota hai.
      Agar price cloud ke niche hota hai to yeh bearish trend hota hai.
      Agar price cloud ke andar hota hai to yeh ranging market hota hai, yani price ek specific range main trade kar raha hota hai.

      2. Support and Resistance:
      Senkou Span A aur Senkou Span B ko future support aur resistance levels ke tor par use kiya jata hai. Cloud ka thickness support aur resistance ki strength ko show karta hai.

      3. Trading Signals:
      Bullish Signals:
      Jab Tenkan-sen, Kijun-sen ko upar cross karta hai aur price cloud ke upar hota hai.
      Bearish Signals:
      Jab Tenkan-sen, Kijun-sen ko niche cross karta hai aur price cloud ke niche hota hai.

      4. Lagging Span Confirmation:
      Chikou Span ko current price action ke sath compare karke trend confirmation ke liye use kiya jata hai. Agar Chikou Span current price action ke upar hota hai to trend bullish confirm hota hai aur agar niche hota hai to bearish confirm hota hai.


      Conclusion:
      Ichimoku Kinko Hyo aik powerful aur comprehensive indicator hai jo forex traders ko market ke trend, support aur resistance levels aur trading signals provide karta hai. Yeh indicator kaafi information aik chart par provide karta hai jo traders ko informed decisions lene main madadgar hota hai. Beginners ke liye is indicator ko samajhna mushkil ho sakta hai, lekin practice aur time ke sath yeh aik invaluable tool ban sakta hai.

      Is information ko samajh kar aur practice karke, aap forex trading main better decisions le sakte hain aur apni trading strategy ko improve kar sakte hain.
      • #4 Collapse

        1. Introduction: Ichimoku Kinko Hyo Indicator

        Forex trading, jise currency trading bhi kehte hain, ek global market hai jahan currencies ko khareedna aur bechna hota hai. Yeh market 24 ghanton ke doraan chalti hai aur duniya bhar ke traders ismein shamil hote hain. Ek acchi trading strategy ke bina, forex trading mein kamyabi haasil karna mushkil ho sakta hai. Ichimoku Kinko Hyo ek aham technical analysis tool hai jo traders ko market trends aur price movements ke baray mein maloomat faraham karta hai. Iska naam Japani shajaroh se liya gaya hai aur iska matlab hai "ek jhalak ke zariye taraqqi hasil karna."

        2. Components: Ichimoku Kinko Hyo Ke Ahem Hissaat

        Ichimoku Kinko Hyo indicator ke chaar ahem hissaaat hain jo trading analysis mein istemal kiye jate hain:
        • Tenkan-sen: Ye Tenkan-sen current price ka 9-period average hota hai. Isay short-term trend ko measure karne ke liye istemal kiya jata hai.
        • Kijun-sen: Kijun-sen 26-periods ka average hota hai. Ye medium-term trend ko darust karta hai.
        • Senkou Span A: Senkou Span A Tenkan-sen aur Kijun-sen ka average hota hai jo 26 periods ke aadhar par calculate kiya jata hai.
        • Senkou Span B: Senkou Span B 52-periods ka average hota hai. Ye future ki support aur resistance ko darust karta hai.

        3. Tenkan-sen: Current Price Ka Average

        Tenkan-sen ek aham component hai jo current price ka 9-period average hota hai. Isay short-term trend ko measure karne ke liye istemal kiya jata hai. Agar Tenkan-sen ki line ne price ke upar se guzri hai, toh ye ek bullish signal hai aur agar price ne isay neeche se guzra hai, toh ye ek bearish signal hai. Tenkan-sen ka istemal karke traders current market momentum ko analyze kar sakte hain.

        4. Kijun-sen: 26-Periods Ka Average

        Kijun-sen 26-periods ka average hota hai aur medium-term trend ko darust karta hai. Jab Kijun-sen ki line ne price ke upar se guzri hai, toh ye ek bullish signal hai aur jab price isay neeche se guzri hai, toh ye ek bearish signal hai. Kijun-sen ki value, current market ki strength aur stability ka ek indicator hai.

        5. Senkou Span A: Average Of Tenkan-sen And Kijun-sen

        Senkou Span A Tenkan-sen aur Kijun-sen ka average hota hai jo 26 periods ke aadhar par calculate kiya jata hai. Isay future ki support aur resistance level ko darust karna mein istemal kiya jata hai. Agar Senkou Span A Senkou Span B se upar hai, toh ye ek bullish signal hai aur agar ye neeche hai, toh ye ek bearish signal hai.

        6. Senkou Span B: 52-Periods Ka Average

        Senkou Span B 52-periods ka average hota hai. Ye bhi future ki support aur resistance ko darust karta hai. Agar Senkou Span B Senkou Span A se upar hai, toh ye ek strong bullish signal hai aur agar ye neeche hai, toh ye ek strong bearish signal hai.

        7. Kumo (Cloud): Ichimoku Kinko Hyo Ka Sab Se Ahem Hissa

        Kumo ya cloud Ichimoku Kinko Hyo ka sab se ahem hissa hai. Ye Senkou Span A aur Senkou Span B ke darmiyan bana hota hai. Kumo future ki support aur resistance ke levels ko darust karta hai. Agar cloud thick hai, toh ye ek strong support ya resistance level ko darust karta hai, jabki agar ye patla hai, toh ye ek weak level ko darust karta hai.

        8. Trading Signals: Ichimoku Kinko Hyo Ke Trading Signals

        Ichimoku Kinko Hyo trading signals provide karta hai jo traders ko market ke movements ke baray mein maloomat faraham karta hai. Kuch mukhtalif trading signals hain:
        • TK Crossover: Jab Tenkan-sen Kijun-sen ko upar se cross karta hai, toh ye ek bullish signal hai aur jab ye neeche se cross karta hai, toh ye ek bearish signal hai.
        • Price Cloud Mein Entry: Jab price cloud ke andar dakhil hoti hai, toh ye ek confirmatory bullish signal hai aur jab price cloud ke bahar jaati hai, toh ye ek confirmatory bearish signal hai.
        • Cloud Breakout: Jab price cloud se bahar nikal jaati hai, toh ye ek strong bullish signal hai aur jab ye cloud ke andar jaati hai, toh ye ek strong bearish signal hai.

        9. Trend Identification: Trend Ki Pehchan

        Ichimoku Kinko Hyo indicator trend identification mein madad karta hai. Agar price cloud ke upper ya lower mein hai, toh ye uptrend ya downtrend ko darust karta hai. Agar price cloud ke andar hai, toh ye consolidation phase ko darust karta hai.

        10. Support And Resistance: Support Aur Resistance Ke Aasani Se Pata Lagaye

        Senkou Span A aur Senkou Span B support aur resistance ki pesh karta hai. Cloud ka size bhi support aur resistance ki taqat ko darust karta hai. Agar cloud bara hai, toh ye strong support ya resistance level ko darust karta hai, jabki agar cloud patla hai, toh ye weak level ko darust karta hai.

        11. Chikou Span: Lagging Line

        Chikou Span current price ko 26 periods peechay rakhta hai. Ye confirmatory signal provide karta hai. Agar Chikou Span price ke upper se guzri hai, toh ye ek bullish signal hai aur agar ye price ke neeche se guzri hai, toh ye ek bearish signal hai.

        12. Trading Strategies: Ichimoku Kinko Hyo Ke Trading Strategies

        Ichimoku Kinko Hyo ke kai trading strategies hain jo traders istemal karte hain apni trading performance ko behtar banane ke liye. Kuch popular strategies hain jese:
        • Kumo Breakout Strategy: Is strategy mein traders cloud ke breakout par trade karte hain. Agar price cloud se bahar nikalti hai, toh ye ek bullish signal hai aur agar cloud ke andar jaati hai, toh ye ek bearish signal hai. Traders is strategy ko confirm karne ke liye dusre indicators ka istemal bhi karte hain.
        • TK Crossover Strategy: TK crossover strategy mein traders Tenkan-sen aur Kijun-sen ke crossover par trade karte hain. Agar Tenkan-sen Kijun-sen ko upar se cross karta hai, toh ye ek bullish signal hai aur agar neeche se cross karta hai, toh ye ek bearish signal hai.
        • Kumo Twist Strategy: Is strategy mein traders cloud ke twist par trade karte hain. Jab Senkou Span A Senkou Span B ko upar se cross karti hai, toh ye ek bullish signal hai aur jab ye neeche se cross karti hai, toh ye ek bearish signal hai.

        13. Limitations: Ichimoku Kinko Hyo Ke Hadood

        Ichimoku Kinko Hyo indicator ke istemal mein kuch hadood hain jinhe traders ko samajhna zaroori hai:
        • False Signals: Kabhi-kabhi, Ichimoku Kinko Hyo false signals bhi provide kar sakta hai, jaise ke cloud ke andar hona ya phir choppy market conditions mein.
        • Complex Interpretation: Ichimoku Kinko Hyo ka istemal karna complex ho sakta hai, khas karke beginners ke liye jo iska istemal naya hain. Isliye, traders ko is indicator ko samajhne mein waqt aur mehnat lagani hogi.

        14. Conclusion: Ichimoku Kinko Hyo Ka Istemal

        Ichimoku Kinko Hyo ek powerful aur versatile indicator hai jo traders ko market trends aur price movements ke baray mein maloomat faraham karta hai. Iska istemal sahi tareeqay se kiya jaye toh ye trading performance ko behtar kar sakta hai. Traders ko is indicator ke ahem hissaaat aur signals ko samajhna aur uspar amal karna seekhna chahiye taake wo apni trading strategy ko mazeed mazboot kar sakein.

        Yeh tha Ichimoku Kinko Hyo indicator ke roman Urdu mein tafseelat se maloomat faraham karne ka article. Forex trading mein safar karte waqt, traders ko mukhtalif tools aur indicators ka istemal karna chahiye taake wo market ko samajh sakein aur kamyabi haasil kar sakein.
        • #5 Collapse

          Ichimoku Kinko Hyo Indicator in Forex Trading

          1. Ichimoku Kinko Hyo Kya Hai?


          Ichimoku Kinko Hyo aik Japanese technical analysis indicator hai jo 1960s mein Goichi Hosoda ne develop kiya. Iska primary purpose yeh hai ke yeh ek integrated system hai jo trader ko multiple aspects par ek hi nazar mein insight deta hai. Yeh indicator trading ke liye multiple factors ko combine karta hai jese ke trend direction, support aur resistance levels, aur momentum. Iska literal meaning "one glance equilibrium chart" hai, aur yeh naam iske kaam ko accurately describe karta hai. Yeh indicator zyada tar forex market mein use hota hai, lekin stocks aur commodities trading mein bhi iska istemal hota hai.


          2. Basic Components of Ichimoku Kinko Hyo


          Ichimoku Kinko Hyo paanch mukh components par mabni hota hai jo collectively market ka ek complete picture dete hain. Yeh paanch components hain:
          • Tenkan-sen (Conversion Line)
          • Kijun-sen (Base Line)
          • Senkou Span A (Leading Span A)
          • Senkou Span B (Leading Span B)
          • Chikou Span (Lagging Span)

          Yeh paanch components mil kar trader ko price action ka ek comprehensive view dete hain. Inko alag alag parts ke taur par samajhna zaroori hai lekin inka combined effect hi actual trading decisions mein madadgar hota hai.


          3. Tenkan-sen (Conversion Line)


          Tenkan-sen ko conversion line bhi kaha jata hai aur yeh Ichimoku system ka sab se pehla component hai. Yeh 9-period moving average hai jo pichle 9 periods ka highest high aur lowest low ka average hota hai. Iska formula kuch yun hai:

          Tenkan-sen=(Highest High+Lowest Low)2\text{Tenkan-sen} = \frac{(\text{Highest High} + \text{Lowest Low})}{2}Tenkan-sen=2(Highest High+Lowest Low)​

          Tenkan-sen short-term price movements ko capture karta hai aur short-term trends ko identify karne mein madadgar hota hai. Agar Tenkan-sen Kijun-sen ko upar se cross kare, toh yeh bullish signal hota hai aur agar neeche se cross kare, toh yeh bearish signal hota hai.


          4. Kijun-sen (Base Line)


          Kijun-sen ko base line bhi kaha jata hai aur yeh 26-period moving average hai jo pichle 26 periods ka highest high aur lowest low ka average hota hai. Iska formula kuch yun hai:

          Kijun-sen=(Highest High+Lowest Low)2\text{Kijun-sen} = \frac{(\text{Highest High} + \text{Lowest Low})}{2}Kijun-sen=2(Highest High+Lowest Low)​

          Kijun-sen medium-term price movements ko capture karta hai aur market ki overall trend direction ko identify karne mein madadgar hota hai. Agar price Kijun-sen ke upar trade kar rahi hai, toh yeh bullish trend ko indicate karta hai aur agar neeche trade kar rahi hai, toh yeh bearish trend ko indicate karta hai.


          5. Senkou Span A (Leading Span A)


          Senkou Span A Ichimoku cloud ka ek hissa hai aur yeh Tenkan-sen aur Kijun-sen ka average hota hai jo 26 periods aage plot kiya jata hai. Iska formula kuch yun hai:

          Senkou Span A=(Tenkan-sen+Kijun-sen)2\text{Senkou Span A} = \frac{(\text{Tenkan-sen} + \text{Kijun-sen})}{2}Senkou Span A=2(Tenkan-sen+Kijun-sen)​

          Senkou Span A future support aur resistance levels ko identify karne mein madadgar hota hai. Yeh cloud ka upper boundary hota hai agar yeh Senkou Span B ke upar hai aur lower boundary hota hai agar yeh Senkou Span B ke neeche hai.


          6. Senkou Span B (Leading Span B)


          Senkou Span B bhi Ichimoku cloud ka ek hissa hai aur yeh 52-period moving average hai jo pichle 52 periods ka highest high aur lowest low ka average hota hai aur 26 periods aage plot hota hai. Iska formula kuch yun hai:

          Senkou Span B=(Highest High+Lowest Low)2\text{Senkou Span B} = \frac{(\text{Highest High} + \text{Lowest Low})}{2}Senkou Span B=2(Highest High+Lowest Low)​

          Senkou Span B cloud ka lower boundary hota hai agar yeh Senkou Span A ke neeche hai aur upper boundary hota hai agar yeh Senkou Span A ke upar hai. Senkou Span B typically zyada stable hota hai kyunke yeh longer time period ka average hai.


          7. Chikou Span (Lagging Span)


          Chikou Span current closing price ko 26 periods peechay shift karke plot karta hai. Yeh Ichimoku indicator ka pichle components se mukhtalif hai kyunke yeh lagging indicator hai. Chikou Span ko market sentiment aur trend strength ko assess karne ke liye use kiya jata hai. Agar Chikou Span price ke upar hai, toh yeh bullish sentiment ko indicate karta hai aur agar price ke neeche hai, toh yeh bearish sentiment ko indicate karta hai.


          8. Kumo (Cloud)


          Kumo ya cloud Senkou Span A aur Senkou Span B ke beech ka area hota hai. Yeh Ichimoku system ka sab se unique aur distinctive component hai. Cloud ka color aur size market ki volatility aur strength ko indicate karta hai. Agar cloud mota aur wide hai, toh yeh strong support ya resistance ka indication hota hai aur agar cloud patla hai, toh yeh weak support ya resistance ka indication hota hai.


          9. Kumo Ka Color


          Kumo ka color bhi important hai. Agar Senkou Span A, Senkou Span B ke upar hai, toh cloud green hota hai jo bullish trend ko indicate karta hai. Isko Kumo's bullish color bhi kaha jata hai. Agar Senkou Span A, Senkou Span B ke neeche hai, toh cloud red hota hai jo bearish trend ko indicate karta hai. Isko Kumo's bearish color bhi kaha jata hai.


          10. Trend Identification


          Ichimoku Kinko Hyo ka primary purpose trend identification hai. Ichimoku indicator ko use karte hue, traders asaani se trend identify kar sakte hain. Yeh indicator market ka comprehensive view provide karta hai jo multiple factors ko combine karta hai jese ke trend direction, support aur resistance levels, aur momentum. Price agar cloud ke upar trade kar rahi hai, toh yeh bullish trend ko indicate karta hai aur agar price cloud ke neeche trade kar rahi hai, toh yeh bearish trend ko indicate karta hai.


          11. Support aur Resistance Levels


          Ichimoku cloud future support aur resistance levels ko identify karne mein madadgar hota hai. Cloud ka upper boundary future resistance level ko indicate karta hai aur lower boundary future support level ko indicate karta hai. Agar price cloud ke andar move kar rahi hai, toh yeh consolidation ya indecision ka indication hota hai. Cloud ka size aur color bhi support aur resistance levels ki strength ko indicate karta hai.


          12. Signals for Trading


          Ichimoku Kinko Hyo multiple trading signals provide karta hai jo traders ko effective trading decisions lene mein madadgar hote hain. Kuch primary signals hain:
          • Bullish Crossover: Jab Tenkan-sen, Kijun-sen ko upar se cross karta hai, toh yeh bullish signal hota hai.
          • Bearish Crossover: Jab Tenkan-sen, Kijun-sen ko neeche se cross karta hai, toh yeh bearish signal hota hai.
          • Price vs. Cloud: Agar price cloud ke upar trade kar rahi hai, toh yeh bullish signal hota hai aur agar neeche trade kar rahi hai, toh yeh bearish signal hota hai.
          • Chikou Span: Agar Chikou Span current price ke upar hai, toh yeh bullish signal hota hai aur agar neeche hai, toh yeh bearish signal hota hai.

          13. Time Frames


          Ichimoku indicator ko different time frames par use kiya ja sakta hai. Long-term traders weekly ya monthly charts ka istemal kar sakte hain takay overall market trend ko assess kar sakein. Short-term traders daily ya hourly charts ka istemal kar sakte hain takay short-term price movements ko capture kar sakein. Ichimoku ka har component different time frames par different signals de sakta hai, isliye time frame ka selection trading strategy par depend karta hai.


          14. Risk Management


          Ichimoku indicator ke sath proper risk management zaroori hai. Cloud ka istemal karke traders stop-loss aur take-profit levels set kar sakte hain. Agar price cloud ke upar trade kar rahi hai, toh cloud ka lower boundary stop-loss level ho sakta hai. Agar price cloud ke neeche trade kar rahi hai, toh cloud ka upper boundary stop-loss level ho sakta hai. Proper risk management ke baghair trading risky ho sakti hai, isliye Ichimoku ka istemal karte hue risk management strategies ko implement karna zaroori hai.


          15. Conclusion


          Ichimoku Kinko Hyo aik powerful aur comprehensive tool hai jo forex trading mein trend identification, support aur resistance levels, aur trading signals provide karta hai. Proper understanding aur practice se traders isse apni trading strategy mein effectively integrate kar sakte hain. Ichimoku ka istemal karte hue, traders ko iske different components aur signals ka deep understanding hona chahiye takay yeh trading decisions mein madadgar sabit ho. Iska naam hi "one glance equilibrium chart" hai aur yeh naam iske kaam ko accurately describe karta hai.

          Overall, Ichimoku Kinko Hyo aik holistic approach provide karta hai jo price action ka comprehensive view deta hai. Yeh indicator trading ke liye ek integrated system hai jo multiple aspects ko combine karta hai. Traders jo isse effectively use karte hain, wo market trends aur price movements ko accurately predict karne mein successful ho sakte hain.
          • #6 Collapse

            Ichimoku Kinko Hyo?
            Click image for larger version

Name:	download (4).jpeg
Views:	10
Size:	16.2 کلوبائٹ
ID:	12997355
            **Ichimoku Kinko Hyo Indicator: A Powerful Tool in Forex Trading**
            Forex trading is a dynamic world where traders seek tools to analyze the market and make informed decisions. One such tool gaining popularity is the Ichimoku Kinko Hyo indicator, a comprehensive technical analysis tool developed by Japanese journalist Goichi Hosoda in the late 1960s.

            **Understanding Ichimoku Kinko Hyo:**

            *Ichimoku Kinko Hyo*, often referred to simply as Ichimoku, translates to "one glance equilibrium chart" in Japanese, indicating its ability to provide a comprehensive view of the market with a single glance.

            **Components of Ichimoku Kinko Hyo:**

            1. **Tenkan-sen (Conversion Line):** This is the shorter-term moving average and is calculated as the average of the highest high and the lowest low over the past nine periods.

            2. **Kijun-sen (Base Line):** This represents the longer-term moving average and is calculated similarly to the Tenkan-sen but over the past 26 periods.

            3. **Senkou Span A (Leading Span A):** This is the average of the Tenkan-sen and Kijun-sen plotted 26 periods ahead.

            4. **Senkou Span B (Leading Span B):** This is the average of the highest high and the lowest low over the past 52 periods, plotted 26 periods ahead.

            5. **Chikou Span (Lagging Span):** This represents the closing price plotted 26 periods in the past.

            **Interpreting Ichimoku Kinko Hyo:**

            - **Cloud (Kumo):** The area between Senkou Span A and Senkou Span B is known as the cloud. It provides support and resistance levels, with a bullish signal occurring when the price is above the cloud and a bearish signal when below.

            - **Crosses:** When the Tenkan-sen crosses above the Kijun-sen, it indicates a potential bullish signal, and vice versa for a bearish signal.

            - **Chikou Span:** Its position relative to the price chart can provide confirmation of a trend. If it is above the price chart, it supports a bullish trend, and vice versa.

            **Advantages of Ichimoku Kinko Hyo:**

            1. **Comprehensiveness:** It provides a holistic view of the market's equilibrium, incorporating various elements into its analysis.

            2. **Versatility:** It can be used on multiple time frames, making it suitable for both short-term and long-term trading strategies.

            3. **Clear Signals:** Its components offer clear signals for entry and exit points, aiding traders in decision-making.

            **Conclusion:**

            The Ichimoku Kinko Hyo indicator is a valuable tool for forex traders, offering a comprehensive analysis of market conditions with a single glance. By understanding its components and interpreting its signals, traders can make more informed trading decisions and navigate the complexities of the forex market more effectively.
            • #7 Collapse

              ​Ichimoku Kinko Hyo indicator in forex trading

              Click image for larger version

Name:	images (17).jpeg
Views:	9
Size:	16.3 کلوبائٹ
ID:	12997592
              ​​​​​​### Ichimoku Kinko Hyo Indicator: Forex Trading Mein Ek Powerful Tool

              Ichimoku Kinko Hyo, ya Ichimoku Cloud, ek Japanese technical analysis tool hai jo forex trading mein istemal hota hai. Is indicator ka use trend direction ko identify karne aur potential entry aur exit points ko determine karne ke liye kiya jata hai. Ichimoku Kinko Hyo indicator ke components ko samajhne se pehle, humein iska naam aur matlab samajhna zaroori hai.

              ### Ichimoku Kinko Hyo Ka Nam Aur Matlab

              1. **Ichimoku:** Ichimoku ka matlab hai "a glance" ya "one look". Iska naam isliye hai kyun ke is indicator ko dekh kar traders ek jhalak mein trend, support aur resistance levels ko samajh sakte hain.

              2. **Kinko Hyo:** Kinko Hyo ka matlab hai "equilibrium chart". Yeh indicator market equilibrium ko represent karta hai aur price ke future direction ko predict karta hai.

              ### Ichimoku Kinko Hyo Indicator Ke Components

              1. **Kumo (Cloud):**
              - Kumo, ya cloud, Ichimoku Kinko Hyo ka sabse prominent component hai. Cloud future support aur resistance levels ko represent karta hai.

              2. **Senkou Span A (Leading Span A) aur Senkou Span B (Leading Span B):**
              - Senkou Span A aur Senkou Span B cloud ke components hote hain jo future price movement ko forecast karte hain. Inki calculation past price action par base hoti hai.

              3. **Tenkan-sen (Conversion Line) aur Kijun-sen (Base Line):**
              - Tenkan-sen, ya conversion line, aur Kijun-sen, ya base line, short-term aur medium-term trends ko represent karte hain. In dono lines ki intersection entry aur exit points ke liye use ki jati hai.

              4. **Chikou Span (Lagging Span):**
              - Chikou Span, ya lagging span, current price ko past price action ke sath compare karta hai. Iska use trend confirmation ke liye kiya jata hai.

              ### Ichimoku Kinko Hyo Ka Istemal

              1. **Trend Identification:**
              - Ichimoku Kinko Hyo indicator ke use se current market trend ko identify kiya ja sakta hai. Agar price cloud ke andar hai, to trend bullish hai. Agar price cloud ke bahar hai, to trend bearish hai.

              2. **Entry Points Determination:**
              - Tenkan-sen aur Kijun-sen ki crossover se entry points determine kiye ja sakte hain. Agar Tenkan-sen Kijun-sen ko upar se cross karta hai, to buy signal generate hota hai. Agar Tenkan-sen Kijun-sen ko neeche se cross karta hai, to sell signal generate hota hai.

              3. **Support aur Resistance Levels:**
              - Kumo cloud future support aur resistance levels ko represent karta hai. Agar price cloud ke andar hai, to cloud support provide karta hai. Agar price cloud ke bahar hai, to cloud resistance provide karta hai.

              4. **Trend Confirmation:**
              - Chikou Span ki current price ko past price action ke sath compare karne se trend confirm kiya ja sakta hai. Agar Chikou Span price ke upar hai, to bullish trend confirm hota hai. Agar Chikou Span price ke neeche hai, to bearish trend confirm hota hai.

              ### Ichimoku Kinko Hyo Ke Sath Trading Strategies

              1. **Kumo Breakout Strategy:**
              - Agar price cloud ke andar se bahar breakout karta hai, to yeh bullish breakout signal hota hai. Agar price cloud ke bahar se andar breakout karta hai, to yeh bearish breakout signal hota hai.

              2. **Tenkan-sen aur Kijun-sen Crossover Strategy:**
              - Jab Tenkan-sen Kijun-sen ko upar se cross karta hai, to buy signal generate hota hai. Jab Tenkan-sen Kijun-sen ko neeche se cross karta hai, to sell signal generate hota hai.

              3. **Chikou Span Confirmation Strategy:**
              - Agar Chikou Span current price ke upar hai aur price cloud ke andar hai, to yeh bullish confirmation signal hota hai. Agar Chikou Span current price ke neeche hai aur price cloud ke bahar hai, to yeh bearish confirmation signal hota hai.

              ### Ichimoku Kinko Hyo Ka Istemal Aur Risk Management

              1. **Stop-Loss Orders:**
              - Stop-loss orders ka use karke potential losses ko control kiya ja sakta hai. Stop-loss levels ko support aur resistance levels ke based par set kiya jata hai.

              2. **Take-Profit Orders:**
              - Take-profit orders ko use karke profits ko secure kiya ja sakta hai. Take-profit levels ko trend ke direction aur key technical levels ke based par set kiya jata hai.

              3. **Risk-Reward Ratio:**
              - Risk-reward ratio ko consider karein. Achi trading opportunities wo hoti hain jahan potential reward zyada ho aur risk kam ho.

              ### Ichimoku Kinko Hyo Ka Istemal Aur Important Tips

              1. **Practice on Demo Account:**
              - Ichimoku Kinko Hyo indicator ko samajhne aur practice karne ke liye demo account par trading karein.

              2. **Combine with Other Indicators:**
              - Ichimoku Kinko Hyo indicator ko dusre technical indicators ke sath combine karein jaise ke RSI (Relative Strength Index) aur MACD (Moving Average Convergence Divergence).

              3. **Stay Updated with News:**
              - Forex market ko impact karne wale latest news aur events se updated rahna zaroori hai. Economic calendars aur financial news sources ka use karke important updates ko track karein.

              ### Conclusion

              Ichimoku Kinko Hyo indicator forex trading mein ek powerful tool hai jo trend direction ko identify karne aur entry aur exit points ko determine karne mein madad karta hai. Is indicator ke components ko samajh kar aur sahi trading strategies ka istemal karke traders profitable results achieve kar sakte hain. Risk management techniques aur proper analysis ke sath sath disciplined approach se aap Ichimoku Kinko Hyo ka istemal karke forex trading mein success hasil kar sakte hain.
              • #8 Collapse

                1. Introduction:

                  Forex trading, also known as foreign exchange trading, involves buying and selling currencies with the aim of making a profit. Ichimoku Kinko Hyo, often referred to as Ichimoku Cloud or simply Ichimoku, is a versatile technical analysis tool used by forex traders to analyze market trends and identify potential trading opportunities.

                  Forex trading, being a 24-hour market, presents unique challenges and opportunities for traders. The Ichimoku Kinko Hyo indicator helps traders navigate these complexities by providing a holistic view of the market at a glance.
                2. Ichimoku Kinko Hyo Ka Tareeqa:

                  Ichimoku Kinko Hyo, which translates to "equilibrium chart at a glance" in Japanese, is composed of multiple components that work together to provide a comprehensive analysis of market conditions. These components include the Conversion Line (Tenkan-sen), Base Line (Kijun-sen), Leading Span A (Senkou Span A), Leading Span B (Senkou Span B), and the Cloud (Kumo).

                  The indicator was developed by Japanese journalist Goichi Hosoda in the late 1930s and has since gained popularity among traders worldwide for its simplicity and effectiveness.
                3. Components:

                  Each component of the Ichimoku Kinko Hyo indicator serves a specific purpose in analyzing market trends and identifying potential entry and exit points. Understanding how these components interact can help traders make more informed trading decisions.
                  • Tenkan-sen (Conversion Line): Represents short-term market momentum.
                  • Kijun-sen (Base Line): Provides insight into medium-term market trends.
                  • Senkou Span A and Senkou Span B (Leading Spans): Form the Cloud (Kumo) and indicate future support and resistance levels.
                  • Chikou Span (Lagging Span): Plots current closing price relative to past price action.
                4. Tenkan-sen (Conversion Line):

                  The Tenkan-sen, or Conversion Line, is calculated as the average of the highest high and the lowest low over the past nine periods. This line reflects short-term price momentum and is often used to identify potential trend reversals or continuations.

                  Traders typically look for crossovers between the Tenkan-sen and other components of the Ichimoku Kinko Hyo indicator to confirm trading signals.

                  For example, if the Tenkan-sen crosses above the Kijun-sen, it may signal a bullish trend, while a crossover below the Kijun-sen could indicate a bearish trend.
                5. Kijun-sen (Base Line):

                  The Kijun-sen, or Base Line, is calculated as the average of the highest high and the lowest low over the past 26 periods. This line provides insight into medium-term market trends and is often used as a support or resistance level by traders.

                  Similar to the Tenkan-sen, crossovers between the Kijun-sen and other components of the Ichimoku Kinko Hyo indicator can signal potential trading opportunities.

                  For instance, when the Kijun-sen crosses above the Tenkan-sen, it may indicate a strengthening bullish trend, while a crossover below the Tenkan-sen could suggest a weakening bullish trend or a potential reversal.
                6. Senkou Span A (Leading Span A):

                  Senkou Span A is calculated as the average of the Tenkan-sen and the Kijun-sen, plotted 26 periods ahead. This line, along with Senkou Span B, forms the Cloud (Kumo) and serves as a forward-looking indicator of potential support and resistance levels.

                  Traders often use the width and slope of the Cloud to gauge the strength of a trend or identify potential trend reversals.

                  For example, a widening Cloud indicates increasing volatility and potential continuation of the trend, while a narrowing Cloud may signal a trend reversal or consolidation.
                7. Senkou Span B (Leading Span B):

                  Senkou Span B is calculated as the average of the highest high and the lowest low over the past 52 periods, plotted 26 periods ahead. Together with Senkou Span A, it forms the Cloud (Kumo) and helps traders identify potential support and resistance levels in the future.

                  Traders pay close attention to the relationship between Senkou Span A and Senkou Span B, as well as their positions relative to the current price, to assess market sentiment and potential trading opportunities.

                  For instance, when Senkou Span A is above Senkou Span B and both are above the current price, it may indicate a bullish trend, whereas if Senkou Span A is below Senkou Span B and both are below the current price, it may suggest a bearish trend.
                8. Kumo (Cloud):

                  The Kumo, or Cloud, is formed by Senkou Span A and Senkou Span B and represents a zone of potential support and resistance in the future. The width and slope of the Cloud provide valuable insights into market volatility and trend strength.

                  Traders often look for price action signals, such as breakouts or bounces, near the Cloud to confirm trading decisions.

                  For example, if the price breaks above the Cloud, it may signal a bullish breakout and a potential buying opportunity, while a bounce off the Cloud resistance could indicate a bearish reversal.
                9. Chikou Span (Lagging Span):

                  The Chikou Span, or Lagging Span, plots the closing price of the current candlestick plotted 26 periods back on the chart. This component provides traders with a visual representation of current market sentiment relative to past price action.

                  Traders use the Chikou Span to confirm trading signals generated by other components of the Ichimoku Kinko Hyo indicator.

                  For instance, if the Chikou Span crosses above the price chart, it may indicate a bullish trend confirmation, whereas a crossover below the price chart could suggest a bearish trend confirmation.
                10. Ichimoku Kinko Hyo Ka Istemal:

                  The Ichimoku Kinko Hyo indicator can be used in various ways by forex traders to analyze market trends, identify potential entry and exit points, and manage risk effectively. Here are some common strategies used by traders:
                  • Trend Identification: Traders use the Ichimoku Kinko Hyo indicator to identify prevailing market trends, whether bullish, bearish, or ranging. By analyzing the position of the price relative to the Cloud and the relationships between various components of the indicator, traders can determine the direction and strength of the trend.
                  • Entry and Exit Points: The Ichimoku Kinko Hyo indicator provides traders with clear signals for entering and exiting trades. Traders typically look for crossovers between the Tenkan-sen and Kijun-sen lines, as well as price movements relative to the Cloud, to identify potential entry and exit points. For example, a bullish crossover between the Tenkan-sen and Kijun-sen linescould signal a buy opportunity, while a bearish crossover may indicate a sell opportunity. Additionally, breakouts above or below the Cloud can also serve as confirmation signals for entry or exit points.
                • Stop Loss and Take Profit: Traders use the Ichimoku Kinko Hyo indicator to set stop loss and take profit levels based on key support and resistance levels identified by the Cloud and other components of the indicator. By placing stop loss orders below key support levels in an uptrend or above key resistance levels in a downtrend, traders can limit their losses and protect their capital. Similarly, take profit orders can be set at levels where the price is likely to encounter resistance in an uptrend or support in a downtrend, allowing traders to lock in profits.
                • Confirmation of Signals: The Ichimoku Kinko Hyo indicator can be used to confirm signals generated by other technical analysis tools or trading strategies. For example, if a moving average crossover signal is generated on a price chart, traders can use the Ichimoku Kinko Hyo indicator to confirm the validity of the signal based on the position of the price relative to the Cloud and other components of the indicator.
                1. Trend Identification:

                  Trend identification is one of the primary functions of the Ichimoku Kinko Hyo indicator. By analyzing the relationship between the various components of the indicator and the price action, traders can determine whether the market is in an uptrend, downtrend, or ranging phase.

                  In an uptrend, the price tends to be above the Cloud, and the Tenkan-sen (Conversion Line) is above the Kijun-sen (Base Line). Additionally, Senkou Span A (Leading Span A) is above Senkou Span B (Leading Span B), and the Chikou Span (Lagging Span) is above the price chart. These conditions indicate bullish market sentiment, and traders may look for buying opportunities.

                  Conversely, in a downtrend, the price tends to be below the Cloud, and the Tenkan-sen is below the Kijun-sen. Senkou Span A is below Senkou Span B, and the Chikou Span is below the price chart. These conditions suggest bearish market sentiment, and traders may consider selling opportunities.

                  In a ranging market, the price moves sideways within the Cloud, and the Tenkan-sen and Kijun-sen may converge or move horizontally. The Cloud may also appear flat or narrow. In such conditions, traders may choose to avoid trading or use range-bound strategies to capitalize on price fluctuations.
                2. Entry and Exit Points:

                  The Ichimoku Kinko Hyo indicator provides traders with clear entry and exit points based on signals generated by its components. Traders typically look for the following signals to enter or exit trades:
                  • Tenkan-sen/Kijun-sen Crossovers: When the Tenkan-sen crosses above the Kijun-sen, it generates a bullish signal, indicating a potential buying opportunity. Conversely, when the Tenkan-sen crosses below the Kijun-sen, it generates a bearish signal, suggesting a potential selling opportunity.
                  • Price/Cloud Breakouts: Breakouts above or below the Cloud can signal the beginning of a new trend. A breakout above the Cloud may indicate a bullish trend, while a breakout below the Cloud may indicate a bearish trend. Traders can enter trades in the direction of the breakout and set stop loss orders below (for bullish trades) or above (for bearish trades) the Cloud to manage risk.
                  • Chikou Span Confirmation: Traders can use the Chikou Span to confirm the validity of trading signals generated by other components of the Ichimoku Kinko Hyo indicator. If the Chikou Span confirms a bullish signal by crossing above the price chart or a bearish signal by crossing below the price chart, it strengthens the signal's reliability.

                  By combining these entry and exit signals with proper risk management techniques, such as setting stop loss and take profit orders, traders can improve their chances of success in the forex market.
                3. Stop Loss Aur Take Profit:

                  Stop loss and take profit levels are essential components of any trading strategy, including those based on the Ichimoku Kinko Hyo indicator. Stop loss orders are used to limit losses and protect capital in case the market moves against the trader's position, while take profit orders are used to lock in profits when the market moves in favor of the trader's position.

                  Traders can use the Ichimoku Kinko Hyo indicator to identify key support and resistance levels that can serve as potential stop loss and take profit levels. For example, in an uptrend, traders may set their stop loss orders below the Cloud or the Kijun-sen, which act as support levels. Conversely, in a downtrend, traders may set their stop loss orders above the Cloud or the Kijun-sen, which act as resistance levels.

                  Similarly, traders can use the Cloud and other components of the Ichimoku Kinko Hyo indicator to identify potential take profit levels. For example, in an uptrend, traders may set their take profit orders near the upper boundary of the Cloud or at key resistance levels identified by the indicator. In a downtrend, traders may set their take profit orders near the lower boundary of the Cloud or at key support levels.

                  By setting stop loss and take profit orders based on the Ichimoku Kinko Hyo indicator, traders can effectively manage risk and optimize their trading outcomes.
                4. Conclusion:

                  The Ichimoku Kinko Hyo indicator is a powerful technical analysis tool that provides traders with valuable insights into market trends and potential trading opportunities. By analyzing the relationship between its various components and the price action, traders can identify trends, enter and exit trades, and manage risk effectively.

                  While the Ichimoku Kinko Hyo indicator is versatile and widely used, it is essential for traders to understand that no indicator is foolproof, and trading always involves risk. Therefore, it is crucial to combine the use of the Ichimoku Kinko Hyo indicator with sound risk management principles and proper trading discipline to achieve long-term success in the forex market. With practice and experience, traders can harness the power of the Ichimoku Kinko Hyo indicator to make informed trading decisions and achieve their financial goals.
                • #9 Collapse

                  Forex Trading Mein Ichimoku Kinko Hyo Indicator Ka Istemal

                  Forex trading ke maharatmand aur safal traders wo hote hain jo technical analysis ke mukhtalif tools aur indicators ka sahi istemal karte hain. Ichimoku Kinko Hyo (IKH) indicator un tools mein se aik hai jo market trends ko analyze karne mein madad deta hai. Is article mein hum IKH indicator ke mukhtalif pehluon ko mukhtasar tafseel se samjhenge aur iske istemal ke tareeqay par ghaur karenge.
                  1. Introduction to Ichimoku Kinko Hyo


                  Ichimoku Kinko Hyo, ya IKH, ek comprehensive technical analysis tool hai jo Japani technical analyst Goichi Hosoda ne 1930s mein develop kiya tha. Iska naam "Equilibrium chart at a glance" yaani ek jhalak mein samajhne wala chart hai, jo market ki current aur future ki movement ko samajhne mein madad deta hai.
                  2. Components of Ichimoku Kinko Hyo


                  IKH indicator chaar mukhtalif components ya lines se bana hota hai:
                  • Tenkan-sen (Conversion Line): Tenkan-sen current price ka 9 periods ka average hota hai. Yeh short-term trend ko indicate karta hai aur market volatility ko zahir karta hai.
                  • Kijun-sen (Base Line): Kijun-sen 26 periods ka average hota hai. Yeh medium-term trend ko represent karta hai aur long-term support/resistance ke taur par istemal hota hai.
                  • Senkou Span A and Senkou Span B (Leading Spans): Senkou Span A future ki 26 periods ki average price hoti hai aur Senkou Span B future ki 52 periods ki average price hoti hai. In dono lines ko mila kar "Kumo" ya "cloud" banate hain jo future ki price movement ka idea deti hai.
                  • Chikou Span (Lagging Span): Chikou Span current price ko 26 periods peechay shift karta hai. Iska istemal past ki price action ko evaluate karne ke liye hota hai.
                  3. Tenkan-sen (Conversion Line)


                  Tenkan-sen, jise "Conversion Line" bhi kaha jata hai, current market momentum aur short-term trend ko measure karne ke liye istemal hota hai. Yeh line jald se jald price changes ko capture karne mein madad deta hai. Agar Tenkan-sen upar ki taraf move kar raha hai, to yeh bullish signal diya jata hai, jabke agar niche ki taraf move kar raha hai to yeh bearish signal hai.
                  4. Kijun-sen (Base Line)


                  Kijun-sen, ya "Base Line", medium-term trend ko evaluate karne ke liye important hai. Iska calculation 26 periods ke average price se hota hai. Agar price Kijun-sen se ooper hai, to yeh bullish signal samjha jata hai aur agar niche hai to yeh bearish signal hai. Kijun-sen ki positioning long-term support aur resistance levels ka bhi indication deta hai.
                  5. Senkou Span A and Senkou Span B (Leading Spans)


                  Senkou Span A aur Senkou Span B, jo "Leading Spans" kehlate hain, future ki price movement ka forecast karne mein help karte hain. In dono spans ki positioning aur cloud ke colors (red aur green) bullish ya bearish market sentiment ko reflect karte hain. Jab Senkou Span A Senkou Span B se upar hota hai, to bullish trend ka signal hota hai aur jab niche hota hai to bearish trend ka signal hota hai.
                  6. Chikou Span (Lagging Span)


                  Chikou Span, ya "Lagging Span", current price ko 26 periods peechay shift karta hai. Iska maqsad past ki price action ko confirm karna hai. Agar Chikou Span price se ooper hai, to yeh bullish signal diya jata hai aur agar niche hai to yeh bearish signal hai. Chikou Span ki positioning current price ke historical support aur resistance levels ko bhi highlight karti hai.
                  7. Interpretation of Ichimoku Kinko Hyo Signals


                  IKH indicator ke signals ko samajhna trading decisions ke liye crucial hai. Yahan kuch common interpretations hain:
                  • Price above Kumo Cloud (Bullish Signal): Jab price cloud ke upar hota hai, to yeh bullish trend ki indication hai aur traders long positions consider karte hain.
                  • Price below Kumo Cloud (Bearish Signal): Jab price cloud ke niche hota hai, to yeh bearish trend ki indication hai aur traders short positions consider karte hain.
                  • Crossovers of Tenkan-sen and Kijun-sen: Jab Tenkan-sen Kijun-sen ko ooper se niche cross karta hai, to yeh selling signal hai aur jab niche se ooper cross karta hai, to yeh buying signal hai.
                  8. Ichimoku Strategies in Forex Trading


                  Forex traders IKH indicator ko alag-alag strategies ke saath combine karte hain:
                  • Kumo Breakout Strategy: Is strategy mein traders price ke breakout ko identify karte hain jab price cloud ke andar ya bahar move karta hai.
                  • TK Cross Strategy: Ismein Tenkan-sen aur Kijun-sen ke crosses ko entry aur exit points ke liye use kiya jata hai.
                  • Senkou Span Cross Strategy: Is strategy mein Senkou Span A aur Senkou Span B ke crosses ko trend reversal signals ke taur par interpret kiya jata hai.
                  9. Advantages of Using Ichimoku Kinko Hyo


                  IKH indicator ke istemal ke kuch faide hain:
                  • Clear trend identification: IKH indicator market trends ko clearly define karta hai aur traders ko direction samajhne mein madad deta hai.
                  • Multiple signals for entry and exit: IKH ke multiple components ki wajah se traders ko entry aur exit points ka pata chalta hai.
                  • Can be used across different timeframes: IKH indicator alag-alag timeframes par bhi effectively kaam karta hai, from intraday to long-term charts.
                  10. Limitations of Ichimoku Kinko Hyo


                  IKH indicator ke kuch limitations bhi hain:
                  • Complexity for beginners: Beginners ke liye IKH indicator samajhna aur istemal karna challenging ho sakta hai.
                  • May lag during ranging markets: Jab market range-bound hota hai, tab IKH indicator ki signals mein der ho sakti hai.
                  • Requires confirmation from other indicators: IKH signals ko confirm karne ke liye often other indicators ki zaroorat hoti hai.
                  11. Practical Example: Applying IKH in Forex Markets


                  IKH indicator ka practical application samajhne ke liye ek example dekhte hain:

                  Suppose EUR/USD pair mein IKH indicator istemal kiya jaye aur cloud (Kumo) ka analysis kiya jaye. Agar price cloud ke ooper move karta hai aur Tenkan-sen Kijun-sen ko upar se cross karta hai, to yeh long entry signal ho sakta hai. Traders Senkou Span A aur Senkou Span B ke crosses ko bhi dekhte hain future ki price direction ko confirm karne ke liye.
                  12. Tips for Using Ichimoku Kinko Hyo Effectively


                  IKH indicator ko effectively istemal karne ke liye kuch tips hain:
                  • Combine with other technical indicators: IKH signals ko confirm karne ke liye other indicators jaise ki RSI, MACD, ya Fibonacci retracements ka istemal karein.
                  • Practice on demo account first: New strategies aur indicators ko samajhne ke liye demo account par practice karein.
                  • Understand market conditions: Har market ki alag dynamics hoti hain, isliye IKH indicator ke signals ko interpret karte waqt market conditions ka bhi dhyan rakhein.
                  13. Conclusion


                  Ichimoku Kinko Hyo ek powerful aur versatile technical indicator hai jo forex traders ko trend analysis mein madad deta hai. Iske components jaise ki Tenkan-sen, Kijun-sen, Senkou Span A, Senkou Span B aur Chikou Span, traders ko market trends ko samajhne aur entry/exit points tayyar karne mein help karte hain. IKH indicator ke istemal mein proficiency aur experience hone ke baad traders iska full potential realize kar sakte hain aur market movements ko better predict kar sakte hain.

                  Is article mein humne IKH indicator ke mukhtalif aspects ko explore kiya hai aur ummed hai ke yeh information apke trading skills ko improve karne mein madadgar sabit hogi. Forex trading mein safalta ke liye zaroori hai ke traders technical analysis ke saath risk management aur discipline ko bhi maintain karein.
                  • <a href="https://www.instaforex.org/ru/?x=ruforum">InstaForex</a>
                  • #10 Collapse

                    **Ichimoku Kinko Hyo Indicator Forex Trading Mein**
                    Ichimoku Kinko Hyo, jise aam tor par Ichimoku Cloud ke naam se bhi jana jata hai, ek comprehensive technical indicator hai jo forex trading mein market trends aur potential trading signals ko identify karne mein madad karta hai. Yeh indicator Japan ke trader Goichi Hosoda ke dwara develop kiya gaya tha aur isse market ki overall trend aur future price movements ko visualize karna asaan hota hai. Aaj hum Ichimoku Kinko Hyo indicator ke components aur uske role ko forex trading mein detail mein samjhenge.

                    **Ichimoku Kinko Hyo Indicator Kya Hai?**

                    Ichimoku Kinko Hyo indicator chaar main components se mil kar bana hota hai, jo market ke trend, momentum, aur potential reversal points ko identify karte hain. Yeh components hain:

                    1. **Tenkan-sen (Conversion Line)**: Yeh short-term trend ko represent karta hai aur isse short-term market momentum ka pata lagaya jata hai. Yeh line typically 9-period high aur low ke average se calculate ki jati hai.

                    2. **Kijun-sen (Base Line)**: Yeh medium-term trend ko dikhata hai aur long-term momentum ko measure karta hai. Yeh line 26-period high aur low ke average se calculate hoti hai.

                    3. **Senkou Span A (Leading Span A)**: Yeh line future ke 26-period high aur low ke average se calculate hoti hai aur yeh indicator ka ek ahem component hai jo future price action ko predict karne mein madad karta hai.

                    4. **Senkou Span B (Leading Span B)**: Yeh line 52-period high aur low ke average se calculate hoti hai aur yeh bhi future price movements ke potential support aur resistance levels ko dikhati hai.

                    5. **Chikou Span (Lagging Span)**: Yeh line current price ko 26 periods piche se plot karti hai aur market ke trend confirmation ke liye use hoti hai.

                    **Ichimoku Kinko Hyo Ka Role Forex Trading Mein:**

                    1. **Trend Identification**: Ichimoku Cloud market ke overall trend ko identify karne mein madad karta hai. Agar price cloud ke upar trade kar rahi hai, to yeh bullish trend ka indication hai. Agar price cloud ke neeche trade kar rahi hai, to yeh bearish trend ka indication hai.

                    2. **Support Aur Resistance Levels**: Senkou Span A aur Senkou Span B ke beech ka cloud area market ke potential support aur resistance levels ko show karta hai. Yeh levels future price action ke liye important hote hain.

                    3. **Entry Aur Exit Signals**: Trading signals tab generate hote hain jab Tenkan-sen aur Kijun-sen lines cross karti hain. Bullish crossover (Tenkan-sen upar Kijun-sen) buying signal hota hai aur bearish crossover (Tenkan-sen neeche Kijun-sen) selling signal hota hai.

                    4. **Trend Strength Aur Reversal Points**: Chikou Span aur cloud ki positioning market ke trend strength aur potential reversal points ko identify karne mein madad karti hai. Agar Chikou Span price ke upar hai, to yeh bullish trend ko confirm karta hai; agar neeche hai, to bearish trend ko confirm karta hai.

                    **Conclusion:**

                    Ichimoku Kinko Hyo indicator forex trading mein ek powerful tool hai jo trend identification, support aur resistance levels, aur trading signals provide karta hai. Is indicator ke components ko samajh kar aur effectively use karke, traders market ke complex movements ko better analyze kar sakte hain aur informed trading decisions le sakte hain.

                    اب آن لائن

                    Working...
                    X