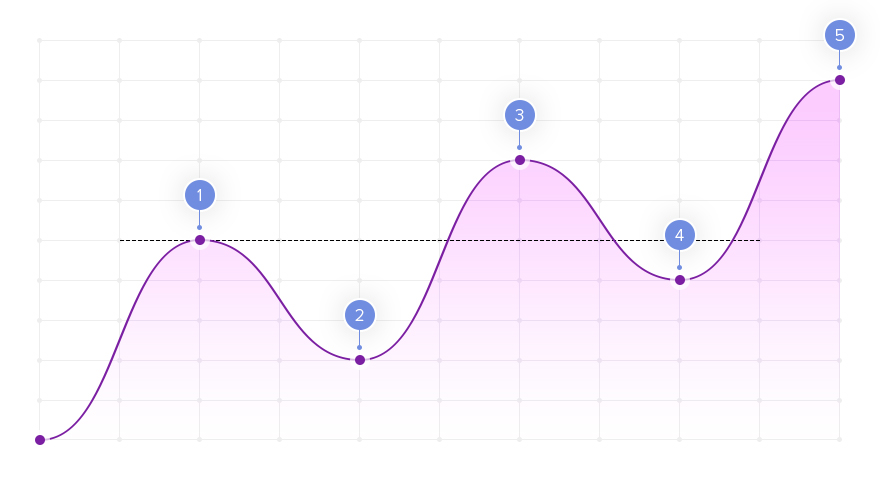
The Elliott wave analysis divides the dominant trend into five waves, with three impulse waves going alongside the major trend and two corrective waves going against it.
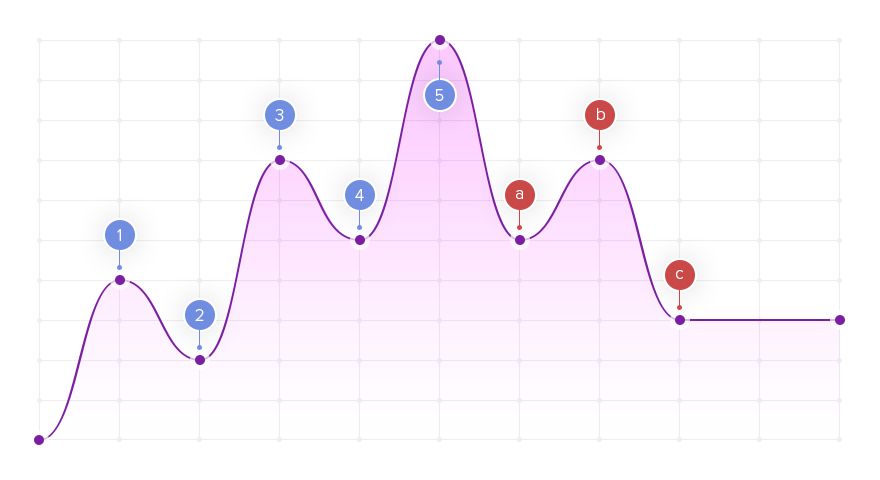
The Elliott wave principle
This wave pattern is enumerated by 1 to 5. Once the pattern is completed, it is followed by a correction that includes two waves alongside the trend and one corrective wave. These three waves are labeled A, B, and C.
Waves
This is the classic theory interpretation. However, currently, there are some updated versions.
Take a look at the EUR/USD price chart. Here you can see a complete Elliott wave pattern. The red line shows main waves of the pattern; while the yellow line indicates smaller parts, which waves consist of.
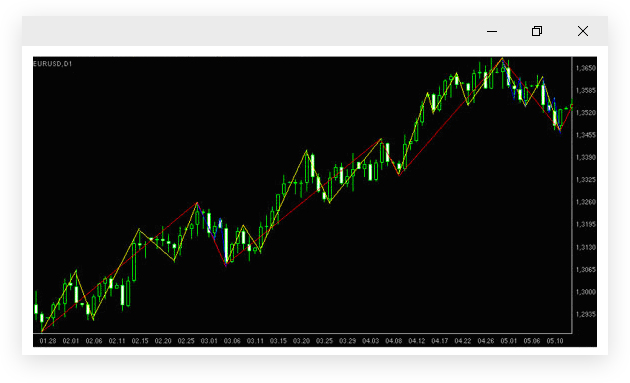
To study the Wave theory basics in detail, we need to analyze each wave separately.
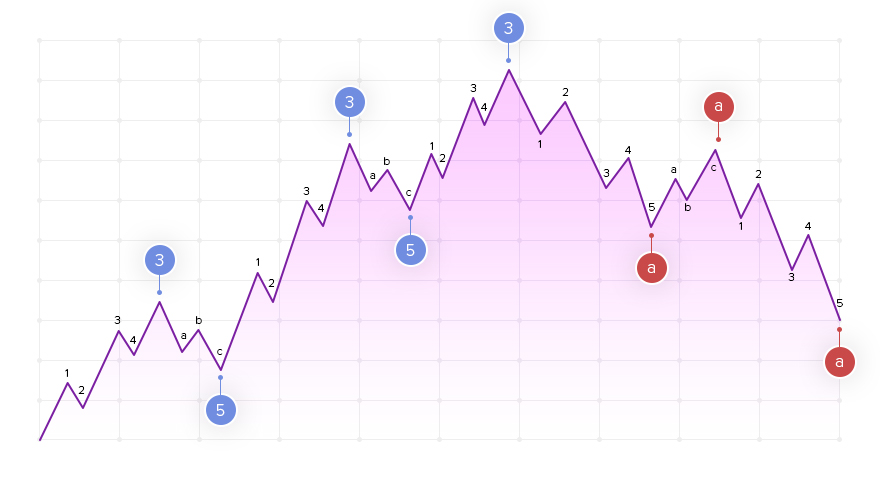
Waves broken down into smaller waves
Wave one starts moving upwards lead by a ‘motive’ from traders willing to buy a currency. It means the price starts rising. Then wave two follows it indicating that the market is full of buyers and the price has grown enough to fix profits. The price edges down but not lower than wave one. Wave three is usually the largest and most powerful. The currency receives the highest attention of investors amid the surging price. The price hits a high level, usually way above wave one. Wave four begins when the price is too high and market participants begin to close their deals. This wave is not as clearly defined as the others because some investors still hope for a further growth. Wave five is the final leg in the direction of the dominant trend. The price is too high and it signals a soon development of the ABC correction.
Once the five-wave pattern is completed, a three-wave corrective pattern begins. It is directed against the major trend. Elliott described twenty-one ABC patterns depending on the situation in the market. But they all can be simplified to three waves.
One type of the correction is called a zigzag correction. It is a sharp correction with impulse waves A and C and corrective wave B, which is usually much shorter than A and C. In the flat correction, the A and B waves are corrective, while the C wave is impulse. The correction is called ‘flat’ because the pattern moves sideways.
Triangles, or more commonly horizontal triangles, are patterns consisting of five corrective sub-waves that travel in a sideways pattern. Horizontal triangles can be classified as symmetrical or contracting (declining top, rising bottom), descending (declining top, flat bottom), ascending (flat top, rising bottom), and expanding (rising top, declining bottom).
The waves can be further broken down into more waves. Elliott categorized the waves according to their relative size (degree): grand supercycle, supercycle, cycle, primary, intermediate, minor, minute, minuette, and subminuette.
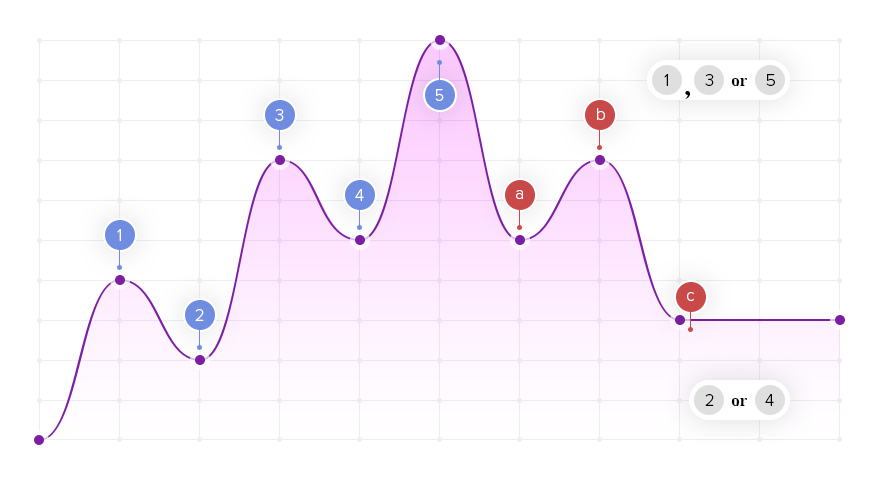
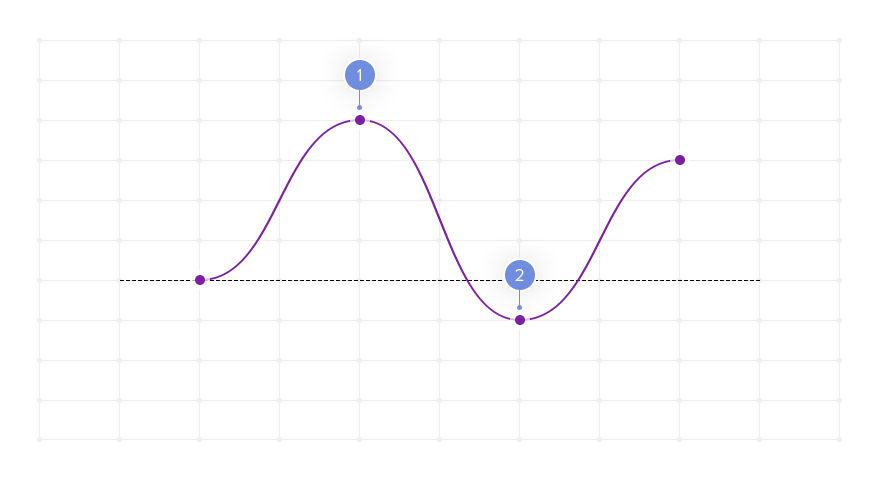
At first sight, the Elliott wave principle seems complicated, but there are three rules that will ease its understanding and ensure correct analysis.
First, wave three cannot be the shortest among other impulse waves (waves 1 and 5). Secondly, wave four does not overlap with the price territory of wave one. And third, wave two never retraces more than 100% of wave one.

Violations of the wave rules
The Elliott wave principle
This wave pattern is enumerated by 1 to 5. Once the pattern is completed, it is followed by a correction that includes two waves alongside the trend and one corrective wave. These three waves are labeled A, B, and C.
Waves
This is the classic theory interpretation. However, currently, there are some updated versions.
Take a look at the EUR/USD price chart. Here you can see a complete Elliott wave pattern. The red line shows main waves of the pattern; while the yellow line indicates smaller parts, which waves consist of.
To study the Wave theory basics in detail, we need to analyze each wave separately.
Waves broken down into smaller waves
Wave one starts moving upwards lead by a ‘motive’ from traders willing to buy a currency. It means the price starts rising. Then wave two follows it indicating that the market is full of buyers and the price has grown enough to fix profits. The price edges down but not lower than wave one. Wave three is usually the largest and most powerful. The currency receives the highest attention of investors amid the surging price. The price hits a high level, usually way above wave one. Wave four begins when the price is too high and market participants begin to close their deals. This wave is not as clearly defined as the others because some investors still hope for a further growth. Wave five is the final leg in the direction of the dominant trend. The price is too high and it signals a soon development of the ABC correction.
Once the five-wave pattern is completed, a three-wave corrective pattern begins. It is directed against the major trend. Elliott described twenty-one ABC patterns depending on the situation in the market. But they all can be simplified to three waves.
One type of the correction is called a zigzag correction. It is a sharp correction with impulse waves A and C and corrective wave B, which is usually much shorter than A and C. In the flat correction, the A and B waves are corrective, while the C wave is impulse. The correction is called ‘flat’ because the pattern moves sideways.
Triangles, or more commonly horizontal triangles, are patterns consisting of five corrective sub-waves that travel in a sideways pattern. Horizontal triangles can be classified as symmetrical or contracting (declining top, rising bottom), descending (declining top, flat bottom), ascending (flat top, rising bottom), and expanding (rising top, declining bottom).
The waves can be further broken down into more waves. Elliott categorized the waves according to their relative size (degree): grand supercycle, supercycle, cycle, primary, intermediate, minor, minute, minuette, and subminuette.
At first sight, the Elliott wave principle seems complicated, but there are three rules that will ease its understanding and ensure correct analysis.
First, wave three cannot be the shortest among other impulse waves (waves 1 and 5). Secondly, wave four does not overlap with the price territory of wave one. And third, wave two never retraces more than 100% of wave one.
Violations of the wave rules
تبصرہ
Расширенный режим Обычный режим