what is technical analysis?
forex market mein technical analysis forex market ke securities ka jaiza laynay ka tareka hotay hein or forx market mein tarekh kay adad o shumar ka jaiza leya ja sakta hy o ye forex market ke movement or forex market kay anay walay trend ka andaza laganay kay ley he estamal keya jata hey forex market mein technical analysis forex market mein analysis karnay kay ley he estamal ho sakta hey yeh forex market kay chart pattern ke time par movement or price par idea laganay kaykam aa saktay hein
forex market kay technical analysis mein core assumption bhe aa sakte hein jo keh forex market ke majodah prices kay tamam dasteyab prices bhe indicate ho jate hein yeh forex market ke chalon ko identify karnay mein bhe madad kar sakte hein prices mein History kay pattern bhe repeat kar dey ja saktay hein yeh reversal points aam tor par zyada demand ya supply walay area bhe ho saktay hein risk management or forex market k hesab lagaay mein bhe madad kar saktay hein
Core Principle of technical analysis
core principle forex market mein technical analysis forex market mein he indicates ho jatay hein stock market mei technical analyis mein basic asol hotay hein fore market ke prices tamam ksam ke malomaat ko kam karte hein forex market ke prices otar charhao ke sorat mein shorka forex market ke shorka ke malomat ke indicate kar sakte hey or yeh forex market kay trend mein montaqel ho he jate hein prices forex market mein kabel e identification repeat ho jate hein
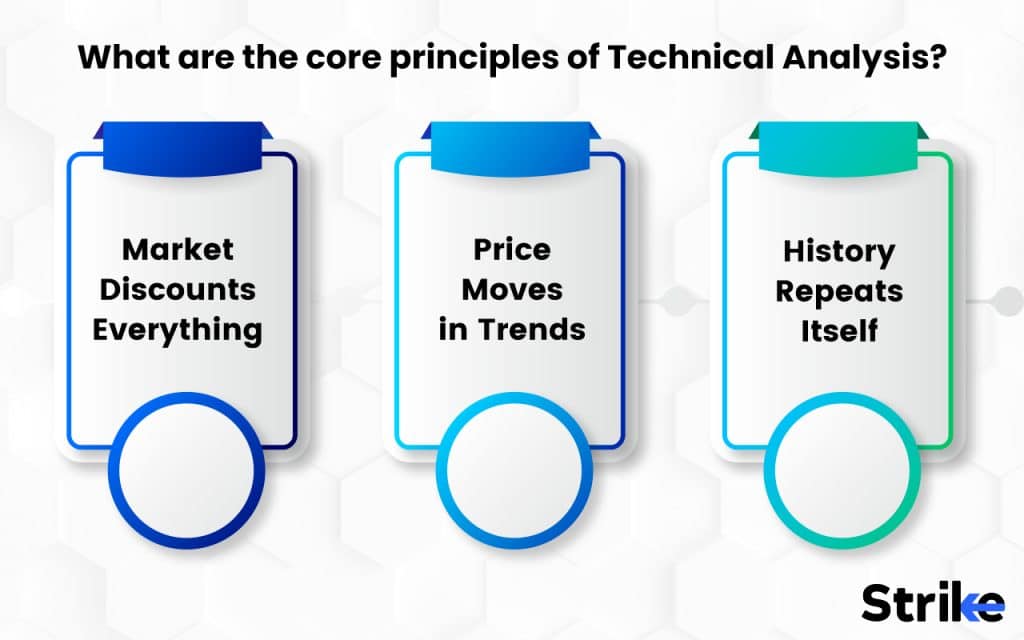
Market Discount Everything
forex market kay technical analysis mein pehla basic asol yeh hota hy keh forex market ko har cheez par choot day de jate hey stock market pehlay say he tamam maloomat frahm kar sakte hey jo keh es keprice ko effect kar sakte hey
yeh forex market kay profit kay amal he ho saktay hein yeh forex market kay insan jazbaat or lalich say bh effect ho saktay hein forex market ko effective mafrozay mein keh deya jata hey forex market mein maloomat kay sath sath anay kay sath he price movement karte rehte hein technical analysis mein basic matric ke base par prices kam kar sakte hein stock market mein anay wale price ka sahi andaza laga sakte hey
technical analysis forex market kay tamam kesam kay period kay sath forex market towajah arkoz kar sakte hy or yeh forex market ke new maloomat forex market kay action ko zahair kar sakte hy forex market mein price ke karkardge es bat ka best indicator hota hey jahan par forex market achay say faida hasell keya ja sakta hey
Technical analysis work
technical analysis forex market mein Down theory es bat par zoor dayte hey keh forex market tamam kesam ke malomaat ko zahair kar sakte hey jes mein forex market kay teen keesam kay trend hotay hein jo keh forex market kay trend or volume ko khatam kar daytay hein forex market kay indicator kay darmean mein confirmation he hote hey jokeh forex market kay pechlay action ko bhe identify kar saktay hein forex market kay peak or reversal janay ko identify kar saktay hein Dow theory kay 6 important jozoo thay o keh ap nechay kay chart mei daikh saktay hein

forex market mein technical analysis forex market ke securities ka jaiza laynay ka tareka hotay hein or forx market mein tarekh kay adad o shumar ka jaiza leya ja sakta hy o ye forex market ke movement or forex market kay anay walay trend ka andaza laganay kay ley he estamal keya jata hey forex market mein technical analysis forex market mein analysis karnay kay ley he estamal ho sakta hey yeh forex market kay chart pattern ke time par movement or price par idea laganay kaykam aa saktay hein
forex market kay technical analysis mein core assumption bhe aa sakte hein jo keh forex market ke majodah prices kay tamam dasteyab prices bhe indicate ho jate hein yeh forex market ke chalon ko identify karnay mein bhe madad kar sakte hein prices mein History kay pattern bhe repeat kar dey ja saktay hein yeh reversal points aam tor par zyada demand ya supply walay area bhe ho saktay hein risk management or forex market k hesab lagaay mein bhe madad kar saktay hein
Core Principle of technical analysis
core principle forex market mein technical analysis forex market mein he indicates ho jatay hein stock market mei technical analyis mein basic asol hotay hein fore market ke prices tamam ksam ke malomaat ko kam karte hein forex market ke prices otar charhao ke sorat mein shorka forex market ke shorka ke malomat ke indicate kar sakte hey or yeh forex market kay trend mein montaqel ho he jate hein prices forex market mein kabel e identification repeat ho jate hein
Market Discount Everything
forex market kay technical analysis mein pehla basic asol yeh hota hy keh forex market ko har cheez par choot day de jate hey stock market pehlay say he tamam maloomat frahm kar sakte hey jo keh es keprice ko effect kar sakte hey
yeh forex market kay profit kay amal he ho saktay hein yeh forex market kay insan jazbaat or lalich say bh effect ho saktay hein forex market ko effective mafrozay mein keh deya jata hey forex market mein maloomat kay sath sath anay kay sath he price movement karte rehte hein technical analysis mein basic matric ke base par prices kam kar sakte hein stock market mein anay wale price ka sahi andaza laga sakte hey
technical analysis forex market kay tamam kesam kay period kay sath forex market towajah arkoz kar sakte hy or yeh forex market ke new maloomat forex market kay action ko zahair kar sakte hy forex market mein price ke karkardge es bat ka best indicator hota hey jahan par forex market achay say faida hasell keya ja sakta hey
Technical analysis work
technical analysis forex market mein Down theory es bat par zoor dayte hey keh forex market tamam kesam ke malomaat ko zahair kar sakte hey jes mein forex market kay teen keesam kay trend hotay hein jo keh forex market kay trend or volume ko khatam kar daytay hein forex market kay indicator kay darmean mein confirmation he hote hey jokeh forex market kay pechlay action ko bhe identify kar saktay hein forex market kay peak or reversal janay ko identify kar saktay hein Dow theory kay 6 important jozoo thay o keh ap nechay kay chart mei daikh saktay hein


تبصرہ
Расширенный режим Обычный режим