Falling Three Candlestick Pattern
X
  • وقت
  • دکھائیں
Clear All
new posts
  • #1 Collapse

    Falling Three Candlestick Pattern
    Asslaam O Alikum.!
    Dear Forex Member Umeed krta hu ap sab loog khariyat sy hungy or enjoy kr rahy hungy apni trading life ko dosto market mein falling three candlestick pattern aik kesam ka trend reversal candlestick pattern hota hey falling three candlestick pattern jare bearish ka trend ka pattern hota hey jo keh nechay kay trend kay nechay zahair ho jata ha forex market mein es kesam kay candlestick pattern mein long black body hote hey yeh forex market mein har aik mokamal tor par pehle candlestick ke aik body hote hey jes mein higher limit hote hey or lower limit hote hey panchwen candlestick aik new lower level bana dayte ha.

    Identification:
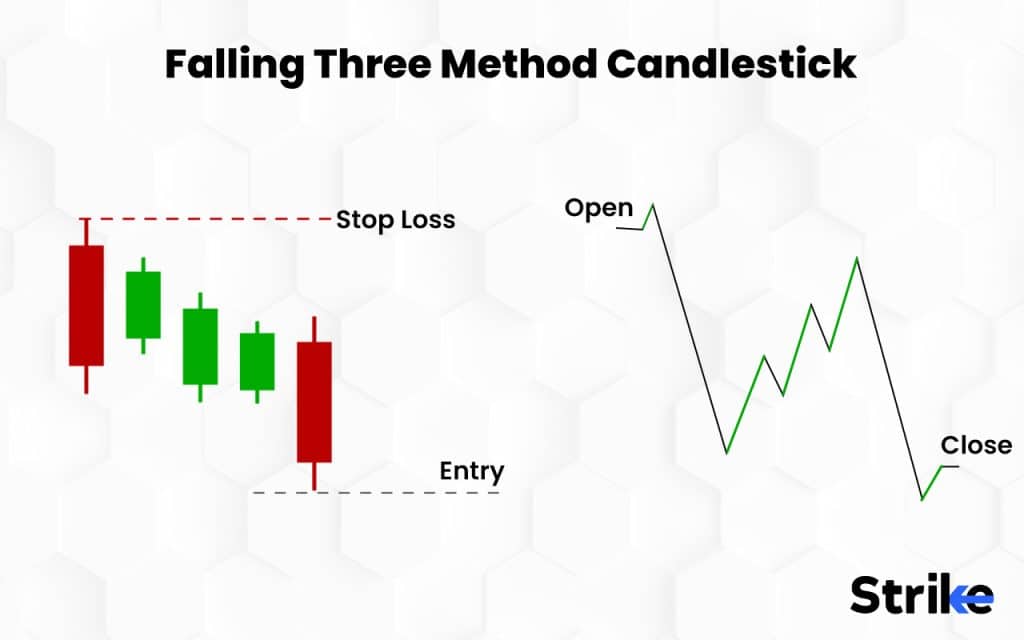
    Dosto market mein falling three candlestick pattern aik kesam ka candlestick pattern hota hey jo keh forex market mein nechay kay trend mein 5 kesam ke series bana sakta hey
    es kesam kay candlestick pattern mein pehle candlestick aik deep kesam ke bearish candlestick banate hey jes ke bare real body hote hey pehle bare candlestick kay bad teen chote white candlestick hote hein chote obharte hove candlestick taiz halkay rang mein hote hein chote candlestick kay sath aik or long black candlestick he hone chihay pattern ko mokamal karnay kay ley akhare candlestick pechle candlestick kay nechay close hone chihay pehle candlestick kay nechay close hone chihi ay.

    Understanding:
    Dosto Q k yeh candlestick pattern aik long black candlestick say start ho jata hy es ley bear bulls say zyada strong ho jatay hein agerchay pehlay candlestick kay ba price aik lamhay kay ley stop ho jate hey pehle candlestick kay inside mein teen kesam ke cchote candlestick ban jate hein jo keh white hote hein forex market mein bulls es kabel nahi hotay hein or pehle long candlestick ke highs kay oper lay kar ja saktay hein or forex market mein bear say agay nekal jatay hein or end mein price dobara nechay ke taraf chale jate hey jo keh pehle cadlestick say nechay close ho jate ha.

    Example:
    Dosto market mein daily kay chart par he dekhaya jata hey keh market mein red rang mein chakar lagya jata hey falling three candlestick pattern ke aik mesal yeh hote hey keh es ka end kay day mein aik long black shadow hota hey or black bare candlestick hote hey or pehle candlestick high low level kay inside mein he hote hey ache tarah say central ke teen candlestick say out ho rehe hote hein end mein pehle candlestick lower hesay mein close ho rehe hote ha.
  • <a href="https://www.instaforex.org/ru/?x=ruforum">InstaForex</a>
  • #2 Collapse

    Forex Mein Falling Three Candlestick Pattern;';';;

    Falling Three Candlestick Pattern ek bearish continuation pattern hai jo forex ya kisi bhi financial market mein chart analysis ke liye use hota hai. Ye pattern indicate karta hai ki downtrend continue hone wala hai.


    Forex Mein Falling Three Candlestick Pattern Ka Structure;';';;

    Is pattern ka structure kuch iss tarah hota hai:
    1. First Candlestick: Ek long bearish candlestick hota hai jo strong selling pressure ko show karta hai.
    2. Middle Three Candlesticks: Teen chhoti bullish candlesticks hoti hain jo usually first candlestick ke range ke andar hi rehti hain. Ye candlesticks temporary upward retracement ko indicate karti hain.
    3. Fifth Candlestick: Ek aur long bearish candlestick hota hai jo pehli candlestick ke close ke neeche close hota hai, isse downtrend ki confirmation hoti hai.
    Forex Mein Falling Three Candlestick Pattern Ke Features;';';;

    Falling Three Candlestick Pattern ke kuch distinct features hain jo isse identify karne mein madad karte hain:
    1. Initial Downtrend:
      • Pattern ek existing downtrend ke baad appear hota hai.
      • Pahli candlestick ek long bearish candlestick hoti hai jo strong selling pressure ko depict karti hai.
    2. Middle Three Candlesticks:
      • Beech mein teen chhoti bullish (ya kabhi kabhi bearish) candlesticks hoti hain.
      • Ye candlesticks pehli candlestick ke range ke andar rehti hain, yani inka high pehli candlestick ke high se neeche hota hai aur low pehli candlestick ke low se upar hota hai.
      • Ye candlesticks temporary upward retracement ko indicate karti hain, lekin inka overall impact bearish trend ko nahi khatam karta.
    3. Final Candlestick:
      • Paanchvi candlestick ek long bearish candlestick hoti hai.
      • Ye candlestick pehli candlestick ke close ke neeche close hoti hai, jo selling pressure ke return ko confirm karti hai.
    4. Volume Confirmation:
      • Pattern ka credibility tab badh jata hai jab volume bhi first aur fifth candlestick ke doraan badhta hai.
      • Beech ki teen candlesticks ka volume comparatively kam hota hai.
    5. Trend Continuation:
      • Ye pattern ek continuation pattern hai, yani ye indicate karta hai ki jo existing downtrend hai, wo pattern ke complete hone ke baad bhi continue rahega.
      • Isse traders ko signal milta hai ki wo apne short positions ko hold karein ya naye short positions open karein.
    6. Psychological Implication:
      • Pattern market psychology ko bhi depict karta hai. Beech ki teen candlesticks ek brief pause ya consolidation phase ko dikhati hain, jahan buyers thoda control lete hain.
      • Lekin overall bearish sentiment dominant rehta hai, jo final bearish candlestick ke through evident hota hai.
    Falling Three Candlestick Pattern ek powerful tool hai technical analysis mein, jo traders ko market sentiment ko samajhne aur unhe informed trading decisions lene mein madad karta ha.
    • #3 Collapse

      what is falling three candlestick pattern

      forex market mein falling three candlestick pattern aik kesam ka bearish trend reversal candlestick pattern hota hey yeh forex market kesam ka technical chart pattern hota hey yeh forx market mein price ke kame kay baray mein signal dayta hey falling three candlestick pattern par nazar dalin gay to pehlay long black candlestick nazar aay ge jes mein tesare or chothe candlestick long body kay sath hote hey yeh aam tor par white bhe ho sakte hey ya black bhe ho sakte hey yeh forex market mein bearish trend ko identify kar sakte hey forex market mein high ya low bearish ke inside candlestick mein he ho sakte hey


      yeh falling three candlestick pattern up side mein gap ko bhe identify kar sakte hein 5 th end wale candlestick aik log red ya black candlestick he ho sakte hey yeh forex market mein nechay kay trend mein mumkana jaree trend ko bhe identify kar sakte hey falling three candlestick pattern say pata chalta hey forex market kay oper ke taraf aik short koshesh kay bawajod forex market kay bear forex market mein phirr say control hasel kar saktay hein yeh forex market kay es pattern mein short market ke taraf movement kar jatay hein


      Faiday Falling Three Candlestick pattern

      Forex market mein falling three candlestick pattern kay bohut he important faiday ho saktay hein yeh forex market mein mumkana nechay ke taraf trend ko jare rakhnay ke taraf eshara kar sakta hey forex market kay es candlestick pattern say pata chalta hey keh forex market kay trader ko majodah bearish kay trend nechay ke taraf eshara karta hey yeh forex market mein bearish ke raftar ko jaree rakh sakte hey trader es kay motabaq apni trading position ko adjust kar saktay hein yeh forex market kay trader ko short position mein mumkana entry point ko identify karna sekha dayta hey or yeh forex trader ko stop loss kay order ko sakhat karnay mein madad kar sakta hey
      forex market mein falling three candlestick pattern ke aik alag kesam ke basree shape ho sakte hey forex kay technical analysis mein bohut he kam analysis rakhnay walay trader es ko identify kar saktay hein forex market trader tak rasai hasel ke ja sakte hey

      Falling three candlestick pattern ke formation

      forex market mein falling three candlestick pattern es kesam kay candlestick pattern mein gernay wale teen kesam ke candlestick shamel hote hein yeh sab say pehlay start mein bearish candlestick say he hota hey jo keh jare ten barhte ho ve candlestick kay bad end mein aik long bearish candlestick banata hey jo keh forex market kay trend mein aik stable kay period ko wazah karta hey forex market mein es candlestick pattern ke identification or confirmation trader ko aik majmoa frahm kar sakta hey yeh asol sahi khatoot kay tor par kam kar sakta hey
      Click image for larger version

Name:	How-Do-Falling-Three-Candlestick-Patterns-Form-1024x640.jpg
Views:	42
Size:	69.6 کلوبائٹ
ID:	12995004
      bhali kay badlay bhali
      • #4 Collapse

        Falling Three Candlestick Pattern:

        Falling Three Candlestick Pattern aik mashhoor aur ahm technical analysis pattern hai jo stock market traders aur investors ke liye intehai ahmiyat rakhta hai. Yeh pattern khas tor par bearish trend ko confirm karne ke liye use hota hai. Is article mein, hum Falling Three Candlestick Pattern ka tafseeli jaiza lengay aur yeh samajhne ki koshish karengay ke yeh pattern kis tarah se kaam karta hai.

        Falling Three Candlestick Pattern Kya Hai?

        Falling Three Candlestick Pattern asal mein paanch candles ka aik sequence hota hai jo market mein bearish trend ko continue karne ka ishara deta hai. Is pattern ko samajhne ke liye, humein pehle candles ki banawat aur unke behavior ko dekhna hoga.

        Pattern Ki Banawat

        1. **First Candle**: Pehli candle lambi bearish (red) hoti hai jo ke strong selling pressure ko darshati hai.
        2. **Second Candle**: Doosri candle choti bullish (green) hoti hai jo pehli candle ke range ke andar close hoti hai.
        3. **Third Candle**: Teesri candle bhi choti bullish (green) hoti hai jo doosri candle ke range ke andar close hoti hai.
        4. **Fourth Candle**: Chauthi candle bhi choti bullish (green) hoti hai jo teesri candle ke range ke andar close hoti hai.
        5. **Fifth Candle**: Aakhri candle lambi bearish (red) hoti hai jo ke pehli candle ke close ke neeche close hoti hai, isse confirm hota hai ke bearish trend wapas aa gaya hai.

        ##### Pattern Ki Tashreeh

        Is pattern ka matlab yeh hota hai ke market mein temporary bullish trend ke baad bearish trend wapas se dominate kar raha hai. Pehli lambi bearish candle ke baad, teesri choti bullish candles yeh darshati hain ke buyers kaafi mazboot nahi hain aur market ka trend wapas se bearish ho raha hai. Aakhri lambi bearish candle is trend ko confirm karti hai.

        #### Trading Strategy

        Falling Three Candlestick Pattern ko dekh kar traders aksar short sell positions lete hain. Yani jab yeh pattern ban jata hai, to yeh signal hota hai ke market girne wala hai aur yahan par short sell karke profit hasil kiya ja sakta hai.

        Entry Point

        - Jab aakhri lambi bearish candle ban rahi hoti hai aur pehli candle ke close ke neeche close hoti hai, to yeh entry ka point hota hai.

        Stop Loss

        - Stop loss ko teesri bullish candle ke high par set kiya ja sakta hai taake risk ko manage kiya ja sake.

        Target

        - Target ko pehli bearish candle ke range ke barabar ya us se zyada set kiya ja sakta hai.

        Conclusion

        Falling Three Candlestick Pattern aik reliable bearish continuation pattern hai jo stock market mein trading decisions ko improve karne mein madadgar sabit hota hai. Is pattern ko samajh kar aur is ke mutabiq trading strategies ko implement karke traders significant profits hasil kar sakte hain. Technical analysis mein is tarah ke patterns ka jaiza lena aur unhe sahi waqt par pehchanna, trading success ke liye intehai ahmiyat rakhta hai.

        Trading mein risk management bohot zaroori hai, is liye har trade se pehle apna analysis zaroor karein aur market conditions ko madde nazar rakhein.
        • #5 Collapse

          Forex Main "Falling Three Candlestick Pattern"

          Forex trading main candlestick patterns bohat important hote hain kyun ke yeh traders ko market sentiment aur price movements ko samajhne main madad karte hain. Aik ahem candlestick pattern jo bearish continuation ko indicate karta hai wo hai "Falling Three Candlestick Pattern."

          Falling Three Candlestick Pattern Kya Hai?

          Falling Three Candlestick Pattern aik bearish continuation pattern hai jo trend ke continuation ko indicate karta hai. Yeh pattern five candlesticks pe based hota hai aur yeh dikhata hai ke market temporary bullish correction ke baad phir se downward trend ko resume kar raha hai.
          Click image for larger version

Name:	images (1).png
Views:	17
Size:	3.2 کلوبائٹ
ID:	12995094
          Falling Three Candlestick Pattern Ki Structure

          Falling Three Candlestick Pattern ki structure kuch is tarah hoti hai

          First Candlestick
          Yeh aik long bearish candlestick hoti hai jo current downtrend ko continue karti hai.

          Second, Third, aur Fourth Candlesticks
          Yeh teen choti bullish candlesticks hoti hain jo ek upward correction ko indicate karti hain. In candlesticks ka high pehla bearish candlestick ke high se neeche hota hai.

          Fifth Candlestick
          Yeh aik long bearish candlestick hoti hai jo pehla bearish candlestick ke closing price se neeche close karti hai, is se downtrend ko confirm hota hai.


          Falling Three Candlestick Pattern Ka Use

          Falling Three Candlestick Pattern ka use kai tarikon se kiya jata hai

          Trend Continuation Confirmation
          Yeh pattern bearish trend ke continuation ko confirm karta hai. Jab yeh pattern form hota hai, to yeh signal hota hai ke market temporary bullish correction ke baad phir se downward trend ko continue kar raha hai.

          Entry aur Exit Points
          Is pattern ko use karke traders apne entry aur exit points ko determine kar sakte hain. Jab fifth bearish candlestick form hoti hai, to yeh selling signal hota hai aur traders apne short positions enter kar sakte hain.

          Risk Management
          Is pattern ko use karke traders apne stop-loss levels ko bhi set kar sakte hain. Pehli bearish candlestick ke high ko stop-loss level ke tor pe use kiya ja sakta hai taake risk ko manage kiya ja sake.

          Falling Three Candlestick Pattern Ki Interpretation

          Is pattern ko samajhne ke liye kuch examples dekhte hain

          Confirming Downtrend

          Agar EUR/USD pair main Falling Three Candlestick Pattern form hota hai aur fifth bearish candlestick pehla bearish candlestick ke closing price se neeche close karti hai, to yeh strong bearish signal hota hai. Is point pe traders short positions enter kar sakte hain.

          False Signal Avoidance

          Kabhi kabhi market main choppy conditions ke wajah se false signals bhi milte hain. Agar second, third, aur fourth bullish candlesticks zyada strong hon aur fifth bearish candlestick pehla bearish candlestick ke closing price se neeche close na kare, to yeh false signal ho sakta hai. Is liye hamesha pattern ko confirm karna zaroori hota hai.

          Falling Three Candlestick Pattern Ki Limitations

          Jahan yeh pattern bohat useful hota hai, wahan kuch limitations bhi hoti hain

          Confirmation Required
          Is pattern ko confirm karna zaroori hota hai. Doosre technical indicators aur patterns ko use karke confirmation lena important hota hai.

          Market Conditions
          Choppy aur sideways market conditions main yeh pattern effective nahi hota. Yeh pattern trending markets main zyada effectively kaam karta hai.

          False Signals
          Kabhi kabhi yeh pattern false signals bhi de sakta hai, is liye doosre indicators ke sath use karna better hota hai.

          Falling Three Candlestick Pattern Ka Combination with Other Indicators

          Is pattern ko doosre technical indicators ke sath combine karke use karna trading decisions ko aur accurate bana sakta hai

          Moving Averages
          Moving Averages ko use karke trend ko identify karna aur Falling Three Pattern ko confirm karna asaan hota hai.

          RSI (Relative Strength Index)
          RSI ko use karke overbought aur oversold conditions ko check kar sakte hain aur pattern ko aur effectively use kar sakte hain.

          MACD (Moving Average Convergence Divergence)
          MACD ko use karke trend strength aur momentum ko check kar sakte hain taake pattern ko confirm kar sakein.

          Practical Example

          Ek practical example dekhte hain taake Falling Three Candlestick Pattern ko achi tarah samajh sakein

          Agar GBP/USD pair main pehla long bearish candlestick form hota hai aur us ke baad teen choti bullish candlesticks form hoti hain, aur phir fifth long bearish candlestick form hoti hai jo pehla bearish candlestick ke closing price se neeche close karti hai, to yeh Falling Three Candlestick Pattern ko indicate karta hai. Is point pe, agar Moving Averages bhi downtrend ko confirm karte hain, to yeh strong selling signal hai aur traders short positions enter kar sakte hain.


          Note
          Falling Three Candlestick Pattern Forex trading main ek valuable tool hai jo traders ko market trends aur price movements ko samajhne main madad karta hai. Is pattern ko samajhne aur use karne se traders apni trading strategies ko improve kar sakte hain aur zyada informed decisions le sakte hain. Lekin hamesha yaad rakhen ke is pattern ko doosre technical indicators ke sath combine karke use karna chahiye taake zyada accurate signals mil sakein aur trading risk manage ho sake.
          • #6 Collapse

            Falling Three Candlestick Pattern: Ek Trading Pattern Ka Tafseeli Mutala"

            Introduction:

            Falling Three Candlestick Pattern ek technical analysis ka hissa hai jo forex aur stock markets mein istemal hota hai. Ye pattern trader ko market ki direction aur price movement ke baray mein maloomat faraham karta hai. Is article mein, hum Falling Three Candlestick Pattern ke tafseelat ko Roman Urdu mein samjheinge.

            1. Candlestick Patterns ki Ahmiyat:

            Candlestick patterns trading mein ahmiyat rakhti hain kyun ke ye traders ko price action aur market psychology ke baray mein maloomat faraham karte hain. Ye patterns charts par banay jate hain jab traders price ke movements ko analyze karte hain.

            Click image for larger version

Name:	images (3).jpeg
Views:	17
Size:	12.2 کلوبائٹ
ID:	12995194

            2. Falling Three Candlestick Pattern:

            Falling Three Candlestick Pattern mein teeno candles ko dekha jata hai jo bearish trend ke indication deti hain. Ye pattern typically uptrend ke doran develop hota hai aur bearish reversal ka indication deta hai.

            3. Pehele Candle:

            Pehele candle ek lambi bullish candle hoti hai jo uptrend ko show karti hai. Is candle ki body bari hoti hai aur upper shadow nahi hoti.

            4. Doosre Candle:

            Doosri candle pehli candle ke upar se guzarti hai aur bearish hai. Is candle ki body pehli candle ki body ke andar hoti hai. Ye candle typically small body aur upper aur lower shadows ke sath hoti hai.

            5. Teesri Candle:

            Teesri candle doosri candle ke neeche se start hoti hai aur bearish hai. Is candle ki body doosri candle ki body ke andar hoti hai. Ye candle bhi typically small body aur upper aur lower shadows ke sath hoti hai.

            Click image for larger version

Name:	images (1).png
Views:	14
Size:	9.1 کلوبائٹ
ID:	12995195

            6. Interpretation:

            Falling Three Candlestick Pattern ka interpretation yeh hota hai ke market mein bullish trend weak ho raha hai aur bearish trend start ho sakta hai. Traders is pattern ko dekhte hue short positions enter karte hain.

            7. Stop Loss aur Take Profit:

            Is pattern ke istemal mein traders apne stop loss aur take profit levels ko set karte hain taki loss ko minimize aur profit ko maximize kiya ja sake.

            8. Example:

            Ek example ke tor par, agar ek uptrend mein Falling Three Candlestick Pattern ban raha hai, to traders ko short positions enter karne ka mauka milta hai. Stop loss upper candle ke high ke just above aur take profit lower candle ke low ke just below set kiya ja sakta hai.

            9. Risk Management:

            Har trading strategy mein risk management ka bohot ahmiyat hota hai. Falling Three Candlestick Pattern ka istemal karte hue traders apne risk ko manage karte hain taki losses ko control kiya ja sake.

            10. Conclusion:

            Falling Three Candlestick Pattern ek powerful bearish reversal pattern hai jo traders ko market ke direction ke baray mein maloomat faraham karta hai. Is pattern ka istemal kar ke traders apne trading strategies ko improve kar sakte hain aur profits ko maximize kar sakte hain.
            • #7 Collapse

              Forex Trading Mein Girte Hue Teen Mombattiyon Ka Tareeqa

              Forex trading mein kai tarah ke technical analysis tools istemal kiye jate hain taake traders ko behtar trading decisions lenay mein madad milti hai. Candlestick patterns bhi in tools mein se ek hai jo traders ke liye ahem hain. Aaj hum Falling Three Candlestick Pattern ke bare mein baat karenge, jo forex trading mein ek ahem pattern hai.

              1. Candlestick Patterns Ki Ahmiyat

              Candlestick patterns ka istemal price action analysis mein hota hai, jo traders ko market ke moods aur future price movements ka andaza lagane mein madad karte hain. In patterns ko samajhna traders ke liye zaroori hai taake wo market trends ko samajh sake aur profitable trades kar sake.

              2. Falling Three Candlestick Pattern Kya Hai?

              Falling Three Candlestick Pattern bearish reversal pattern hai, jo downtrend ke doran develop hota hai. Is pattern mein teen bearish candles ek specific sequence mein appear hote hain. Ye pattern bullish trend ke khatam hone ki possibility ko indicate karta hai aur bearish trend ka shuruaat hota hai.

              3. Pattern Ki Shuruaat

              Falling Three Candlestick Pattern ki shuruaat ek lambi bearish candle se hoti hai jo downtrend mein hoti hai. Ye candle existing downtrend ko indicate karta hai.

              4. Dusri Candle

              Doosri candle, pehli candle ke upper open hoti hai aur small body ke sath close hoti hai. Ye candle bearish trend mein halki recovery ko represent karta hai.

              5. Teesri Candle

              Teesri candle doosri candle ki body ke andar close hoti hai, lekin doosri candle ki high se upper close nahi hoti. Ye candle bullish sentiment ka indication deta hai, lekin overall downtrend ko continue karne ki possibility bhi hai.

              6. Is Pattern Ka Interpretation

              Falling Three Candlestick Pattern indicate karta hai ke current downtrend weak ho sakta hai aur bullish reversal hone ke chances hote hain. Ye pattern bearish trend ki exhaustion ko show karta hai.

              7. Pattern Ki Validity

              Pattern ki validity ke liye important hai ke teesri candle pehli candle ki body ke andar close ho. Agar teesri candle pehli candle ke body ke bahar close hoti hai, to pattern invalid ho jata hai.

              8. Stop Loss Aur Target

              Is pattern ko trade karte waqt stop loss ko teesri candle ki high ke just above set kiya jata hai aur target ko next support level par set kiya jata hai. Stop loss ko set karne ka maqsad excessive loss se bachna hai.

              9. Falling Three Candlestick Pattern Ki Misal

              Ek example samajhne ke liye, agar pehli candle ka size bara hai aur doosri candle ki body choti hai aur teesri candle doosri candle ki body ke andar close hoti hai, to ye Falling Three Candlestick Pattern ho sakta hai.

              10. Pattern Ka Importance

              Falling Three Candlestick Pattern bearish trend ke reversal ka indication deta hai, is liye ise traders ko seriously lena chahiye. Ye pattern market sentiment ko represent karta hai aur reversal points ko identify karne mein madad karta hai.

              11. Trading Mein Iska Istemal

              Is pattern ko confirm karne ke liye, traders ko dusri technical indicators ka bhi istemal karna chahiye. Is pattern ko confirm karne ke liye volume analysis aur other indicators ka istemal kiya ja sakta hai.

              12. Confirmation Indicators

              MACD, RSI, aur moving averages jese indicators Falling Three Candlestick Pattern ko confirm karne mein madadgar hote hain. In indicators ki madad se traders ko pattern ki authenticity ko verify karne mein madad milti hai.

              13. Pattern Ki Reliability

              Pattern ki reliability ko improve karne ke liye, ise higher timeframes par confirm karna behtar hota hai. Higher timeframes par pattern ki confirmation hone par, uska reliability badh jata hai.

              14. Risk Management

              Har trade mein risk management ka khayal rakhna zaroori hai taake nuksan se bacha ja sake. Stop loss aur proper position sizing ka istemal karke traders apne risk ko manage kar sakte hain.

              15. Demo Trading

              Naye traders ko ye pattern samajhne ke liye demo trading account ka istemal karna chahiye. Demo trading account mein traders real market conditions ke under trading karke pattern ko samajh sakte hain bina real money risk kiye.

              16. Psychological Aspect

              Trading mein psychological aspect ka bhi bohot bara role hota hai. Traders ko patience aur discipline maintain karna chahiye. Emotions controlled rakhna bhi trading success mein ahem hai.

              17. Pattern Ki Limitations

              Har pattern ki tarah, Falling Three Candlestick Pattern bhi 100% accurate nahi hota aur false signals bhi generate kar sakta hai. Isliye, traders ko sirf is pattern par depend nahi karna chahiye, balki dusre factors ko bhi consider karna chahiye.

              18. Learning Aur Practice

              Pattern ko samajhne aur uska istemal karne ke liye consistent learning aur practice zaroori hai. Traders ko regular market analysis karna chahiye aur apne trading skills ko improve karne ke liye efforts dalne chahiye.

              19. Conclusion

              Falling Three Candlestick Pattern forex trading mein ek powerful tool hai jo bearish trend ke reversal ko indicate karta hai. Is pattern ko samajhna aur uska sahi istemal karna traders ke liye zaroori hai. Lekin, har pattern ki tarah, iski limitations aur false signals ka bhi dhyan rakha jana chahiye.

              Forex trading mein successful hone ke liye, traders ko technical analysis ke saath-saath risk management aur emotional control par bhi focus karna chahiye. Regular practice aur learning se traders apne skills ko improve kar sakte hain aur profitable trades kar sakte hain


              20. Candlestick Patterns Ki Depth

              Candlestick patterns ka study karna ek naye trader ke liye initially overwhelming ho sakta hai. Har pattern ki alag alag characteristics hoti hain aur unka interpretation bhi alag hota hai. Falling Three Candlestick Pattern ko samajhne ke liye, traders ko in teen candles ke specific characteristics par dhyan dena chahiye.

              21. Downtrend Mein Falling Three Candlestick Pattern

              Falling Three Candlestick Pattern, downtrend ke doran jyadatar develop hota hai, lekin ye kabhi-kabhi sideways market mein bhi develop ho sakta hai. Is pattern ki pehli candle bearish trend ko represent karti hai aur doosri candle mein thodi si recovery hoti hai, lekin teesri candle mein downtrend continue hota hai.

              22. Trading Strategy Development

              Falling Three Candlestick Pattern ko trading strategy mein incorporate karne ke liye traders ko is pattern ke saath confirmation ka wait karna chahiye. Is pattern ke saath additional technical indicators ka istemal karke entry aur exit points ko identify kiya ja sakta hai.

              23. Pattern Recognition Skills

              Candlestick patterns ko recognize karna traders ke liye ek important skill hai. Iske liye regular practice aur market observation zaroori hai. Traders ko patterns ke formation aur unki implications ko samajhne ke liye time dena chahiye.

              24. Real-Life Examples

              Falling Three Candlestick Pattern ke real-life examples ko analyze karke traders apni analysis ko improve kar sakte hain. Historical price charts par pattern ki identification aur uske outcome ko study karke traders future trades ke liye better prepare ho sakte hain.

              25. Backtesting

              Falling Three Candlestick Pattern ko backtesting karke traders apne trading strategies ko validate kar sakte hain. Historical data par pattern ki occurrences ko analyze karke traders apne trading rules ko refine kar sakte hain.

              26. Pattern Variations

              Har pattern ke alag-alag variations hote hain jo market conditions aur price action ke anusaar change ho sakte hain. Traders ko Falling Three Candlestick Pattern ke variations ko bhi samajhna chahiye taake wo false signals ko identify kar sake.

              27. Market Context

              Falling Three Candlestick Pattern ko samajhne ke liye market context ka bhi dhyan dena zaroori hai. Market sentiment, trend strength, aur other factors ko consider karke traders ko pattern ko interpret karna chahiye.

              28. Risk-Reward Ratio

              Har trade mein risk-reward ratio ka dhyan rakhna zaroori hai. Falling Three Candlestick Pattern ke trade ko execute karne se pehle, traders ko potential profit aur loss ko evaluate karna chahiye.

              29. Market Volatility

              Market volatility ka bhi pattern par impact hota hai. Jyada volatile market mein pattern ki reliability kam ho sakti hai, isliye traders ko is factor ko bhi dhyan mein rakhna chahiye.

              30. Pattern Failures

              Kisi bhi pattern ka 100% success hone ka guarantee nahi hota. Falling Three Candlestick Pattern bhi kabhi-kabhi fail ho sakta hai, isliye traders ko always ready rehna chahiye apne trades ko monitor karne ke liye.

              31. Pattern Analysis Tools

              Pattern analysis ke liye traders ke paas kai tools hote hain. Charting software, pattern recognition indicators, aur other technical analysis tools traders ko patterns ko identify aur analyze karne mein madad karte hain.

              32. Pattern Recognition Software

              Pattern recognition software bhi traders ke liye helpful ho sakti hai, especially un traders ke liye jo manually patterns ko identify karna mushkil samajhte hain. Ye software automatic patterns ko detect karke traders ko alert karte hain.

              33. Pattern Trading Strategies

              Falling Three Candlestick Pattern ko trading strategies mein integrate karne ke liye, traders ko apne risk management plan ko optimize karna chahiye. Agar pattern ke saath confirmatory signals bhi hain, to traders confident hokar trade kar sakte hain.

              34. Market Sentiment Analysis

              Market sentiment analysis bhi Falling Three Candlestick Pattern ke liye important hai. Agar overall market sentiment bearish hai, to pattern ka reversal potential zyada hota hai.

              35. News Events Ka Impact

              Important news events ka bhi pattern par impact hota hai. Traders ko economic calendar ke events ko monitor karna chahiye taake wo pattern ke formation ke waqt aware rahein.

              36. Pattern Ko Samajhna

              Pattern ko samajhna aur uska sahi istemal karne ke liye patience aur dedication ki zaroorat hoti hai. Traders ko pattern ko observe karne aur uski implications ko samajhne mein time dena chahiye.

              37. Pattern Ki Frequency

              Har market mein pattern ki frequency alag hoti hai. Kuch markets mein ye pattern zyada frequently develop hota hai jabki kuch markets mein kam hota hai.

              38. Professional Guidance

              Agar traders ko pattern analysis samajhne mein mushkil hoti hai, to woh professional guidance seekh sakte hain. Trading mentors, online courses, aur communities se traders ko support mil sakta hai.

              39. Trading Journal

              Apne trades ko track karne ke liye trading journal maintain karna bhi zaroori hai. Isse traders apne performance ko evaluate kar sakte hain aur mistakes ko identify karke improve kar sakte hain.

              40. Conclusion

              Falling Three Candlestick Pattern forex trading mein ek important tool hai jo bearish trend ke reversal ko indicate karta hai. Is pattern ko samajhne aur uska sahi istemal karne ke liye traders ko patience, practice aur consistent learning ki zaroorat hoti hai. Pattern analysis ke saath-saath, risk management aur market analysis bhi traders ke liye crucial factors hain jo unhe successful trading mein madad karte hain.
              • #8 Collapse

                Forex Trading Mein Falling Three Candlestick Pattern

                Forex trading mein candlestick patterns ka istemal karna aam taur par traders ke liye ek zaroori tajziya ka hissa hai. In patterns mein se ek jo khas tor par dehan diya jata hai wo hai "Falling Three Candlestick Pattern". Ye pattern traders ko market ki movement ko samajhne aur trading decisions mein madad dene ke liye istemal hota hai. Is article mein hum Falling Three Candlestick Pattern ki mukhtasar tafseelat aur iske istemal ke tareeqay par ghaur karenge.
                1. Candlestick Patterns ki Ahmiyat


                Candlestick patterns forex trading mein price action analysis ka ek ahem hissa hain. Ye patterns price charts par candles ki shapes aur formations ke zariye price movements ko interpret karne mein madad dete hain. Har ek candlestick apni body (range between open and close), shadows (high and low), aur closing price ke through market sentiment aur price action ka ek snapshot provide karta hai.

                Candlestick patterns ki pehchan karna traders ke liye zaroori hai kyunki ye unhe market dynamics ko samajhne aur future price movements ke liye anticipate karne mein help karte hain. Bullish, bearish aur trend reversal patterns traders ko different market scenarios ko identify karne mein madad karte hain, jaise ki trend continuation ya trend reversal.
                2. Falling Three Candlestick Pattern Ki Tashreeh


                Falling Three Candlestick Pattern ek bearish continuation pattern hai jo typically downtrend ke dauran paida hota hai. Is pattern mein ek choti green candlestick (up candle) followed by three long red candlesticks (down candles) hote hain. Up candle bullish momentum ki shuruat hoti hai lekin iske baad aane wale three red candles downtrend ki continuation ko indicate karte hain.

                Up Candle: Pattern ki shuruaat ek choti green candlestick se hoti hai jo uptrend ke baad dikhai deta hai. Is up candle ki body choti hoti hai aur uska close up candle ki upper half mein hota hai, indicating initial bullish momentum.

                First Red Candle: Up candle ke baad ek lamba red candlestick aata hai jo up candle ki high tak ya usse ooper tak pohanch sakta hai. Is red candlestick ki body lambi hoti hai aur closing price up candle ki body ke ooper hoti hai, indicating increased selling pressure and potential reversal.

                Second Red Candle: Dusra red candlestick pehle ke red candlestick ke neeche close hota hai aur iski body bari hoti hai jo bearish pressure ko darshata hai. Is candle ki length aur closing price ki tafseel se traders ko ye pata chalta hai ke bearish move kitni strong hai aur downtrend ko confirm karne ke liye iske baad hone wale price action ko monitor karna zaroori hota hai.

                Third Red Candle: Teesra red candlestick bhi pehle do candlesticks ke neeche close hota hai aur iski body bhi bari hoti hai, jisse downtrend ki continuation ki taseer hoti hai. Is candle ki tafseel se traders ko ye confirm ho jata hai ke bearish momentum strong hai aur downtrend jari hai. Volume ki bhi analysis is stage par important hoti hai taki traders ko ye pata chale ke market sentiment bearish hai aur further downside possible hai.
                3. Pattern Ki Shuruaat


                Pattern ki shuruaat ek choti green candlestick se hoti hai jo ek uptrend ke baad dikhai deta hai. Is candle ko "up candle" bhi kaha jata hai. Up candle bullish momentum ki shuruat hoti hai lekin iske baad aane wale three red candles downtrend ki continuation ko indicate karte hain. Har ek candlestick ki size, closing position, aur volume ki tafseel se traders ko ye pata chalta hai ke market sentiment aur trend direction kya hai.
                4. Pehla Red Candlestick


                Up candle ke baad ek lamba red candlestick aata hai jo up candle ki high tak ya usse ooper tak pohanch sakta hai. Is red candlestick ki body lambi hoti hai aur closing price up candle ki body ke ooper hoti hai, indicating increased selling pressure and potential reversal. Agar is candle ki high up candle ki high se bhi ooper jaati hai aur volume bhi badhta hai, to ye ek strong bearish signal ho sakta hai.
                5. Dusra Red Candlestick


                Dusra red candlestick pehle ke red candlestick ke neeche close hota hai aur iski body bari hoti hai jo bearish pressure ko darshata hai. Is candle ki tafseel se traders ko ye pata chalta hai ke bearish move kitni strong hai aur downtrend ko confirm karne ke liye iske baad hone wale price action ko monitor karna zaroori hota hai. Dusra red candlestick pattern ka integral part hota hai jo ki bearish sentiment aur downtrend ko further validate karta hai.
                6. Teesra Red Candlestick


                Teeno candlesticks mein se teesra red candlestick bhi pehle do candlesticks ke neeche close hota hai aur iski body bhi bari hoti hai, jisse downtrend ki continuation ki taseer hoti hai. Is candle ki tafseel se traders ko ye confirm ho jata hai ke bearish momentum strong hai aur downtrend jari hai. Volume ki bhi analysis is stage par important hoti hai taki traders ko ye pata chale ke market sentiment bearish hai aur further downside possible hai. Teesra red candlestick pattern mein volume ki bhi tafseel dekhni chahiye jisse ke downtrend ke continuation mein confidence aa sake.
                7. Volume ki Tafseel


                Falling Three Candlestick Pattern ke sath trading karne se pehle volume ki bhi tafseel dekhni chahiye. Agar volume down candles ke sath increase ho raha hai, to yeh pattern aur bhi mazboot ho jata hai. Volume ki tafseel se traders ko ye pata chalta hai ke bearish move mein kitna participation hai aur market sentiment ke bare mein clear picture milti hai. High volume bearish candles downtrend ko confirm karte hain jabki low volume bearish candles weak selling pressure indicate karte hain. Volume analysis bearish continuation pattern ko validate karne mein important role play karta hai.
                8. Technical Indicators ka Istemal


                Pattern ko confirm karne ke liye technical indicators jaise ki RSI (Relative Strength Index), MACD (Moving Average Convergence Divergence), aur moving averages istemal kiye ja sakte hain jo bearish momentum ko confirm karte hain. RSI oversold zone mein hona ya MACD histogram mein negative divergence dekhna is pattern ko validate karne mein madadgar sabit ho sakta hai. Moving averages ki crossover bhi downtrend ke confirmation ke liye ek signal provide karte hain. Technical indicators ki tafseel se traders ko ye confirm ho jata hai ke pattern ke signals strong hain aur trading entry ke liye suitable conditions hain.
                9. Stop Loss aur Target Levels


                Falling Three Candlestick Pattern ke trade mein stop loss aur target levels ko set karna zaroori hai. Stop loss up candle ki high ke ooper aur target levels downtrend ke hisab se set kiye ja sakte hain. Risk management ki tafseel se traders ko ye pata chal jata hai ke kitna risk lena safe hai aur kitna profit realistic hai. Stop loss ko strategy ke mutabiq adjust karna aur profit booking ke liye trailing stop use karna traders ki success mein madadgar sabit hota hai. Stop loss aur target levels ki setting pattern ke volatility aur market conditions ke mutabiq customize ki jaati hai taki trading position ko optimize kiya ja sake.
                10. Real-time Examples


                Is article mein real-time examples aur charts ka istemal kiya gaya hai taaki readers ko pattern ko samajhne mein madad mil sake. Real-time examples se traders ko practical knowledge milti hai ke kaise Falling Three Candlestick Pattern market mein dikhai deta hai aur iske trading implications kya hote hain. Charts ki tafseel se price action analysis ko samajhna aur pattern recognition ko improve karna traders ke liye zaroori hota hai. Historical charts aur recent market data ke through pattern ke effectiveness aur accuracy ko analyze kiya jata hai taki traders ko future mein better decision making capability mile.
                11. Pattern ki Mukhtasar Taaruf


                Falling Three Candlestick Pattern ko mukhtasar taur par summarise karte hue, yeh ek bearish continuation pattern hai jo downtrend ke dauran up candles ke baad dikhai deta hai. Is pattern ki tafseel se traders ko bearish momentum aur downtrend ke continuation ko samajhne mein madad milti hai. Pattern ki recognition aur correct interpretation market analysis mein key role play karte hain. Falling Three Candlestick Pattern ki detail analysis se traders ko ye pata chalta hai ke kaise iska istemal karke consistent profits earn kiya ja sakta hai.
                12. Conclusion


                Falling Three Candlestick Pattern forex traders ke liye ek powerful tool hai jo market trends ko samajhne aur trading decisions mein madad dene mein istemal hota hai. Is pattern ki tafseelat ko samajhne ke baad traders apni strategies ko refine kar sakte hain aur market ki movements ko better predict karne mein saksham ho sakte hain. Candlestick patterns ka istemal karke traders apne trading approach ko refine kar sakte hain aur consistent profits earn karne mein successful ho sakte hain. Pattern ki accuracy aur effectiveness ko enhance karne ke liye regular practice aur market observation zaroori hai.
                13. Final Words


                Is article mein humne Falling Three Candlestick Pattern ke bare mein mukhtasar tafseelat aur iske istemal ke tareeqay par roshni daali. Traders ko is pattern ki understanding ke saath market mein confident hone aur trading strategy ko improve karne mein madad milegi. Candlestick patterns ka istemal karke traders apne trading skills ko enhance kar sakte hain aur market dynamics ko samajhne mein proficient ho sakte hain. Falling Three Candlestick Pattern ki thorough analysis se traders ko market ki complexities aur patterns ke nuances samajhne mein madad milti hai.
                • <a href="https://www.instaforex.org/ru/?x=ruforum">InstaForex</a>
                • #9 Collapse

                  Forex Mein Falling Three Candlestick Pattern Ka Istemal

                  Forex market mein technical analysis ka istemal karte waqt, candlestick patterns aam tor par traders ke liye mahatvapurn tools hote hain. In patterns mein se ek pramukh pattern hai "Falling Three Candlestick Pattern" jo ki bearish reversal pattern hai. Is article mein hum Falling Three Candlestick Pattern ke bare mein vistaar se baat karenge aur iska istemal Forex trading mein kaise kiya ja sakta hai.

                  1. Candlestick Patterns Ki Ahmiyat

                  Forex trading mein candlestick patterns ki ahmiyat kafi zyada hai kyunki ye price action ko samajhne ka ek zaroori tareeqa hain. In patterns ki madad se traders price movements ka trend aur future direction predict kar sakte hain.

                  Candlestick patterns, like the Falling Three Candlestick Pattern, are crucial tools for traders in the Forex market. They provide valuable insights into price action, allowing traders to interpret trends and predict future market movements with greater accuracy. These patterns are formed based on the open, high, low, and close prices within a specific timeframe, typically represented by candlesticks on a chart.

                  2. Falling Three Candlestick Pattern Ka Introduction

                  Falling Three Candlestick Pattern ek bearish reversal pattern hai, jo uptrend ke baad dikhai deta hai aur indicate karta hai ki market mein bearish trend shuru hone ki sambhavna hai. Is pattern mein 5 candlesticks hote hain, jinme se 3 green (bullish) candles aur 2 red (bearish) candles hote hain.

                  The Falling Three Candlestick Pattern is characterized by a sequence of five candlesticks that typically appears after an uptrend. It consists of three bullish (green) candles followed by two bearish (red) candles. The pattern suggests a potential reversal from an uptrend to a downtrend in the market sentiment.

                  3. Pattern Ki Formation

                  Falling Three Candlestick Pattern ka formation kuch is tarah hota hai:
                  • Pehla candle: Yeh ek uptrend ke dauran banega aur green (bullish) hoga.
                  • Dusra candle: Yeh bhi green (bullish) hoga aur pehle candle ke oopar close karega.
                  • Teesra candle: Phir se green (bullish) hoga aur doosre candle ke oopar close karega.
                  • Chautha candle: Yeh red (bearish) hoga aur teesre candle ke nichle level par close karega.
                  • Paanchva candle: Yeh bhi red (bearish) hoga aur choutha candle ke nichle level par close karega.

                  The Falling Three Candlestick Pattern forms as follows: First, there is a bullish candle during an uptrend, followed by another bullish candle closing higher than the first. The third candle is also bullish and closes above the second candle's high. Then, a bearish reversal occurs with the fourth candle closing below the low of the third candle, followed by the fifth candle closing below the low of the fourth candle.

                  4. Bearish Reversal Ki Nishani

                  Is pattern ka sabse ahem maqsad bearish reversal ko identify karna hai. Jab market pehle 3 bullish candles ke baad do consecutive bearish candles form karta hai, to yeh ek reversal signal hota hai.

                  The primary objective of the Falling Three Candlestick Pattern is to identify a bearish reversal in the market sentiment. When two consecutive bearish candles follow three bullish candles, it signals a potential trend reversal from bullish to bearish.

                  5. Volume Ki Tafseel

                  Pattern ki sahi tasdeeq ke liye volume bhi consider kiya jata hai. Agar bearish candles ke sath volume bhi increase hota hai, toh reversal ki possibility aur bhi zyada hoti hai.

                  Volume plays a crucial role in confirming the validity of the pattern. An increase in volume along with the formation of bearish candles enhances the likelihood of a successful reversal. Traders often look for higher trading volumes during the formation of bearish candles to strengthen their confidence in the reversal signal.

                  6. Risk Management

                  Har trading strategy mein risk management ka khayal rakhna zaroori hai. Falling Three Candlestick Pattern ki trading mein bhi stop-loss aur take-profit levels ko tay karna zaroori hai taki trading positions ko manage kiya ja sake.

                  Risk management is essential in every trading strategy. When trading based on the Falling Three Candlestick Pattern, it's crucial to establish clear stop-loss and take-profit levels. These levels help traders manage their positions effectively and protect their capital from potential losses.

                  7. Entry Points Aur Stop-loss Levels

                  Pattern ki confirmation ke baad entry point aur stop-loss level tay karna zaroori hai. Entry point usually chauthi ya paanchvi candle ke nichle low ke break ke baad liya jata hai aur stop-loss pe teesri ya chouthi candle ke high ke just above rakh sakte hain.

                  After confirming the Falling Three Candlestick Pattern, traders determine their entry points and stop-loss levels. Entry is often made after the low of the fourth or fifth candle is breached, signaling a strong bearish sentiment. Stop-loss levels are typically placed just above the high of the third or fourth candle to limit potential losses if the market reverses unexpectedly.

                  8. Time Frame Aur Validity

                  Falling Three Candlestick Pattern ko different time frames pe dekha ja sakta hai, lekin iski validity higher time frames jaise ki daily charts pe zyada hoti hai. Is pattern ki strong validity higher time frames pe dikhai deti hai.

                  While the Falling Three Candlestick Pattern can be observed on various time frames, its validity is often stronger on higher time frames such as daily charts. The pattern's significance and reliability tend to increase when identified on longer time frames, providing traders with more robust signals for decision-making.

                  9. Price Action Aur Pattern Ka Taa'alluq

                  Falling Three Candlestick Pattern mein price action ka bhi ahem role hota hai. Is pattern mein price action ke sath sath volume aur candlestick ka pattern bhi zaroori hota hai.

                  Price action plays a significant role in the Falling Three Candlestick Pattern. In addition to candlestick patterns, traders analyze price movements and trading volumes to validate the pattern's signals. Understanding price action helps traders interpret market sentiment accurately and make informed trading decisions based on the pattern's formation.

                  10. Real-life Examples

                  Is article mein real-life examples aur charts ka istemal karke Falling Three Candlestick Pattern ki practical understanding di jayegi. Ye examples readers ko pattern ko identify karne aur uska istemal samajhne mein madad karenge.

                  Real-life examples and charts are instrumental in enhancing the practical understanding of the Falling Three Candlestick Pattern. By analyzing specific instances where the pattern has occurred, traders can gain insights into its identification and application in real-time market conditions. These examples serve as valuable learning tools for recognizing the pattern's formation and its implications for trading strategies.

                  11. Multiple Time Frame Analysis

                  Multiple time frame analysis ka istemal Falling Three Candlestick Pattern ki confirmation ke liye bhi kiya ja sakta hai. Isse traders ko pattern ki validity aur strength ka sahi andaza ho sakta hai.

                  Traders often use multiple time frame analysis to confirm the Falling Three Candlestick Pattern. By examining the pattern across different time frames, traders can assess its validity and gauge the strength of the reversal signal. This approach provides a comprehensive view of market dynamics and helps traders make well-informed decisions based on the pattern's alignment across various time frames.

                  12. Trading Strategies

                  Falling Three Candlestick Pattern ko alag-alag trading strategies ke sath combine karke bhi istemal kiya ja sakta hai. Jaise ki trend lines, Fibonacci levels, aur technical indicators jaise ki RSI aur MACD ke sath.

                  The Falling Three Candlestick Pattern can be integrated into various trading strategies. Traders often combine the pattern with other technical tools such as trend lines, Fibonacci retracements, and indicators like Relative Strength Index (RSI) and Moving Average Convergence Divergence (MACD). By incorporating multiple analysis techniques, traders enhance their strategy's effectiveness and improve their ability to capitalize on trading opportunities identified by the pattern.

                  13. Pattern Ki Limitations

                  Har trading pattern ki tarah, Falling Three Candlestick Pattern ki bhi kuch limitations hoti hain jaise false signals ka risk. Isliye is pattern ki confirmation aur additional indicators ka istemal zaroori hai.

                  Like any trading pattern, the Falling Three Candlestick Pattern has its limitations, including the risk of false signals. Traders should exercise caution and use additional confirmation techniques and indicators to validate the pattern's signals before entering trades. By acknowledging its limitations and employing robust risk management strategies, traders can mitigate potential risks associated with false signals and optimize their trading decisions based on more reliable market insights.

                  14. Conclusion

                  Falling Three Candlestick Pattern Forex trading mein ek powerful tool hai jo bearish reversal ko identify karne mein madad deta hai. Is pattern ki sahi samajh aur istemal se traders apne trading strategies ko improve kar sakte hain aur consistent profits generate kar sakte hain.

                  In conclusion, the Falling Three Candlestick Pattern is a powerful tool in Forex trading for identifying bearish reversals in the market. By understanding the pattern's formation and effectively applying it within trading strategies, traders can enhance their decision-making process and achieve consistent profitability. The pattern's ability to signal potential trend reversals provides traders with valuable insights into market dynamics, empowering them to capitalize on opportunities and manage risks effectively.

                  Final Words

                  Is article mein humne Falling Three Candlestick Pattern ke bare mein comprehensive overview diya hai aur iska istemal Forex trading mein kaise kiya ja sakta hai, ye samjhaya hai. Traders ko hamesha market conditions aur risk tolerance ko dhyan mein rakhkar trading decisions leni chahiye. Candlestick patterns ke sahi samajh aur istemal se trading skills ko enhance kiya ja sakta hai.

                  This expanded version provides a detailed exploration of the Falling Three Candlestick Pattern, its significance in Forex trading, and practical insights for traders aiming to integrate this pattern into their trading strategies effectively.

                  اب آن لائن

                  Working...
                  X