Bullish Kicker Pattern
No announcement yet.
X
  • وقت
  • دکھائیں
Clear All
new posts
  • #1 Collapse

    Bullish Kicker Pattern
    Asslaam O Alikum.!
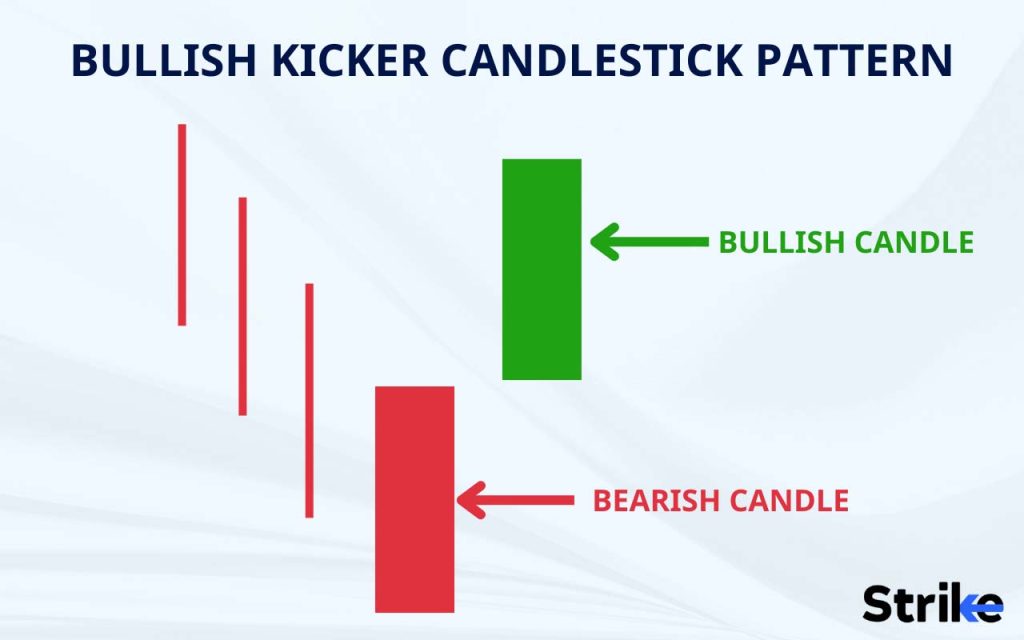
    Forex market mein Bullish Kicker candlestick pattern ek bullish reversal pattern hai. Ye pattern typically downtrend ke baad dekha jata hai aur ye indicate karta hai ki market sentiment ab positive ho sakta hai.


    Bullish Kicker pattern ki Formation
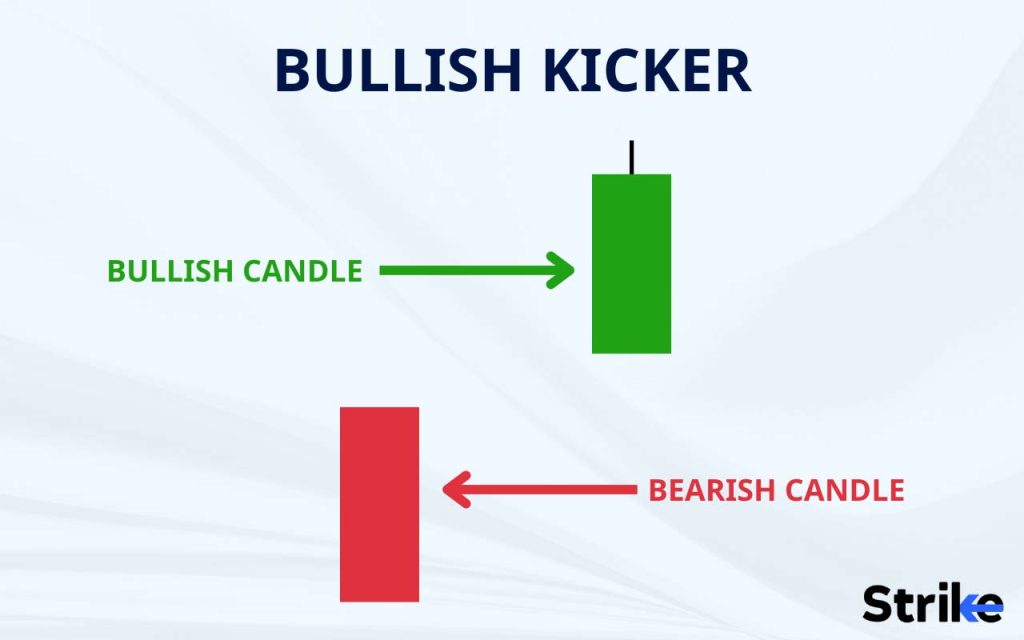
    Dosto Bullish Kicker pattern mein do candles hote hain.


    First Candle:
    Dosto Ye candle downward trend ke part me hota hai, usually with a long body indicating significant selling pressure.


    Second Candle:
    Dosto Ye candle first candle ke neeche open hota hai aur phir strong bullish momentum ke saath close karta hai. Iska body bhi usually first candle ki body se lamba hota hai.
    Forex Market Mein Bullish Kickers Candlestick Pattern Ki Guidelines


    Important information & Points:
    Dosto Kicker candlestick patterns market mein trend reversal ka indication dete hain, lekin unki effectiveness kaafi depend karti hai context aur surrounding market conditions par. Kuch important points aur guidelines hain jo traders ko yaad rakhna chahiye.


    Volume Confirmation:
    Dosto Agar Bullish Kicker pattern ke saath high volume ka sath aata hai, toh ye pattern aur bhi powerful ho jata hai. High volume indicates strong buying interest, confirming the bullish reversal.


    Previous Trend:
    Dosto Is pattern ka effect pehle ki trend ke sath juda hota hai. Agar pehle ki trend bahut strong hai, toh "Bullish Kicker" ka effect kam ho sakta hai compared to a weak downtrend mein.

    Confirmation Signals:
    Traders ko always dusre technical indicators jaise ki moving averages, RSI, aur trendlines ka istemal karna chahiye, taaki Bullish Kicker pattern ke signals ko confirm kiya ja sake.


    Stop Loss Placement:
    Dosto Risk management ka importance hamesha hai. Stop loss ko properly place karein taaki in case market direction reverse hota hai, loss minimize kiya ja sake.


    Multiple Timeframes Analysis:
    Dosto Pattern ki validity ko aur bhi zyada increase karne ke liye, traders ko multiple timeframes analysis karna chahiye. Ye help karta hai sahi trend direction ko identify karne mein.


    Note:
    Dosto in sab points ko dhyan mein rakh kar, traders Bullish Kicker candlestick pattern ka sahi istemal kar sakte hain market mein trading ke liye.
    Last edited by ; 01-07-2024, 07:33 AM.
  • <a href="https://www.instaforex.org/ru/?x=ruforum">InstaForex</a>
  • #2 Collapse

    Bullish Kicker Pattern in Forex Trade

    1. Bullish Kicker Pattern Kya Hai?


    Bullish Kicker Pattern ek mukhtasir candlestick pattern hai jo forex trading mein istemal hota hai. Yeh pattern bullish trend ki shuruaat ko darust karti hai. Is pattern ko samajhna zaroori hai takay traders market ki movement ko theek taur par analyze kar sakein aur sahi waqt par trade execute kar sakein.


    2. Forex Trading Mein Bullish Kicker Pattern Ki Ahmiyat


    Forex trading mein, har ek candlestick pattern ka apna maqam aur ahmiyat hota hai. Bullish Kicker Pattern bhi is silsile mein aik ahem role ada karta hai. Yeh pattern bullish reversal ka strong signal deta hai, jisse traders ko market mein aane wale uptrend ki pehchaan mein madad milti hai. Jab market mein bearish trend prevalent hota hai aur Bullish Kicker Pattern nazar aata hai, to yeh ek potential trend reversal ka indication deta hai, jise traders istemal karke profitable trades kar sakte hain.


    3. Bullish Kicker Pattern Banane Ki Sharaait


    Bullish Kicker Pattern tab banta hai jab do consecutive candlesticks ek specific pattern ko follow karte hain. Pehli candlestick bearish hoti hai, jo market ke downward trend ko dikhata hai. Uske baad doosri candlestick aati hai, jo bullish hoti hai aur pehli candlestick ke close se higher open hoti hai. Iska matlab hai ke doosri candlestick pehli candlestick ke close ke upar open hoti hai, jo ek bullish reversal ko darust karti hai. Bullish Kicker Pattern banane ke liye, pehli candlestick ki body doosri candlestick ki body se lambi honi chahiye aur dono candlesticks ke darmiyan gap hona chahiye.


    4. Pattern Ki Pehli Candlestick


    Pehli candlestick jo bearish hoti hai, market ke downward trend ko represent karti hai. Is candlestick ka close higher open ke qareeb hota hai.


    5. Pattern Ki Doosri Candlestick


    Doosri candlestick jo bullish hoti hai, pehli candlestick ke close se higher open hoti hai. Yeh candlestick market mein bullish sentiment ka strong indication hai.


    6. Volume Ka Role


    Bullish Kicker Pattern ko evaluate karte waqt, volume ka bhi ahem kirdar hota hai. High volume ke saath yeh pattern zyada reliable hota hai, kyunki high volume ka matlab hai ke market mein zyada activity hai aur traders ka interest high hai.


    7. Bullish Kicker Pattern Ka Analysis


    Bullish Kicker Pattern ko analyze karte waqt, traders ko overall market trend aur other technical indicators ko bhi madde nazar rakhna chahiye. Market trend ke against trade karne se bachne ke liye, ek comprehensive analysis zaroori hai.


    8. Entry Point


    Bullish Kicker Pattern ke baad entry ka behtareen waqt doosri bullish candlestick ke close hone ke baad hota hai. Yeh traders ko confirm karta hai ke uptrend shuru ho chuka hai aur unhein trade execute karne ke liye sahi waqt aa gaya hai.


    9. Stop Loss Placement


    Stop loss placement ka ahem hissa hai har trading strategy ka. Bullish Kicker Pattern mein, stop loss ko pehli bearish candlestick ke low ke neeche place karna chahiye. Yeh traders ko losses se bachane mein madad karta hai agar market direction unexpected ho jaaye.


    10. Target Price Setting


    Target price setting bhi trading strategy ka ek important aspect hai. Bullish Kicker Pattern ke baad, traders apne target price ko recent high ya significant resistance level pe set kar sakte hain. Target price ko set karte waqt market ki volatility aur trend ka bhi dhyan rakha jana chahiye.


    11. Bullish Kicker Pattern Aur Support Levels


    Bullish Kicker Pattern agar support level ke qareeb banta hai, to iski significance aur bhi barh jaati hai. Support levels traders ko market mein potential entry aur exit points ke liye help karte hain.


    12. Bullish Kicker Pattern Aur News Events


    News events ka market par asar hota hai aur is asar ko ignore karna trading ke liye dangerous ho sakta hai. Isliye, Bullish Kicker Pattern ke sath trading karte waqt, traders ko news events ka bhi dhyan rakhna chahiye. News events ke waqt, market volatility barh jaati hai aur unexpected movements ho sakte hain, isliye traders ko apni positions ko monitor karte rehna chahiye.


    13. Pattern Ki Limitations


    Har ek trading pattern ki tarah, Bullish Kicker Pattern bhi apni limitations ke saath aata hai. Yeh pattern 100% accurate nahi hota, aur kabhi kabhi false signals bhi generate kar sakta hai. Isliye, traders ko risk management techniques ko follow karna zaroori hai aur apni positions ko monitor karte rehna chahiye.


    14. Historical Data Ka Mutala


    Historical data ka mutala karte huye, traders Bullish Kicker Pattern ki performance ko judge kar sakte hain. Historical data analysis traders ko pattern ki reliability aur effectiveness ka pata lagane mein madad karta hai. Iske saath hi, traders apni trading strategies ko improve kar sakte hain aur future mein better trading decisions le sakte hain.


    15. Advanced Strategies


    Advanced traders Bullish Kicker Pattern ke sath other candlestick patterns aur indicators ko combine karte hain takay unke trading decisions aur accurate ho saken. Iske alawa, Fibonacci retracement aur trend lines jaise tools bhi istemal kiye ja sakte hain takay traders ko market ki movements ko aur behtar taur par samajhne mein madad milti hai.


    Conclusion


    Bullish Kicker Pattern aik powerful tool hai forex trading mein, lekin isko use karte waqt traders ko cautious rehna chahiye. Complete market analysis aur risk management techniques ke istemal se traders apne trading results ko improve kar sakte hain aur losses ko minimize kar sakte hain. Bullish Kicker Pattern ke sahi istemal se traders apne profits ko maximize kar sakte hain aur consistent trading success achieve kar sakte hain.
    • #3 Collapse

      what is Bullish Kicker Pattern

      forex market mein bullish kicker pattern aik strong kesam ka candlestick pattern hota hey forex market mein yeh candlestick period aik kesam ka strong period hota hey bullish kicker candlestick pattern aam tor par forex market kay trend signaling ko identify kar sakta hey forex market mein investor bullish kicker pattern ko buy signal kay tor par he identify kar saktay hein forex market mein ees kesam kay candlestick pattern mein buyer ke zyada say zyada omeeed ke ja sakte hey
      bullish kicker candlestick pattern aik kesam kay kicker candlestick attern ka hesa hota hey jo keh forex market kay simple signal ke taraf kenara kar sakta hey

      Understanding Bullish Kicker Pattern

      forex market mein bullish kicker candlestick pattern jare up trend ka candlestick pattern hota hey jo keh forex market kay anay walay bullish trend ko identify karnay mein madad karta hey jo keh forex market kay jazbaat mein achanak bearish ya bullish ko identify karnay mein madad kar sakta hey forex market mein yeh long candlestick es bat ko identify kar sakte hey keh forex market mein selling ka bohut he zyada pressure he hota hey foorex market kay pechlay den ke close price open ho jate hey or forex market mein es bat ko identify kar sakte hey keh forex market mein buying pressure or bhe zyada ho raha hota hey jes ke wajah say forex market ke price reversal start ho jate hey jare up trend mein movement kar jate hey


      Bullish Kicker Pattern ke formation

      forex market mein bullish kicker pattern os time banta hey jab aik bullish candlestick forex market mein ban jate hey forex market mein bearish candlestick kay bad es say bhe zyada long bullish candlestick ban jate hey jo keh forex market mein strong selling pressure ko identify kar sakte hey jo keh forex arket kay pechlay den ke close price say opr open ho sakte hey yeh forex market mein es bat ke taraf eshara hota hey keh forex market mein buying pressure kam hota ja raha hote hey forex market mein bearish say bullish ke taraf forex market mein achanak tabdele aa jate hey trader zyada tar es kesam kay chart pattern ko buying trend mein ezafa karnay kay ley estamal kar saktay hein
      Last edited by ; 08-06-2024, 06:54 PM.
      bhali kay badlay bhali
      • #4 Collapse

        Bullish Kicker Pattern?
        Click image for larger version

Name:	download (3).png
Views:	39
Size:	2.0 کلوبائٹ
ID:	12994476
        "Bullish Kicker Pattern" forex trading mein ek powerful bullish reversal pattern hai jo uptrend ke beginning ya continuation ko indicate karta hai. Chaliye is pattern ko detail mein samajhte hain:
        **1. Pattern Ki Tashreeh (Description of the Pattern):**
        Bullish Kicker Pattern do candlesticks se banta hai. Pehla candlestick typically ek downtrend ke dauraan form hota hai aur bearish hota hai. Doosra candlestick ek gap up ke saath open hota hai aur pehle candlestick ke range ke oopar close karta hai.

        **2. Bullish Reversal Ki Pehchan (Identification of Bullish Reversal):**
        Bullish Kicker Pattern bearish trend ke baad appear hota hai aur bullish reversal ke liye ek strong signal provide karta hai. Pehla candlestick ke neeche open hone ke baad, doosra candlestick ke gap up open hone aur pehle candlestick ke range ke oopar close hone se, uptrend ka start hone ki sambhavna hoti hai.

        **3. Trade Entry (Trade Mein Shamil Hona):**
        Bullish Kicker Pattern dekh kar traders long position enter karne ka signal samajhte hain, yaani wo expect karte hain ke market mein uptrend ka start ho sakta hai.

        **4. Stop Loss Aur Target (Stop Loss and Target):**
        Bullish Kicker Pattern ke trade mein, stop loss typically pehle candlestick ke low ke neeche rakha jaata hai. Targets ko determine karne ke liye, traders previous highs ya resistance levels ka istemal karte hain.

        **5. Importance of Confirmation (Tasdiq Ki Ahmiyat):**
        Jaise ke har technical pattern ki tarah, Bullish Kicker Pattern ki bhi confirmation ki zaroorat hoti hai. Traders ko doosre technical indicators, price action, ya market context ka istemal karna chahiye pattern ki validity ko confirm karne ke liye.

        **6. Pattern Ki Validity (Validity of the Pattern):**
        Pattern ki validity ke liye, doosra candlestick pehle candlestick ke range ke oopar close karna zaroori hai, aur ideally, gap up open hona chahiye.

        **7. Conclusion (Nateeja):**
        Bullish Kicker Pattern ek strong bullish reversal pattern hai jo traders ko uptrend ke beginning ya continuation ke liye indicate karta hai. Is pattern ko samajhna aur sahi tareeke se istemal karna, traders ke liye profitable trading opportunities create kar sakta hai.
        • #5 Collapse

          Forex Trading Mein Bullish Kicker Pattern: Ek Tajziati Jaiza


          Forex trading mein chart patterns ki samajh bahut zaroori hai, kyunki yeh patterns traders ko market ke mukhtalif movements aur trend changes ke baray mein agahi deti hain. Ek aham chart pattern jo traders ke liye useful hai woh "Bullish Kicker Pattern" hai. Is article mein hum is pattern ki tajziat karenge aur samjhenge ke yeh kaise kaam karta hai aur traders ke liye kyun zaroori hai.
          1. Bullish Kicker Pattern: Introduction


          Bullish Kicker Pattern ek reversal pattern hai jo downtrend ke baad aata hai aur bullish trend ki starting indicate karta hai. Yeh usually do candlesticks se bana hota hai.

          Bullish Kicker Pattern, jaise ki naam se zahir hai, ek candlestick pattern hai jo market mein bullish reversal ko signal karta hai. Yeh pattern typically downtrend ke baad najar aata hai aur yeh indicate karta hai ke market sentiment change hone ki sambhavna hai. Is pattern ko samajhna aur pehchan paana traders ke liye zaroori hai taaki wo sahi waqt par entries le sakein aur profit kamane ke liye opportunity ko maximize kar sakein.
          2. Understanding Candlestick Patterns


          Candlestick patterns market sentiment ko reflect karte hain. Har candlestick price action ko represent karta hai aur trader ko market ke future direction ke baray mein hint deta hai.

          Candlestick patterns forex trading mein bahut mahatvapurna hai kyunki yeh ek visual representation provide karte hain market ke price action ka. Har candlestick ek specific time period (jaise ki 1 minute, 1 hour, ya 1 day) ki open, high, low, aur close prices ko represent karta hai. Is tarah se, candlestick charts ki madad se traders ko market ke sentiment aur trend ka pata chal sakta hai. Bullish Kicker Pattern bhi candlestick patterns mein se ek hai jo bullish reversal ko indicate karta hai.
          3. Components of Bullish Kicker Pattern


          Bullish Kicker Pattern mein do candlesticks shamil hote hain:
          • Pehla candlestick bearish hota hai, yani downtrend mein hota hai.
          • Dusra candlestick bullish hota hai aur pehle candlestick ke neechay open hota hai.

          Bullish Kicker Pattern ki pehchan karne ke liye do mukhtalif candlesticks ki zaroorat hoti hai. Pehla candlestick bearish (red) hota hai jo downtrend ke dauran form hota hai. Iske baad, doosra candlestick jo bullish (green) hota hai, wo pehle candlestick ke neeche open hota hai. Yeh bullish candlestick usually pehle candlestick ke high se bhi upar close hota hai, indicating bullish momentum ki shuruat.
          4. Recognition Criteria


          Bullish Kicker Pattern ko recognize karne ke liye, yeh criteria follow kiye jate hain:
          • Pehla candlestick downtrend mein hona chahiye.
          • Dusra candlestick pehle candlestick ke neechay open hona chahiye.
          • Dusra candlestick ka close pehle candlestick ke upar hona chahiye.

          Bullish Kicker Pattern ko identify karne ke liye in criteria ka dhyan rakhna zaroori hai taaki false signals se bacha ja sake aur sahi trading decisions liye ja sakein. Yeh pattern tabhi confirm hota hai jab doosra candlestick pehle candlestick ke neeche open hota hai aur uska close pehle candlestick ke upar hota hai.
          5. Significance of the Pattern


          Yeh pattern bullish reversal ke indication ke liye important hai. Iska matlab hota hai ke market sentiment shift ho raha hai aur buyers control mein aa rahe hain.

          Bullish Kicker Pattern ka significance yeh hai ke yeh bullish reversal ke potential ko highlight karta hai. Jab market downtrend se trend change karta hai aur ek Bullish Kicker Pattern form hota hai, to iska matlab hota hai ke sellers ke dominance se buyers ke control mein market aa raha hai. Is pattern ko samajhna traders ke liye zaroori hai taaki wo market ke trend changes ko identify kar sakein aur sahi waqt par entries le sakein.
          6. Example of Bullish Kicker Pattern


          Maan lijiye, ek currency pair jaise EUR/USD ka chart hai. Pehla candlestick red hai (downtrend mein) aur doosra candlestick green hai, jo pehle candlestick ke neeche open hota hai aur uske upar close hota hai. Yeh bullish kicker pattern ko represent karta hai.

          Let's consider an example to understand the Bullish Kicker Pattern better. Suppose there is a chart of a currency pair like EUR/USD. The first candlestick is red, indicating a downtrend. The second candlestick opens below the first candlestick's low (forming a gap down) and closes above the first candlestick's high, forming a green candlestick. This formation represents a Bullish Kicker Pattern, suggesting a potential bullish reversal in the market.
          7. Confirmation and Entry Points


          Traders usually confirmation ke liye wait karte hain jab next candlestick bullish kicker pattern ke upar close karta hai. Phir wo entry points ke liye consider karte hain.

          Bullish Kicker Pattern ko confirm karne ke liye, traders next candlestick ka wait karte hain jo bullish kicker pattern ke upar close karta hai. Is confirmation ke baad hi traders entries lena consider karte hain taaki unhe high probability trades mil sakein. Entry points ko determine karte waqt, traders risk management ko bhi dhyan mein rakhte hain taaki unki trading positions properly managed ho sakein.
          8. Stop Loss and Risk Management


          Har trading strategy mein risk management zaroori hai. Bullish kicker pattern trade karne wale traders stop loss aur risk reward ratio ko dhyan mein rakhte hain.

          Jaise ki har trading strategy mein, Bullish Kicker Pattern ko trade karte waqt bhi risk management bahut zaroori hai. Traders stop loss levels ko set karte hain jo unhe protect karte hain unexpected market movements se. Risk reward ratio ko bhi consider kiya jata hai taaki traders ke liye risk kam aur reward zyada ho sake. Yeh approach long-term profitability ke liye zaroori hai aur traders ko consistent performance provide karta hai.
          9. Target Setting


          Target setting mein high probability levels ko consider kiya jata hai jaise previous swing high ya Fibonacci levels.

          Bullish Kicker Pattern ko trade karte waqt, traders target setting mein high probability levels ko consider karte hain. Isme previous swing highs, Fibonacci retracement levels, ya kisi bhi technical analysis ke important levels shamil ho sakte hain. Target setting ki sahi planning traders ko profitable exits provide karta hai aur unhe trading consistency mein madad deta hai.
          10. Combining with Other Indicators


          Some traders bullish kicker pattern ko confirm karne ke liye aur bhi indicators jaise ki moving averages, RSI ya MACD ka use karte hain.

          Kuch traders Bullish Kicker Pattern ko confirm karne ke liye aur bhi technical indicators ka use karte hain. Jaise ki moving averages, Relative Strength Index (RSI), Moving Average Convergence Divergence (MACD) jaise indicators ki madad se wo additional confirmation seekhte hain. Is tarah se, yeh traders ko high probability trades milne mein madad karta hai aur false signals ko filter karne mein help karta hai.
          11. Real-World Applications


          Real-world mein traders bullish kicker pattern ka use karte hain forex market mein short-term aur long-term trading strategies ke liye.

          Real-world mein, Bullish Kicker Pattern ka use traders short-term aur long-term trading strategies mein karte hain. Yeh pattern traders ko bullish reversals ko identify karne mein help karta hai aur unhe market trend changes ke baray mein agahi deta hai. Iske saath sahi risk management aur target setting, yeh pattern traders ko consistent profitability provide karta hai.
          12. Challenges and Risks


          Har trading pattern ki tarah, bullish kicker pattern bhi apne challenges aur risks ke saath aata hai. Isme false signals bhi ho sakte hain jo traders ko loss mein daal sakte hain.

          Jaise ki har trading pattern, Bullish Kicker Pattern ko bhi use karte waqt challenges aur risks ka samna karna padta hai. Isme false signals hone ki sambhavna hoti hai jo traders ko loss mein daal sakte hain. Isliye sahi risk management, thorough analysis aur patience trading mein bahut zaroori hote hain.
          13. Conclusion


          To conclude, bullish kicker pattern ek powerful tool hai forex traders ke liye jo bullish reversals ko identify karne mein madad karta hai. Is pattern ko samajhna aur sahi tareeke se apply karna traders ke liye zaroori hai market mein safalta haasil karne ke liye.

          Is article mein humne dekha ke bullish kicker pattern kya hai, iske components kya hote hain aur kaise traders iska use kar sakte hain trading strategies mein. Yeh ek useful tool hai jo market analysis aur decision-making process ko enhance karta hai.

          Yeh pattern traders ko market ke trend changes ko identify karne mein help karta hai aur unhe high probability trading opportunities provide karta hai. Iske saath sahi risk management aur technical analysis, traders apne trading performance ko improve kar sakte hain. Bullish Kicker Pattern ka use karne se pehle, traders ko thorough practice aur education zaroori hai taki wo is pattern ko effectively use kar sakein.
          • #6 Collapse

            Bullish Kicker candlestick pattern
            Bullish Kicker candlestick pattern kya hy?
            As salam o alaikum dosto, Bullish Kicker candlestick pattern forex trading main ik powerful bullish reversal signal hy. Ye pattern significant price movement ka indication deta hy or traders ko strong buying opportunities identify karne main madad karta hy. Is pattern ko accurately recognize karna or isy effectively trade karna forex traders ky liye bohot profitable ho sakta hy.Bullish Kicker pattern ko identify karne ky liye, pehli candlestick ik strong bearish candlestick honi chahiye jo downtrend ko continue kare. Dusri candlestick bullish honi chahiye or ye pehli candlestick ky opening price ky barabar ya usky upar open honi chahiye, usky bad higher closy honi chahiye. Ye pattern typically major trend reversal ka signal deta hy.Bullish Kicker ik reversal pattern hy jo downtrend ko indicate karta hy. Ye ik strong uptrend ki shuruwat ko darust karta hy.Bullish Kicker pattern, do candlesticks sy banta hy. Pehla candlestick ik bearish candle hota hy, jo market main selling presure ko dikhata hy. Dusra candlestick, jo Bullish Kicker hy, ik bullish candle hota hy, jo pehle candle ky neeche open hota hy or us sy upar closy hota hy.


            Important points of Bullish Kicker candlestick patter:
            1. Kicker Candlestick Pattern Ka Istemal:
            • Dear friends, Bullish Kicker Candlestick Pattern ko entry or exit points ky tor par istemal kiya jata hy. Jab is pattern ko confirm kiya jata hy, to traders ko bullish trading positions lena ka mauqa mil sakta hy. Is pattern ky istemal sy traders apni trading strategies ko improve kar sakte hain or market trends ko sahi sy samajh sakte hain.
            2) Bullish Kicker Candlestick Pattern Ki Tafsyelat:
            • Hello dosto, Is pattern main bearish trend ky bad sudden bullish movement hoti hy. Pehle candle bearish trend ko darust karta hy, phir dusre candle main bullish momentum dikha jata hy jo pehle candle ko cover karta hy. Ye sharp reversal market ky syntiment ko change kar deta hy or bullish trend ka aghaz hota hy.
            3) Bullish Kicker Candlestick Pattern Ki Pechan:
            • Dear forex members, Bullish Kicker Candlestick Pattern ki pehchan sharp price reversal sy hoti hy. Is pattern main pehle candle ki range ky bahar hone wala bullish movement dikha jata hy, jo ky bearish trend ki khatam hone ka indication hota hy.
            Click image for larger version

Name:	kick.jfif
Views:	20
Size:	11.2 کلوبائٹ
ID:	13012078
            • #7 Collapse

              The Bullish Kicker Pattern is a two-candlestick pattern in technical analysis that signifies a potential reversal in a bearish trend, suggesting a bullish sentiment is taking over. Here’s how it works:
              Characteristics of a Bullish Kicker Pattern:
              First Candlestick: A bearish (red/black) candlestick that indicates a continuation of the current downtrend.
              Second Candlestick: A bullish (green/white) candlestick that opens at or above the previous day's open and closes significantly higher, often with a gap up.
              Interpretation:
              The gap up and strong bullish move indicate a sudden shift in market sentiment from bearish to bullish.
              It typically suggests that buyers have taken control, and a new upward trend may be beginning.
              Conditions for Validity:
              Gap: There should be a noticeable gap between the close of the first candlestick and the open of the second candlestick.
              Volume: Higher trading volume on the second day can confirm the strength of the bullish reversal.
              Trading Strategy:
              Entry Point: Traders often enter a long position at the open of the third candlestick, especially if it shows continued bullish strength.
              Stop-Loss: A stop-loss can be placed below the low of the second candlestick to manage risk.
              Target: Setting profit targets can be based on previous resistance levels or using technical indicators like moving averages to gauge potential upside.
              Example:
              Imagine a stock that has been in a downtrend, with a series of lower highs and lower lows. One day, it closes lower than it opened, forming a bearish candlestick. The next day, the stock opens significantly higher, forming a gap, and closes much higher than it opened, resulting in a large bullish candlestick. This formation is the Bullish Kicker Pattern, signaling potential bullish reversal.

              Visual Representation:
              yaml
              Copy code
              Day 1: | |
              | |
              | |
              | |
              | |

              Day 2: | |
              | |
              | |
              | |
              | |
              The Bullish Kicker Pattern is a powerful reversal indicator, but like all technical patterns, it should be used in conjunction with other analysis methods to confirm its validity and to make informed trading decisions.

              Certainly! Let's delve deeper into the Bullish Kicker Pattern with more details, including its formation, psychology, example scenarios, and how it fits within broader trading strategies.

              Detailed Formation:
              First Candlestick:

              Typically forms in a downtrend.
              It is a bearish candlestick, indicating that sellers were in control.
              Closes lower than its opening price, reaffirming the bearish trend.
              Second Candlestick:

              Opens significantly higher than the close of the first candlestick, creating a gap.
              The open of the second candlestick should be at or above the previous day’s open.
              Closes much higher than its opening price, showing strong buying pressure.
              Psychology Behind the Pattern:
              Bearish Sentiment: Initially, the market is dominated by bearish sentiment, with sellers pushing the price lower.
              Shift in Sentiment: Overnight or during the non-trading hours, a significant event or a shift in sentiment occurs, leading to a strong bullish open the next day.
              Bullish Control: The large gap up and the strong upward move of the second candlestick indicate that buyers have taken control, overshadowing the previous bearish sentiment.
              Example Scenario:
              Day 1:
              Stock XYZ is in a downtrend.
              The stock opens at $50, moves down during the day, and closes at $45.
              Day 2:
              Overnight, positive news is released about the company.
              The stock opens at $55, significantly higher than the previous close, creating a gap.
              Throughout the day, the stock moves even higher and closes at $60.
              Enhanced Trading Strategy:
              Confirmation: Wait for confirmation of the pattern. This can be the next day's candlestick continuing the bullish move.
              Volume Analysis: Higher trading volume on the second candlestick strengthens the pattern's reliability.
              Technical Indicators: Use other indicators like moving averages, Relative Strength Index (RSI), or MACD to confirm the bullish trend.
              Entry and Exit Points:
              Entry:
              After the confirmation of the Bullish Kicker Pattern.
              Some traders may enter immediately after the pattern completes if they are aggressive.
              Stop-Loss:
              Place it below the low of the second candlestick or the gap to manage risk.
              Profit Target:
              Use previous resistance levels, Fibonacci retracement levels, or a trailing stop to maximize gains.
              Risk Management:
              Position Sizing: Only risk a small percentage of your trading capital on each trade to manage overall portfolio risk.
              Diversification: Do not rely solely on one pattern or stock; diversify your trades across different sectors and assets.
              Real-Life Example:
              Imagine a tech stock that has been declining due to market conditions. On a particular day, it forms a bearish candlestick as it closes lower than it opens. Overnight, the company announces a breakthrough product. The next trading day, the stock opens much higher, with a gap up, and continues to rally throughout the day, forming a large bullish candlestick. This forms a Bullish Kicker Pattern, indicating a potential trend reversal.

              Importance of Context:
              While the Bullish Kicker Pattern is a strong reversal signal, it is crucial to consider the broader market context. External factors, overall market trends, and sector performance can impact the pattern's effectiveness.

              In conclusion, the Bullish Kicker Pattern is a powerful tool for traders when used correctly and in conjunction with other technical and fundamental analysis methods. It signals a potential reversal from a downtrend to an uptrend, driven by a significant shift in market sentiment. Proper risk management and confirmation strategies are essential for leveraging this pattern effectively.


              Certainly! Let's delve even deeper into the specifics of the Bullish Kicker Pattern, including its identification, advanced strategies, and practical considerations.

              Detailed Identification:
              First Candlestick:

              Typically forms as part of a downward trend.
              Appearance: A long bearish candlestick (black or red) indicating strong selling pressure.
              Closing Price: Ends the day lower than its opening price.
              Second Candlestick:

              Opening Price: Opens significantly higher than the close of the first candlestick, creating a gap up.
              Appearance: A long bullish candlestick (white or green) indicating strong buying pressure.
              Closing Price: Closes higher than its opening price, often near the high of the day, showing sustained buying interest throughout the session.
              Advanced Strategies:
              1. Confirmation and Volume Analysis:
              Confirmation Candlestick: Look for the third candlestick to also be bullish, reinforcing the trend reversal.
              Volume: High volume on the second candlestick adds credibility to the pattern. Increasing volume on the third day further supports the bullish case.
              2. Use with Other Technical Indicators:
              Moving Averages: Check if the second candlestick crosses above key moving averages (e.g., 50-day or 200-day). This can be a strong signal of a trend change.
              Relative Strength Index (RSI): An RSI moving from oversold towards the neutral or overbought zone can complement the Bullish Kicker Pattern.
              MACD (Moving Average Convergence Divergence): A bullish crossover (where the MACD line crosses above the signal line) can confirm the trend reversal indicated by the Bullish Kicker Pattern.
              3. Support and Resistance Levels:
              Support Levels: The gap-up should ideally occur near a recognized support level, making the pattern more reliable.
              Resistance Levels: Identify potential resistance levels for setting profit targets. If the second candlestick closes above a resistance level, it may become a new support level.
              Practical Considerations:
              1. Market Context:
              Broader Market Trends: Ensure the overall market sentiment aligns with your analysis. A Bullish Kicker Pattern in a generally bearish market might not be as reliable.
              News and Events: Major news or events causing the gap up should be evaluated. Positive earnings reports, product launches, or macroeconomic developments can provide context to the pattern.
              2. Risk Management:
              Position Sizing: Use a consistent percentage of your trading capital for each trade to manage risk. Avoid overcommitting to a single trade.
              Stop-Loss Placement: Place stop-loss orders just below the gap-up or the low of the second candlestick. Adjust based on your risk tolerance and the stock's volatility.
              Trailing Stops: Use trailing stops to lock in profits as the price moves in your favor.
              Real-World Examples:
              Example 1:
              Stock ABC has been in a downtrend, closing lower for several consecutive days.
              Day 1: Stock closes at $40.
              Day 2: Positive earnings report released overnight. Stock opens at $45 (gap up) and closes at $50, forming a long bullish candlestick.
              Day 3: Stock continues to rise, confirming the trend reversal.
              Example 2:
              Stock XYZ has been declining amid overall market weakness.
              Day 1: Stock closes at $30.
              Day 2: Market sentiment shifts due to a favorable economic report. Stock opens at $35 (gap up) and closes at $40.
              Day 3: Stock maintains the upward momentum, supported by high trading volume.
              Broader Trading Strategy:
              Pre-Trade Analysis:

              Conduct thorough technical and fundamental analysis.
              Ensure the Bullish Kicker Pattern fits within your overall market outlook and strategy.
              Trade Execution:

              Enter the trade after confirming the pattern with the next candlestick or additional indicators.
              Monitor the trade closely, adjusting your strategy based on market conditions and new information.
              Post-Trade Review:

              Analyze the trade outcome to understand what worked and what didn’t.
              Use the insights to refine your strategy and improve future trading decisions.
              Summary:
              The Bullish Kicker Pattern is a potent reversal signal indicating a shift from bearish to bullish sentiment. Understanding its formation, integrating it with other technical tools, and practicing disciplined risk management are crucial for effectively leveraging this pattern. By considering the broader market context and employing advanced trading strategies, traders can enhance their chances of capitalizing on this bullish reversal signal.
              • #8 Collapse

                Bullish Kicker Pattern?
                Click image for larger version

Name:	download (43).jpeg
Views:	13
Size:	12.7 کلوبائٹ
ID:	13012122
                **Bullish Kicker Pattern (Roman Urdu)**
                **Introduction (Mud introduction):**
                Bullish Kicker pattern forex trading mein aik significant candlestick pattern hai jo ke price action analysis mein istemal hota hai. Ye pattern typically bearish trend ke baad reversal ke liye indicator ke tor par consider kiya jata hai aur traders ke liye useful tool hai market trends ko identify karne mein.

                **Mud working principle (kaam karne ka usool):**
                Bullish Kicker pattern do candlesticks se bana hota hai. Pehla candlestick bearish trend mein hota hai, jo ke strong selling pressure indicate karta hai. Dusra candlestick (bullish candle) uss se seedha opposite hota hai jis mein price gap up ke saath open hoti hai aur throughout the session price upar hi rehti hai. Is pattern mein second candle first candle ke low se higher close hoti hai, jo ke bullish reversal ke indication hai.

                **Fawaid (Benefits):**
                1. **Reversal Signal (Palatne Ki Alamat):** Bullish Kicker pattern bearish trend ke baad ek strong reversal signal provide karta hai. Jab market downtrend mein hota hai aur Bullish Kicker pattern form hota hai, to ye bullish reversal ke liye ek potent signal hai.

                2. **Confirmation of Momentum (Momentum Ki Tasdeeq):** Is pattern mein gap up opening aur strong bullish candle se saabit hota hai ke buying pressure dominant ho rahi hai. Ye traders ko market sentiment ke baray mein clarity provide karta hai.

                3. **High Probability Setup (Bala Tadad Mohdud Setup):** Bullish Kicker pattern high probability setup hai kyunki iska formation clear aur distinct hota hai jo ke easy identification aur interpretation allow karta hai.

                **Challenges (Chunautiyan):**
                1. **False Signals (Galat Signals):** Kabhi kabhi Bullish Kicker pattern false signals bhi generate kar sakta hai, especially volatile markets mein. Isliye confirmatory indicators ki zarurat hoti hai pattern ki validity ko confirm karne ke liye.

                2. **Market Context (Market Mahaul):** Bullish Kicker pattern ke istemal mein market context ka bhi zaruri role hota hai. Agar overall market trend ya volatility strong hai to is pattern ki accuracy affected ho sakti hai.

                **Nateeja (Conclusion):**
                Bullish Kicker candlestick pattern forex traders ke liye ek powerful tool hai bullish reversal points identify karne mein. Iska istemal sahi tareeqe se karne se traders ko trading decisions improve karne mein madad milti hai aur unhe profitable opportunities identify karne mein madad milti hai. Lekin, is pattern ke istemal mein caution aur confirmatory indicators ka istemal zaruri hai taake false signals se bacha ja sake. Is tarah, technical analysis ke is important aspect ko samajh kar traders apni trading strategy ko enhance kar sakte hain.
                • #9 Collapse

                  Bullish Kicker Pattern in Forex

                  1. Introduction to Bullish Kicker Pattern


                  Bullish Kicker pattern forex trading mein ek mukhtasar reversal pattern hai jo market ke trend changes ko anticipate karne mein madad deta hai. Yeh typically do candlesticks se bana hota hai jahan pehla candlestick bearish trend ko demonstrate karta hai aur dusra candlestick sudden bullish momentum ke sath open hota hai, jisse bullish trend ka onset indicate hota hai.
                  2. Components of Bullish Kicker Pattern


                  Bullish Kicker pattern mein do mukhtalif candlesticks hote hain jo isko define karte hain:
                  • Pehla candlestick: Yeh typically lamba bearish candle hota hai jo downtrend ko represent karta hai. Iski body bari hoti hai aur iske open price se close tak downward movement hota hai.
                  • Dusra candlestick: Iska open price pehle candlestick ke close price se higher hota hai. Yeh sudden bullish reversal ko signal karta hai aur iski body pehle candlestick ki body ke andar hoti hai, indicating strong buying pressure and reversal of sentiment.
                  3. Recognition of Bullish Kicker Pattern


                  Bullish Kicker pattern ko identify karne ke liye traders ko kuch key aspects pe focus rakhna hota hai:
                  • Pehla candlestick bearish trend ko indicate karta hai aur typically long body ke sath hota hai.
                  • Dusra candlestick pehle candlestick ke close price se higher open karta hai aur strong bullish momentum show karta hai.
                  4. Importance of Volume


                  Bullish Kicker pattern ki confirmation ke liye volume ka bhi dehan rakhna zaroori hai. Agar dusre candlestick ke sath volume bhi increase hota hai, to yeh pattern aur bhi reliable hota hai. Volume ki kami mein pattern ki validity pe shak hota hai kyunki strong reversal ke liye sufficient market participation zaroori hoti hai.
                  5. Bullish Kicker Pattern ka Use Kaise Karein?


                  Is pattern ka use karne ke liye traders ko market conditions, price action, volume trends aur overall market sentiment ko analyze karna chahiye. Agar confirmatory factors jaise ki volume aur price action sahi hain, to traders entry points aur trading strategies ko define kar sakte hain.
                  6. Bullish Kicker Pattern ka Trading Strategy


                  Bullish Kicker pattern ko trading strategy mein incorporate karne ke liye traders ko entry aur exit points ko clearly define karna hota hai:
                  • Entry point: Dusre candlestick ke open price pe buy stop order lagaya ja sakta hai.
                  • Stop loss: Pehle candlestick ke low ke niche stop loss lagana advisable hota hai taki downside risk minimize ho sake.
                  7. Bullish Kicker Pattern aur Risk Management


                  Har trading strategy ki tarah, Bullish Kicker pattern ka use karte waqt bhi proper risk management principles ko follow karna zaroori hai. Position size, stop loss levels aur profit targets ko determine karne se pehle risk-reward ratio ko evaluate karna crucial hota hai.
                  8. Bullish Kicker Pattern ke Benefits


                  Bullish Kicker pattern ka use karne se traders ko kai faide hote hain:
                  • Early Reversal Signals: Yeh pattern early reversal points ko identify karne mein madad karta hai, jisse traders early entry points find kar sakte hain.
                  • Potential for Higher Profits: Sudden bullish momentum ke sath, higher profits ka potential increase hota hai.
                  • Confirmation with Other Indicators: Is pattern ki accuracy ko improve karne ke liye traders aur bhi confirmatory indicators jaise ki moving averages, RSI, aur trend lines ka use kar sakte hain.
                  9. Real-life Examples of Bullish Kicker Pattern


                  Market mein Bullish Kicker pattern ke kai examples dekhne ko milte hain jo current market trends mein is pattern ko demonstrate karte hain. Example ke liye, recent bullish reversals in major currency pairs ya commodities market ke movements ko analyze karke traders is pattern ko identify kar sakte hain.
                  10. Comparison with Other Patterns


                  Bullish Kicker pattern ko doosre bullish reversal patterns jaise ki Bullish Engulfing, Piercing Pattern, ya Hammer ke sath compare kiya ja sakta hai. Har pattern ki apni unique characteristics hoti hain jo unhe alag aur effective banati hai. Comparisons se traders ko market dynamics aur reversal signals ko better understand karne mein madad milti hai.
                  11. Bullish Kicker Pattern ka Backtesting


                  Bullish Kicker pattern ka historical data pe backtesting karke traders apne strategies ko refine kar sakte hain aur iske performance metrics ko analyze kar sakte hain. Backtesting se traders pattern ki reliability aur effectiveness ko test kar sakte hain different market conditions mein.
                  12. Bullish Kicker Pattern ki Psychological Aspect


                  Yeh pattern market sentiment aur investor psychology ko bhi reflect karta hai. Is pattern ke sudden bullish reversal signals se, market participants ke behavior mein optimism aur buying interest ka shift hota hai. Psychological aspect ko samajh kar traders apne trading decisions ko better manage kar sakte hain.
                  13. Conclusion


                  Bullish Kicker pattern forex traders ke liye ek valuable tool hai jo market trends ke changes ko identify karne mein madad deta hai. Is pattern ki proper understanding aur sahi implementation se traders apni trading strategies ko enhance kar sakte hain aur profitable trading decisions lene mein madad hasil kar sakte hain. Bullish Kicker pattern ki study karne se, traders ko market ke reversal points ko early stage pe recognize karne ka capability develop hota hai, jisse unhe competitive advantage milta hai.
                  14. Final Thoughts


                  Yeh article Bullish Kicker pattern ke mukammal tajziya aur uske istemal ke tareeqon ko cover karta hai. Forex trading mein success ke liye, traders ko patterns ko samajhna aur unhe effectively use karna zaroori hai. Bullish Kicker pattern ki study karke, traders apni trading acumen ko improve kar sakte hain aur profitable trading decisions lene mein madad hasil kar sakte hain. Is pattern ka proper use karne se, traders ko market ke dynamics ko better understand karne mein madad milti hai aur unhe potential profitable opportunities identify karne mein help milti hai.

                  Is tarah se, Bullish Kicker pattern ek powerful tool hai jo traders ko market ke reversal points ko identify karne mein madad deta hai aur unhe potential profitable opportunities provide karta hai.
                  • #10 Collapse

                    "Bullish Kicker Pattern" in forex

                    Forex yaani foreign exchange market aik bohat bara aur dynamic market hai. Is main technical analysis aik bohot important role play karta hai. Technical analysis main candlestick patterns bohat ahmiyat rakhtay hain. Aik bohot hi important candlestick pattern "Bullish Kicker Pattern" hai.

                    Bullish Kicker Pattern Kya Hai?

                    Bullish Kicker Pattern do candlesticks par mabni hota hai. Ye pattern aksar tab dekha jata hai jab market ek strong bearish trend se bullish trend ki taraf move karne lagta hai. Pehli candlestick bearish hoti hai jo ke downtrend ko show karti hai, jabke doosri candlestick bullish hoti hai jo ke ek naya trend start honay ka signal deti hai.
                    Click image for larger version

Name:	download.png
Views:	10
Size:	4.9 کلوبائٹ
ID:	13020527
                    Is Pattern Ki Pehchan

                    Is pattern ko pehchan-ne ke liye kuch khas points hain jo dhyan mein rakhne zaroori hain


                    Pehli Candlestick
                    Pehli candlestick ek lambi bearish candle hoti hai jo ke strong selling pressure ko indicate karti hai.


                    Doosri Candlestick

                    Doosri candlestick pehli candle ke close hone ke baad next day open hoti hai aur wo open hoti hai pehli candle ke opening price se upar. Ye candlestick bullish hoti hai aur aik lamba green body show karti hai.

                    Is Pattern Ki Ahmiyat

                    Bullish Kicker Pattern ko technical analysts bohot serious lete hain kyunki ye pattern aksar market ke trend reversal ko indicate karta hai. Ye pattern tab banta hai jab market participants ka sentiment ekdum badal jata hai aur strong selling pressure ke baad strong buying pressure aa jata hai.

                    Is Pattern Ko Trade Karna

                    Entry Point
                    Jab doosri bullish candle form hoti hai aur confirm hoti hai, tab trader entry le sakta hai. Doosri candle ke close hone ke baad trade mein enter karna safe rehta hai.

                    Stop Loss
                    Stop loss ko pehli bearish candle ke niche rakhna chahiye. Ye risk ko control karne ke liye zaroori hai.

                    Take Profit

                    Profit booking ke liye resistance levels ko target karna chahiye. Fibonacci retracement levels ko bhi use kiya ja sakta hai.

                    Example

                    Maan lijiye ke GBP/USD ka pair ek downtrend mein tha. Aik din pehli bearish candle banti hai jo market ka sentiment show karti hai. Agle din, doosri bullish candle banti hai jo pehli candle ke opening price se upar open hoti hai aur ek lamba bullish body show karti hai. Ye bullish kicker pattern ka signal hai aur trader is point par buying kar sakta hai.

                    Pattern Ka Reliability

                    Har candlestick pattern ki tarah, Bullish Kicker Pattern bhi 100% accurate nahi hota. Isko doosre technical indicators ke sath confirm karna zaroori hai jaise ke moving averages, RSI, aur MACD. Ye additional confirmation tools risk ko kam karne mein madadgar hotay hain.

                    Note

                    Bullish Kicker Pattern aik powerful candlestick pattern hai jo trend reversal ko indicate karta hai. Forex market mein is pattern ko samajhna aur sahi tarike se use karna bohot faidemand ho sakta hai. Magar, kisi bhi trade ko enter karne se pehle hamesha doosre indicators aur market conditions ko dekhna chahiye taake risk ko control kiya ja sake aur profit ki chances barha sake.


                    • #11 Collapse

                      **Bullish Kicker Pattern**
                      Bullish Kicker pattern forex aur stocks trading mein ek strong bullish reversal signal hai jo market trends ko identify karne mein help karta hai. Is article mein hum Bullish Kicker pattern ke baare mein detail se baat karenge, uske characteristics aur trading strategies par focus karenge.

                      **Bullish Kicker Pattern Kya Hai?**

                      Bullish Kicker pattern ek candlestick pattern hai jo typically downtrend ke baad form hota hai. Is pattern mein do consecutive candles involved hote hain: pehla candlestick bearish hota hai aur doosra candlestick bullish hota hai, jise kiye bina gap ke open hota hai, indicating sudden bullish sentiment aur possible trend reversal.

                      **Bullish Kicker Pattern ke Characteristics:**

                      1. **First Candle (Bearish):** Pehla candlestick downtrend mein form hota hai aur bearish hota hai, indicating selling pressure.

                      2. **Second Candle (Bullish):** Doosra candlestick gap up ke saath open hota hai aur bullish move show karta hai. Is candle ka close typically first candle ke upper half mein hota hai.

                      3. **No Overlap:** Bullish Kicker pattern mein first aur second candlesticks ke between no overlap hota hai, jo ki strong bullish sentiment ko indicate karta hai.

                      **Bullish Kicker Pattern ki Recognition:**

                      Bullish Kicker pattern ko recognize karne ke liye traders ko kuch key points par dhyan dena hota hai:

                      - Doosre candle ka open first candle ke close se higher hona chahiye.
                      - Doosre candle ka close first candle ke upper half mein hona chahiye.
                      - Volume ki bhi analysis important hoti hai, jisme increasing volume bullish move ko confirm karta hai.

                      **Bullish Kicker Pattern ki Trading Strategy:**

                      1. **Confirmation:** Bullish Kicker pattern ko confirm karne ke liye next candlestick ka price action observe karna important hai. Agar next candle bhi bullish hai aur volume strong hai, toh pattern ki validity increase hoti hai.

                      2. **Entry Point:** Bullish Kicker pattern ke high par entry karna ek common strategy hai. Stop loss low par rakhna recommended hota hai, jo ki risk management ko improve karta hai.

                      3. **Target:** Target Fibonacci retracement levels aur resistance levels par set kiya jata hai, jo ki price movement aur market volatility ke according adjust kiya ja sakta hai.

                      **Conclusion:**

                      Bullish Kicker pattern ek potent bullish reversal signal hai jo traders ko market trends ko identify karne mein madad karta hai. Is pattern ko recognize karna aur sahi time par implement karna traders ke liye critical hai. Technical analysis ke saath sahi risk management aur disciplined approach se, traders Bullish Kicker pattern ki signals ko effectively utilize kar profitable trading opportunities create kar sakte hain.
                      • <a href="https://www.instaforex.org/ru/?x=ruforum">InstaForex</a>
                      • #12 Collapse

                        **Bullish Kicker Pattern**
                        Bullish Kicker pattern ek powerful bullish reversal pattern hai jo price action analysis mein use hota hai. Yeh pattern price trend ka sudden reversal indicate karta hai, jahan bearish trend ke baad ek strong bullish move start hota hai.

                        **Characteristics of Bullish Kicker Pattern:**

                        1. **Formation:** Bullish Kicker pattern ek do-candlestick pattern hai. Pehli candlestick bearish candle hoti hai jo normal trading range ke andar hoti hai. Dusri candlestick ek strong bullish candle hoti hai jo pehli candle ke lower range se start hoti hai aur uske upar close hoti hai.

                        2. **Volume:** Pattern ke breakout ke samay volume ka increase bhi ek important confirmation hai. Ideally, dusri candlestick ke volume pehli candlestick ke volume se significantly zyada hona chahiye.

                        3. **Gap:** Bullish Kicker pattern mein often ek small gap bhi ho sakta hai pehli aur dusri candlestick ke beech mein, indicating strong buying pressure.

                        **Trading the Bullish Kicker Pattern:**

                        Bullish Kicker pattern ko trade karne ke liye traders usually following steps follow karte hain:

                        1. **Confirmation:** Traders pattern ki confirmation ke liye wait karte hain ki dusri candlestick pehli candlestick ke low se upar close ho.

                        2. **Entry Point:** Entry point usually dusri candlestick ke high ke upar entry kiya jata hai, jab pattern ki confirmation ho gayi ho.

                        3. **Stop-loss Placement:** Stop-loss level ko determine karte waqt traders pehli candlestick ke low ke just neeche ya pattern ke breakout point ke neeche set karte hain, taki in case of reversal loss minimized ho sake.

                        4. **Target Calculation:** Bullish Kicker pattern ke height se target calculate kiya jata hai, jo pattern ki size se approximate kiya jata hai.

                        **Example:**

                        Maan lijiye ki ek stock ki price ek bearish trend mein hai aur ek din ek bearish candlestick ke baad agle din ek strong bullish candlestick form hoti hai jo pehli candle ke low se upar close hoti hai. Is scenario mein, yeh ek bullish kicker pattern ki confirmation ho sakti hai, indicating potential reversal.

                        **Conclusion:**

                        Bullish Kicker pattern ek strong bullish reversal signal hai jo traders ko potential entry points provide karta hai. Is pattern ki effective use ke liye thorough analysis aur proper risk management zaroori hai. Traders ko pattern ki confirmation ke liye wait karna chahiye aur false signals se bachne ke liye caution maintain karni chahiye.

                        Agar aapko bullish kicker pattern ya kisi aur technical analysis technique ke baare mein aur jaankaari chahiye, toh comment karein aur hum aapki madad karenge!

                        اب آن لائن

                        Working...
                        X