Where to find Imbalance for Trading Opportunities.

No announcement yet.
`
X
  • وقت
  • دکھائیں
Clear All
new posts
  • #16 Collapse

    ### Trading Opportunities Ke Liye Imbalance Kahan Dhoondein?
    Trading mein imbalance ka concept bohot ahmiyat rakhta hai. Jab market mein buyers aur sellers ke darmiyan balance na ho, to isse trading opportunities ka janm hota hai. Is post mein, hum dekhenge ke aap imbalance kahan dhoond sakte hain taake profitable trades hasil kar sakein.

    **1. Technical Analysis:**

    Technical analysis ke zariye aap charts par price action ko dekh kar imbalance identify kar sakte hain. Jab price kisi level par tezi se move karti hai, to ye darshata hai ke wahan par buyers ya sellers ka dominance hai. Is tarah ke price movements ke darmiyan gaps ya significant price changes imbalance ke nishani hote hain.

    **2. Support aur Resistance Levels:**

    Support aur resistance levels par bhi imbalance ki talash karna zaroori hai. Jab price support level ko todti hai, to ye indicate karta hai ke sellers ki taqat barh rahi hai. Is waqt aapko short position lene ka sochna chahiye. Uske baraks, agar price resistance level ko todti hai, to buyers ki taqat ka signal milta hai, jo long position lene ka mauqa de sakta hai.

    **3. Economic News Events:**

    Economic news aur data releases bhi market mein imbalance create kar sakte hain. Jab koi major news announce hoti hai, to market mein tezi se movement hoti hai. Traders ko chahiye ke wo economic calendars ka istemal karein taake ye jaan sakein ke kab kab important news aane wali hai. Is waqt imbalance dhoondna profitable ho sakta hai.

    **4. Order Flow Analysis:**

    Order flow analysis ke zariye aap market ki real-time activity ko samajh sakte hain. Jab aap dekhte hain ke kis taraf zyada orders lag rahe hain, to ye imbalance ka signal hota hai. Agar aapko zyada buying orders nazar aate hain, to ye bullish momentum ka indication hai, jabke zyada selling orders bearish momentum ko darshate hain.
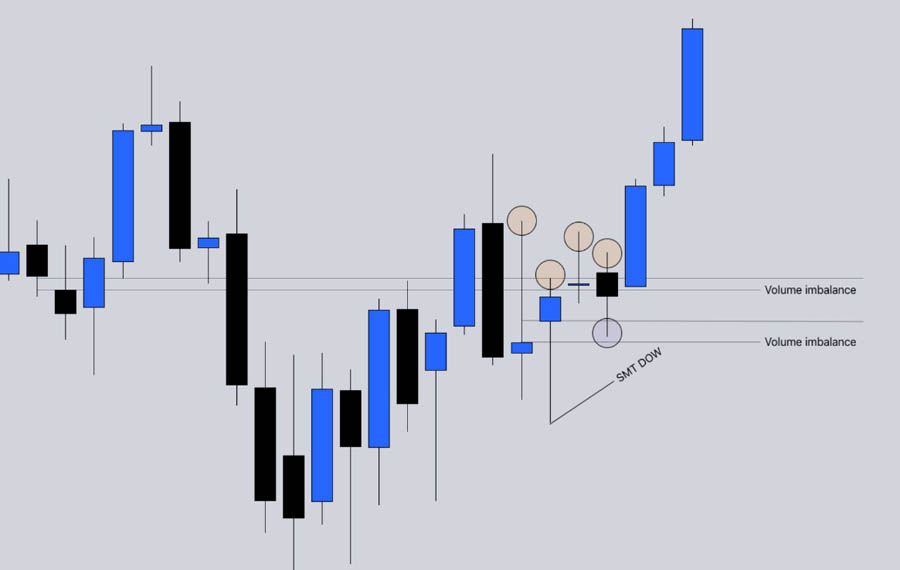
    **5. Volume Analysis:**

    Volume analysis bhi imbalance dhoondne ka ek effective tareeqa hai. Jab price kisi specific direction mein move karti hai aur volume high hota hai, to ye imbalance ko darshata hai. High volume ke sath price ki movement aapko confirm karti hai ke market mein strong interest hai.

    **Conclusion:**

    Imbalance dhoondna trading ke liye ek ahmiyat rakhta hai, kyunki ye profitable opportunities ka signal deta hai. Technical analysis, support aur resistance levels, economic news events, order flow analysis, aur volume analysis ka istemal karke aap in imbalances ko identify kar sakte hain. Hamesha yaad rakhein ke market dynamics aur risk management ko samajhna bhi bohot zaroori hai taake aap apni trading strategy ko behtar bana sakein.
       
    • <a href="https://www.instaforex.org/ru/?x=ruforum">InstaForex</a>
    • #17 Collapse

      Where to Find Imbalance for Trading Opportunities
      Trading mein imbalance ka matlab hota hai jab market mein supply aur demand ka balance disturb ho jata hai. Yeh imbalance trading opportunities create karta hai jahan price jaldi se move kar sakti hai. Agar aap yeh imbalance identify kar lein, to aap profit karnay kay liye behtar trades le sakte hain. Imbalance ko dhoondhne ke kai tareeqay hain jo neechay detail mein explain kiye gaye hain.

      1. Price Action Analysis

      Price action analysis ek best method hai imbalance ko dhoondhnay ke liye. Yeh aapko price ki movement ko samajhne mein madad karta hai. Jab aap chart ko dekhte hain, to wahan par rapid price movements ko notice karein. Yeh wo jagahain hain jahan buyers ya sellers ki strength zyada hoti hai, jis ki wajah se imbalance hota hai. Yeh levels future mein bhi trading opportunities provide kar sakte hain.

      2. Order Blocks

      Order blocks imbalance ko samajhne ka ek aur effective tool hain. Yeh usually wo areas hotay hain jahan institutional traders ne apne large orders place kiye hote hain. Jab market wapas in order blocks ki taraf aati hai, to wahan se market phir se move karne lagti hai kyun ke wahan par phir se imbalance create ho sakta hai. Aapko yeh zones identify karke unko watch list mein rakhna chahiye.

      3. Volume Profile

      Volume profile bhi imbalance ko samajhne mein madadgar hai. Yeh aapko dikhata hai ke kis price level par zyada volume trade hua hai. Jab aap volume profile ko analyze karte hain, to aap easily identify kar sakte hain kahan par high volume aur kahan par low volume traded hai. Low volume areas imbalance zones hain jo future mein strong price moves create kar sakte hain.

      4. Supply and Demand Zones

      Supply aur demand zones imbalance ko find karne ke liye commonly used tools hain. Supply zone wo jagah hoti hai jahan par sellers active ho jaate hain, aur demand zone wo jahan buyers strong hote hain. Jab price in zones par aati hai to imbalance ki wajah se strong price movement dekhne ko milti hai. Yeh levels future trades ke liye important hain.

      5. News and Economic Events

      Economic news aur major events bhi imbalance create kar sakte hain. News ke release ke time par market mein kaafi volatility aati hai, jisse imbalance hota hai. Traders ko important economic calendar events ko monitor karna chahiye taake wo in imbalance opportunities ka fayda utha sakein.

      Conclusion

      Imbalance trading mein ek powerful concept hai jo aapko high probability trading opportunities provide karta hai. Yeh imbalance price action, order blocks, volume profile, supply and demand zones, aur news events se identify kiya ja sakta hai. In techniques ko use karke aap apne trading skills ko enhance kar sakte hain aur market mein behtar decisions le sakte hain.


      • #18 Collapse

        Imbalance ko samajhna trading ka aik ahem hissa hai. Jab bhi market mein imbalance hota hai, iska matlab hai ke buyers aur sellers ka ratio barabar nahi hai. Yeh imbalance trading opportunities ko janam deta hai, kyun ke jab demand aur supply barabar nahi hote, to price ka movement zyada hota hai. Imbalance ki pehchan karna aur usko samajhna, trader ko fayda deta hai aur wo isko leverage karke apni position banata hai.
        Imbalance ka pehla signal hamesha price movement hota hai. Jab price rapidly upar ya neeche jaata hai, to iska matlab hota hai ke buyers ya sellers mein se koi ek dominant hai. Agar price tez se upar jaata hai to iska matlab hai ke buyers zyada hain aur sellers kam, aur agar price tez se neeche jaata hai to iska matlab hai ke sellers zyada hain aur buyers kam. Is tarah ke movements market mein imbalance ko show karte hain.

        Doosra indicator order flow hota hai. Order flow ko dekhne ke liye aapko level 2 data ya DOM (Depth of Market) ka use karna hota hai. Yeh data aapko batata hai ke market mein kitne buy aur sell orders hain. Agar ek side par orders zyada hain to us side ka imbalance aapko nazar aayega. Misal ke taur par, agar buy side par zyada orders hain, to price ka upar jaana expected hoga. Agar sell side par zyada orders hain, to price neeche jaane ka imkaan hota hai.

        Teesra tareeqa volume profile ka hota hai. Volume profile ko dekhne se aapko samajh aata hai ke kis price level par kitna volume trade hua hai. Jahaan zyada volume hota hai, wahan price stable rehta hai kyun ke dono buyers aur sellers ka consensus hota hai. Lekin jahan volume kam hota hai, wahan price jaldi move karta hai kyun ke imbalance zyada hota hai. Isliye low volume areas ko dekhna aur wahan trading opportunities dhoondna aik acha tareeqa hai.

        Aik aur approach jo imbalance ko dhoondne mein madadgar hoti hai, wo hai liquidity traps. Jab market ka price jaldi move karta hai lekin phir uska reversal hota hai, to yeh liquidity trap ka indication ho sakta hai. Misal ke taur par, agar price suddenly neeche jaata hai lekin wapas jaldi se upar aata hai, to iska matlab hota hai ke sellers ne apni position exit kar di aur buyers dominate kar gaye. Is tarah ke liquidity traps ko dekh kar aap reverse trade kar sakte hain aur profit kama sakte hain.

        Imbalance ko samajhne ka aik aur tareeqa economic news aur events hain. Jab market mein koi major news release hoti hai, to demand aur supply ka imbalance create hota hai. Misal ke taur par, agar interest rates ka announcement hota hai, to market rapidly move karta hai. Aise waqt mein imbalance create hota hai kyun ke kuch traders expect nahi kar rahe hote ke price itna move karega, aur jo prepared hotay hain, wo is movement ka faida uthate hain.

        Akhir mein, psychological levels ka role bhi imbalance mein hota hai. Jab price major levels jese ke round numbers ya historical support/resistance levels ko touch karta hai, wahan imbalance banta hai kyun ke traders isko critical levels samajhte hain. Aise waqt mein buyers ya sellers ki ek taraf se zyada pressure hota hai, aur price rapidly move karta hai. In levels ko dekh kar aap trading opportunities ko capitalize kar sakte hain.

        In sab techniques ko use karke, aap market mein imbalance dhoond kar profitable trading opportunities ko identify kar sakte hain. Yaad rahe ke imbalance sirf temporary hota hai, aur market ka balance wapas aa jata hai, lekin agar aap timely action lete hain to aapko is imbalance se fayda mil sakta hai


        • #19 Collapse

          ### Imbalance Kahan Dhoondhen: Trading Opportunities
          Trading mein imbalance se murad wo situations hain jahan market ki supply aur demand ke darmiyan ek significant farq hota hai. Ye imbalance trading opportunities create karta hai, jahan traders profit kama sakte hain. Is post mein, hum dekhenge ke imbalance ko kahan aur kaise dhoondha ja sakta hai.

          ### 1. Price Action Analysis

          Price action analysis se aap easily imbalance identify kar sakte hain. Jab price kisi specific level par tezi se badhti ya girti hai, to ye ek potential imbalance ka signal hota hai. Iske liye, aapko support aur resistance levels par focus karna hoga. Agar price kisi resistance level ko cross kar jaati hai, to ye indicate karta hai ke buyers zyada hain, aur yahan se sell pressure kam ho gaya hai.

          ### 2. Volume Analysis

          Volume analysis bhi imbalance ko dhoondhne ka ek effective tareeqa hai. Jab price movement ke sath volume mein bhi achi khasii increase hoti hai, to ye indicate karta hai ke market mein strong interest hai. Agar volume increase hota hai lekin price stagnant rehti hai, to ye imbalance ka signal hota hai. Aapko volume spikes par nazar rakhni chahiye, jo sudden price changes ko trigger kar sakte hain.

          ### 3. Economic News Events

          Economic news events jaise interest rate changes, employment reports, aur GDP announcements market mein significant imbalance create kar sakte hain. Jab koi important news release hoti hai, to ye supply aur demand ke balance ko disturb kar deti hai. Traders ko chahiye ke wo economic calendar ka istemal karein taake ye pata chale ke kab important news release hone wali hai, taake wo imbalance se faida utha sakein.

          ### 4. Technical Indicators

          Kuch technical indicators bhi imbalance dhoondhne mein madadgar hote hain. Jaise Moving Averages, Bollinger Bands, aur RSI (Relative Strength Index) ko use karke aap identify kar sakte hain ke market oversold ya overbought hai. Agar RSI 70 se zyada ho, to ye overbought condition ka signal hai, jo potential imbalance dikhata hai.

          ### 5. Market Sentiment

          Market sentiment bhi imbalance identify karne ka ek aham zariya hai. Jab traders ka mood bullish ya bearish hota hai, to wo market mein imbalance create kar sakte hain. Sentiment indicators jaise Fear and Greed Index ko dekh kar aap market ki overall sentiment samajh sakte hain.

          ### Aakhri Baat

          Imbalance ko dhoondhna trading mein ek ahem skill hai jo aapko profitable opportunities dhoondhne mein madad deti hai. Price action, volume analysis, economic news, technical indicators, aur market sentiment jaise tools ka istemal karke, aap imbalance ko identify kar sakte hain. Ye strategies aapki trading ko behtar banayengi aur aapko successful trading opportunities dhoondhne mein madad karegi.
           
          • #20 Collapse

            Where to Find Imbalance for Trading Opportunities


            Forex aur stock trading mein imbalance ek ahem concept hai jo traders ko behtareen trading opportunities dhoondhne mein madad deta hai. Imbalance ka matlab hai jab supply aur demand ka perfect balance na ho, aur market ek taraf zyada tilt kare. Jab yeh imbalance hota hai, prices tezi se move karti hain, aur traders is movement ka faida uthakar profit kama sakte hain.

            Is article mein hum imbalance ko samajhne ke liye 6 headings ke zariye tafseel se baat karenge:
            1. Imbalance Kya Hota Hai Trading Mein?


            Imbalance ka matlab hota hai jab market mein buyers ya sellers ka ghalib hona zyada ho, jisse price movement tezi se hoti hai. Jab buyers zyada hotay hain aur sellers kam, toh price rapidly upar jata hai. Isi tarah, jab sellers zyada hotay hain aur buyers kam, toh price girta hai.

            Imbalance ko samajhna is liye zaroori hai kyunki yeh market ke actual trend aur momentum ka andaza lagane mein madad karta hai. Agar ek trader imbalance areas ko identify kar sake, toh woh strong buying aur selling zones dhoondh sakta hai jo profitable trades execute karne mein madad denge.
            2. Imbalance Identify Karne Ke Tarike


            Imbalance ko dhoondhne ke bohat se tareeqe hain, magar kuch important strategies ye hain:
            A) Price Action Analysis


            Price action dekh kar imbalance ko identify kiya ja sakta hai. Agar kisi jagah price bohat tez move kare aur koi resistance na ho, toh wahan imbalance ho sakta hai.
            B) Volume Analysis


            Agar kisi level par volume bohat zyada ho aur price ek hi direction mein move kare, toh iska matlab hai ke imbalance mojood hai.
            C) Order Flow Analysis


            Agar order book mein ek taraf zyada orders hon aur doosri taraf kam, toh imbalance create hota hai. Is tarah ke imbalance ko institutional traders aksar exploit karte hain.
            D) Supply & Demand Zones


            Supply aur demand zones ko pehchanna bhi imbalance identify karne ka ek tareeqa hai. Jab price ek demand zone se rapidly upar jaye ya supply zone se neeche aaye, toh imbalance ka indication hota hai.
            3. Kahan Imbalance Zyada Hota Hai?


            Imbalance mostly un areas mein hota hai jahan market ka sudden reaction aata hai. Yeh kuch key areas hain jahan imbalance dhoondhna asaan hota hai:
            A) Support aur Resistance Levels


            Jahan price bar bar react karti hai, wahan imbalance develop ho sakta hai. Agar price ek resistance tod kar tez upar jaye, toh wahan buyers ka imbalance ho sakta hai.
            B) High Impact News Ke Baad


            Jab bhi high-impact news aati hai jaise NFP (Non-Farm Payroll), interest rate decisions, ya CPI reports, tab imbalance create hota hai. Market bohat tez move karti hai aur trading opportunities generate hoti hain.
            C) Institutional Trading Zones


            Bade traders aur banks ke specific levels hote hain jahan unka buying aur selling interest hota hai. Agar price rapidly kisi level se react kare, toh samajhna chahiye ke wahan imbalance ho sakta hai.
            D) Breakout aur Fakeout Levels


            Jahan breakout ya fakeout hota hai, wahan imbalance create ho sakta hai. Yeh zones bohat important hote hain scalpers aur intraday traders ke liye.
            4. Imbalance Se Profit Kaise Kamaya Jaye?


            Imbalance ko use karke profit kamaane ke liye kuch important strategies hain:
            A) Trend Continuation Trading


            Agar aapko imbalance ka pata chal jaye, toh aap trend continuation ke basis par trade kar sakte hain. Matlab agar price rapidly upar gayi hai aur imbalance create hua hai, toh retracement ka wait karein aur buy karein.
            B) Mean Reversion Strategy


            Kabhi kabhi price imbalance create karne ke baad wapas apni original level par aati hai. Is strategy ko mean reversion kehte hain. Iska faida uthakar short-term trades liye ja sakte hain.
            C) Breakout Trading


            Agar kisi jagah imbalance ho aur price rapidly move kare, toh breakout trading ka concept use kiya ja sakta hai. Matlab agar resistance tod kar price tez upar jaye, toh buy karein aur stop-loss breakout level ke neeche rakhein.
            5. Imbalance Ko Avoid Karne Wali Mistakes


            Imbalance ko samajhne ke bawajood kuch mistakes traders kartay hain jo unke profits ko impact karti hain. In mistakes ko avoid karna zaroori hai:
            A) Overtrading Karna


            Sirf imbalance dekh kar har trade lena sahi nahi hota. Hamesha confluence aur confirmation ka intezar karein.
            B) Stop Loss Na Lagana


            Imbalance zones volatile hote hain, is liye stop loss ka use zaroori hai. Warna market opposite direction mein chali jaye toh bada loss ho sakta hai.
            C) News Events Ko Ignore Karna


            Agar kisi news ke waqt imbalance develop ho raha hai, toh bina analysis ke trade lena risky ho sakta hai. Pehle dekhain ke price kis tarah react kar rahi hai.
            D) Market Ka Overanalysis Karna


            Bohat zyada analysis karna bhi ek mistake ho sakti hai. Imbalance identify karne ke baad simple strategy follow karna behtar hota hai.
            6. Conclusion


            Imbalance ek powerful tool hai jo trading opportunities dhoondhne mein madad deta hai. Yeh mostly high-impact areas, support-resistance levels, aur breakout zones mein develop hota hai. Isko samajhne aur sahi strategy use karne se profits maximize kiye ja sakte hain. Magar isko sahi tariqe se use karna zaroori hai, warna losses bhi ho sakte hain.

            Agar aap imbalance ka sahi analysis kar sakein aur risk management follow karein, toh forex aur stock trading mein consistently profit kama sakte hain.
            • <a href="https://www.instaforex.org/ru/?x=ruforum">InstaForex</a>
            • #21 Collapse

              Where to find Imbalance for Trading Opportunities
              Forex aur equity markets mein trading opportunities ko identify karna aksar technical analysis, price action aur volume analysis par depend karta hai. Ek ahem concept jo traders ko profit making opportunities detect karne mein madad karta hai, woh hai "imbalance". Imbalance ka matlab hai market mein supply aur demand ke beech ek tarah ka asamanta ya gap. Yeh imbalance price movement ko trigger karti hai aur isay trade karne se aapko significant price moves se faida uthana mumkin hota hai.

              Imbalance se murad hai jab buyers aur sellers ke darmiyan extreme difference ya gap hota hai. Jab market mein demand (buyers) ya supply (sellers) itni zyada ho jati hai ke price quickly ek level se dusre level par chali jati hai, to us area ko imbalance kehte hain. Yeh imbalance aksar order flow, liquidity, aur volume data se samjhi ja sakti hai.
              • Order Imbalance: Jab buy orders ya sell orders mein bohat fark hota hai, to order imbalance create hoti hai.
              • Liquidity Imbalance: Jab market mein liquidity unevenly distribute ho, ya kuch levels par liquidity bohat kam ho, to price un areas mein quickly move karti hai.
              • Volume Imbalance: Jab volume distribution uneven hoti hai, to woh price swings aur potential reversal points signal karti hai.

              Imbalance areas ko samajhne se traders ko yeh pata chalta hai ke market kis taraf jhuk rahi hai aur kahan par potential reversals ya continuations ho sakte hain.


              Where to Find Imbalance in the Market
              Imbalance trading opportunities aksar kuch specific areas aur time periods par milti hain:
              1. Price Gaps and Sharp Moves:
                Jab market mein price ek level se dusre level par without trading through all intermediate levels move karti hai, to woh gap create karti hai. Yeh gap ek imbalance indicate karti hai kyun ke buyers ya sellers market par itna pressure bana chuke hote hain ke poori liquidity use nahi hui. Forex market mein weekend gaps ya news gaps ke through yeh imbalance dekhi ja sakti hai.
              2. Support and Resistance Levels:
                Support aur resistance areas par liquidity concentration hoti hai. Jab price in levels par break hoti hai aur rapid move karti hai, to yeh imbalance ka signal hota hai. For example, agar price ek strong support level par trade kar rahi ho aur phir suddenly break ho jaye, to yeh indicate karta hai ke selling pressure kam ho gaya hai aur buyers dominate karne lage hain.
              3. Order Flow Imbalances in the Order Book:
                Agar aap Level II data ya order book analysis use karte hain, to aap dekh sakte hain ke buy orders aur sell orders mein kitna farq hai. Jab ek taraf se orders ki density kam ho, to us area mein liquidity imbalance hoti hai. Yeh imbalance aapko short-term price movements ke liye entry aur exit points dikhata hai.
              4. Volume Profile Analysis:
                Volume profile ek aisa tool hai jo specific price levels par traded volume ko highlight karta hai. Agar aap dekhen ke koi level par volume bohat kam hai, to iska matlab hai ke liquidity low hai aur imbalance ke chances zyada hain. Conversely, high volume nodes indicate strong liquidity areas jahan imbalance recover hone ke chances ho sakte hain.
              5. News and Economic Events:
                Major economic news ya unexpected events se market reaction mein extreme moves dekhne ko milte hain. Aise waqt mein imbalance create hoti hai kyun ke market participants jaldi decision lete hain aur orders ek tarah se execute ho jate hain. Economic calendar ko monitor karna is liye bohat zaroori hai, taake aap in imbalances ko identify kar sakein.


              Technical Tools to Identify Imbalance
              Imbalance ko identify karne ke liye kuch technical tools aur indicators bohat madadgar sabit hote hain:
              1. Order Flow Software:
                Order flow analysis tools aapko real-time data dete hain ke market mein buy aur sell orders kitne hain. Is se aap dekh sakte hain ke kis price level par imbalance create ho rahi hai. Tools jaise Footprint Chart ya Market Profile aapko detailed order flow information provide karte hain.
              2. Volume Profile Indicator:
                Volume profile indicator se aap price levels par trade hua volume dekh sakte hain. Aap easily identify kar sakte hain ke low volume areas (imbalanced zones) aur high volume nodes (liquidity clusters) kaha hain. Yeh indicator aapko market structure aur potential reversal areas dikhata hai.
              3. Price Action Analysis:
                Simple price action techniques bhi imbalance ko samajhne mein madad karti hain. Sharp candlestick moves, engulfing patterns, aur gaps aapko batate hain ke market mein imbalance hai. Agar aap clear directional candles ya rapid moves dekhte hain, to yeh imbalance ke indicators ho sakte hain.
              4. Support and Resistance Indicators:
                Automated support aur resistance tools, jese Pivot Points, Fibonacci levels, aur trendlines, help karte hain imbalance zones ko identify karne mein. Jab price break in levels par hoti hai, to aapko imbalance ke chances samajh aate hain.


              Practical Trading Strategies Using Imbalance
              Imbalance areas ko trade karne ke liye kai strategies use ki ja sakti hain:
              1. Gap Fill Strategy:
                Agar aap gap ya imbalance area dekhte hain, to aksar market us gap ko fill karne ki koshish karti hai. Is liye aap gap fill strategy use kar sakte hain. Aap entry lete hain jab price imbalance zone ke andar wapas aati hai, assuming ke gap eventually fill ho jayega.
              2. Breakout Trading:
                Jab price ek imbalance area se break out karti hai, to yeh strong directional move indicate karta hai. Aap breakout trade le sakte hain agar aap confirm kar sakein ke imbalance ke baad trend sustain rahega. Is case mein stop-loss ko tightly manage karna zaroori hai.
              3. Reversal Trading:
                Kabhi kabhi imbalance ke baad market overextended ho jati hai aur reversal ka chance ban jata hai. Agar aapko lagta hai ke imbalance extreme ho chuki hai, to aap reversal trade plan kar sakte hain. Is strategy mein confirmation signals jaise RSI divergence ya candlestick reversal patterns dekhna madadgar hota hai.
              4. Scalping with Order Flow:
                Short-term scalpers order flow analysis ka istemal kar ke imbalance zones ko target karte hain. Jab aap real-time order flow data dekhte hain, to aap quickly imbalance ke points identify kar sakte hain aur chhote timeframes par trades execute kar sakte hain.


              Risk Management When Trading Imbalances
              Imbalance trading high potential rewards ke sath sath high risk bhi laya sakti hai. Kuch zaroori risk management tips yeh hain:
              • Proper Position Sizing:
                Imbalance zones par trade karte waqt position size ko carefully manage karna bohat zaroori hai. Aapko apne account size ke mutabiq position size select karna chahiye, taake agar market against move kare to loss limited rahe.
              • Defined Stop-Loss Levels:
                Har trade ke liye stop-loss define karna bohat important hai. Agar market imbalance zone se quickly reverse ho jaye, to aapke stop-loss orders aapko large losses se bachayenge.
              • Multiple Timeframe Analysis:
                Imbalance zones ko multiple timeframes par confirm karna chahiye. Agar aap higher timeframe aur lower timeframe par similar imbalance zones dekhte hain, to signal zyada reliable hota hai.
              • Avoid Overtrading:
                Har imbalance zone par trade lena zaroori nahi. Kabhi kabhi market ki volatility aur liquidity conditions ko samajhna important hai. Overtrading se bachne ke liye sirf high probability setups par trade karein.


              Examples of Imbalance in Different Markets
              Imbalance trading opportunities har market mein mil sakti hain:
              • Forex Market:
                Forex market mein weekends ke baad ya economic news releases ke waqt imbalances dekhne ko milte hain. Jab major news release hoti hai, to price aksar ek direction mein quickly move karti hai, jisse imbalance zone create ho jata hai.
              • Equity and Futures Markets:
                Stocks aur futures contracts mein volume clusters aur order book data se imbalance areas identify kiye ja sakte hain. For example, earnings announcements ke baad stock price mein sharp moves imbalance ko indicate karte hain.
              • Cryptocurrency Market:
                Cryptocurrency markets mein liquidity uneven distribution ki wajah se imbalance zones frequently nazar aate hain. Kyun ke yeh market 24/7 chalti hai, kabhi kabhi low liquidity periods mein sudden moves dekhne ko milte hain jo imbalance ke signals hote hain.


              Imbalance trading opportunities aapko market ki underlying dynamics ko samajhne mein madad deti hain. Order flow, volume profile, aur price action analysis ke zariye aap easily identify kar sakte hain ke kis price level par market mein supply aur demand ke beech gap hai. Yeh imbalance zones aapko gap fill, breakout, ya reversal trades ke liye potential entry aur exit points provide karte hain.Forex, equity, futures, aur cryptocurrency markets mein imbalance identify karna ek advanced technique hai jo technical analysis ke sath-sath market sentiment ko bhi samajhne mein help karti hai. Is strategy ko effectively implement karne ke liye proper risk management, multiple timeframe confirmation, aur disciplined trading approach bohat zaroori hai. Har trader ko chahiye ke woh apne trading journal mein imbalance ke signals ko record kare aur continuously backtesting aur demo trading se is technique ko refine kare.
              Agar aap imbalance trading opportunities ko sahi tarah se identify kar lein, to yeh aapko market ke volatile moves se profit kamane ka ek efficient tareeqa provide karti hain. Yad rahe ke har market condition alag hoti hai, is liye har setup ko samajh kar aur risk management strategies ko follow karte hue hi trade karein. Consistency, discipline, aur continuous learning se hi imbalance trading se sustainable profitability hasil ki ja sakti hai.

              اب آن لائن

              Working...
              X