Introduction:
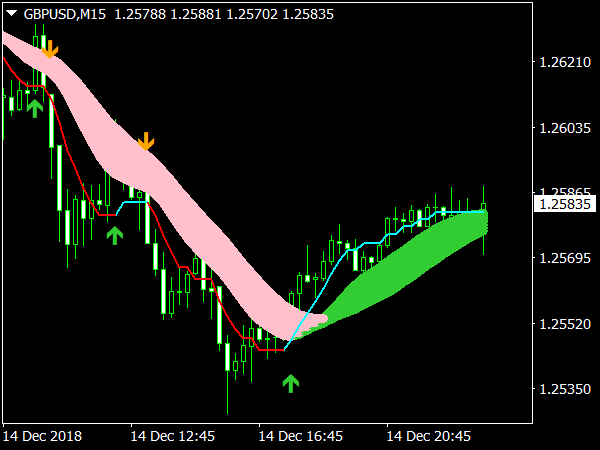
Forex trading main "Rainbow Indicators" aik advanced technical analysis tool hai jo multiple moving averages ko istimaal karta hai taake price trends aur market behavior ko analyze kar sake. Rainbow Indicators ka istemal kaise hota hai aur iske fayde kya hain, yeh hum niches headings main discuss karengay.
Rainbow Indicators Ka Taaruf:
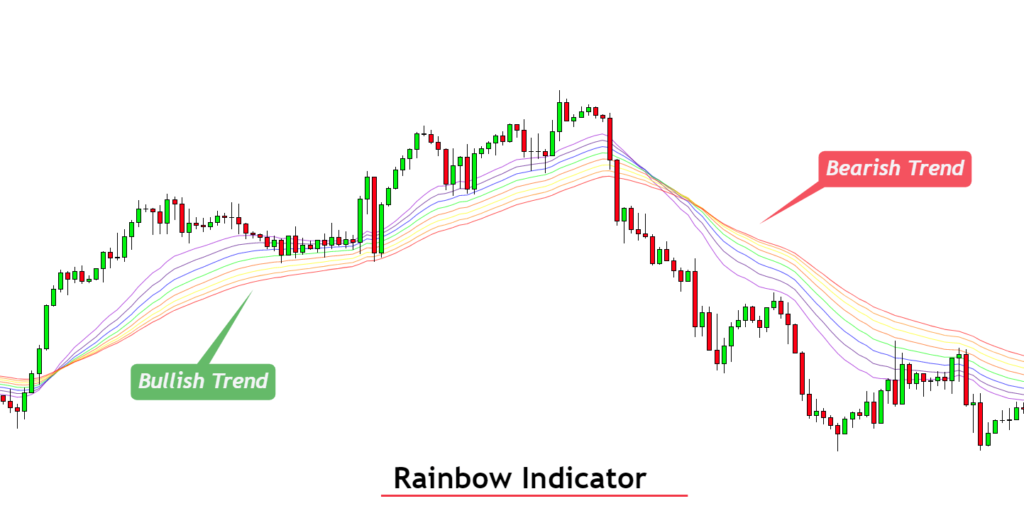
Rainbow Indicators ka basic concept yeh hai ke yeh different periods ki moving averages ko layer kartay hain, jo ek rainbow jaisa structure banaata hai. Yeh indicators price action ko smooth karte hain aur traders ko yeh samajhnay mein madad karte hain ke market ka trend kis direction mein hai.

Moving Averages Ki Qisamain:
Rainbow Indicators different qisam ki moving averages ko use karte hain:
- Simple Moving Average (SMA): Yeh average price ko aik specific period mein calculate karta hai.
- Exponential Moving Average (EMA): Yeh recent prices ko zyada weightage deta hai.
- Weighted Moving Average (WMA): Yeh har price ko aik specific weight assign karta hai.
Kaam Karne Ka Tareeqa:
Rainbow Indicators ko apply karne ka tareeqa yeh hai ke aap different time periods ki moving averages ko ek chart par overlay karte hain. Jab sab moving averages ek dosray se door hoti hain, toh yeh strong trend ko indicate karti hain. Jab yeh close hoti hain, toh yeh consolidation ya trend reversal ka ishara hoti hain.
Trend Identification:
Rainbow Indicators ka major faida yeh hai ke yeh trend identification mein madad karte hain. Jab price moving averages ke upar hoti hain, toh yeh uptrend ka indication hota hai. Jab price moving averages ke neeche hoti hain, toh yeh downtrend ka indication hota hai.
Support aur Resistance:
Rainbow Indicators ko support aur resistance levels ko identify karne ke liye bhi use kiya ja sakta hai. Multiple moving averages ek strong support ya resistance level ko indicate kar sakti hain, jahan se price reverse ho sakti hai.
Entry aur Exit Points:
Rainbow Indicators ko trade entry aur exit points ko identify karne ke liye bhi use kiya ja sakta hai. Jab price moving averages ko cross karti hai, toh yeh potential entry ya exit point hota hai.
Risk Management:
Rainbow Indicators risk management mein bhi madadgar hain. Yeh indicators stop-loss levels ko identify karne mein madad karte hain, jo traders ko losses minimize karne mein madad dete hain.
Rainbow Indicators Ki Limitations:
Har technical analysis tool ki tarah, Rainbow Indicators ki bhi kuch limitations hain. Yeh past data par based hote hain aur future market movements ko accurately predict nahi kar sakte. Over-reliance in par losses ka sabab ban sakta hai.

In summary, Rainbow Indicators aik powerful tool hai jo Forex traders ko market trends aur price movements ko better samajhne mein madad karta hai. Magar, yeh hamesha yaad rakhe ke yeh ek supplementary tool hai aur doosray analysis techniques ke saath istimaal karna chahiye.
Forex trading main "Rainbow Indicators" aik advanced technical analysis tool hai jo multiple moving averages ko istimaal karta hai taake price trends aur market behavior ko analyze kar sake. Rainbow Indicators ka istemal kaise hota hai aur iske fayde kya hain, yeh hum niches headings main discuss karengay.
Rainbow Indicators Ka Taaruf:
Rainbow Indicators ka basic concept yeh hai ke yeh different periods ki moving averages ko layer kartay hain, jo ek rainbow jaisa structure banaata hai. Yeh indicators price action ko smooth karte hain aur traders ko yeh samajhnay mein madad karte hain ke market ka trend kis direction mein hai.
Moving Averages Ki Qisamain:
Rainbow Indicators different qisam ki moving averages ko use karte hain:
- Simple Moving Average (SMA): Yeh average price ko aik specific period mein calculate karta hai.
- Exponential Moving Average (EMA): Yeh recent prices ko zyada weightage deta hai.
- Weighted Moving Average (WMA): Yeh har price ko aik specific weight assign karta hai.
Kaam Karne Ka Tareeqa:
Rainbow Indicators ko apply karne ka tareeqa yeh hai ke aap different time periods ki moving averages ko ek chart par overlay karte hain. Jab sab moving averages ek dosray se door hoti hain, toh yeh strong trend ko indicate karti hain. Jab yeh close hoti hain, toh yeh consolidation ya trend reversal ka ishara hoti hain.
Trend Identification:
Rainbow Indicators ka major faida yeh hai ke yeh trend identification mein madad karte hain. Jab price moving averages ke upar hoti hain, toh yeh uptrend ka indication hota hai. Jab price moving averages ke neeche hoti hain, toh yeh downtrend ka indication hota hai.
Support aur Resistance:
Rainbow Indicators ko support aur resistance levels ko identify karne ke liye bhi use kiya ja sakta hai. Multiple moving averages ek strong support ya resistance level ko indicate kar sakti hain, jahan se price reverse ho sakti hai.
Entry aur Exit Points:
Rainbow Indicators ko trade entry aur exit points ko identify karne ke liye bhi use kiya ja sakta hai. Jab price moving averages ko cross karti hai, toh yeh potential entry ya exit point hota hai.
Risk Management:
Rainbow Indicators risk management mein bhi madadgar hain. Yeh indicators stop-loss levels ko identify karne mein madad karte hain, jo traders ko losses minimize karne mein madad dete hain.
Rainbow Indicators Ki Limitations:
Har technical analysis tool ki tarah, Rainbow Indicators ki bhi kuch limitations hain. Yeh past data par based hote hain aur future market movements ko accurately predict nahi kar sakte. Over-reliance in par losses ka sabab ban sakta hai.
In summary, Rainbow Indicators aik powerful tool hai jo Forex traders ko market trends aur price movements ko better samajhne mein madad karta hai. Magar, yeh hamesha yaad rakhe ke yeh ek supplementary tool hai aur doosray analysis techniques ke saath istimaal karna chahiye.


تبصرہ
Расширенный режим Обычный режим