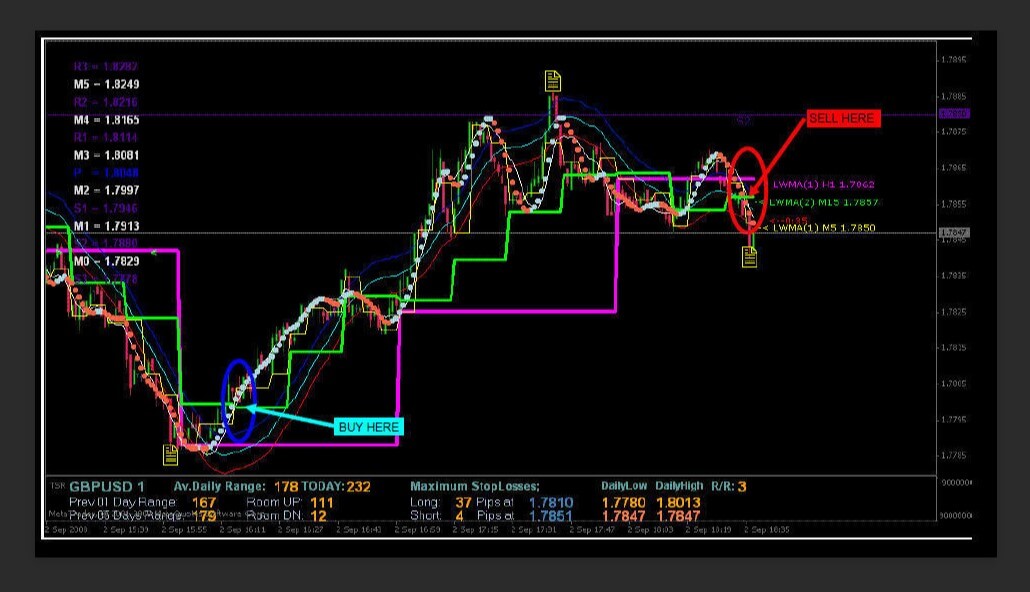
Forex Type of Indicators.
No announcement yet.
X
  • وقت
  • دکھائیں
Clear All
new posts
  • #1 Collapse

    Forex Type of Indicators.
    Forex Indicators Ki Tafseel.

    Forex trading me, indicators ka bht aham kirdar hota hai. Ye tools hume market trends aur price movements ko samajhne me madad dete hain. Forex indicators ko mukhtalif categories me divide kiya ja sakta hai, jo har trader ki zaroorat aur strategy ke mutabiq kaam aati hain.

    Click image for larger version

Name:	images (33).jpeg
Views:	16
Size:	60.4 کلوبائٹ
ID:	12971723

    Trend Indicators.

    Trend indicators, market ke overall trend ko identify karne ke liye use hote hain. Ye indicators traders ko betate hain ke market upward trend me hai ya downward trend me. Trend indicators ka istemal long-term trades ke liye zyada hota hai.
    • Moving Average (MA): Ye ek simplest aur commonly used indicator hai. Ye past prices ka average le kar future price direction ko predict karta hai.
    • Exponential Moving Average (EMA): Ye bhi ek tarah ka moving average hai, lekin ye recent prices ko zyada weightage deta hai.
    • Moving Average Convergence Divergence (MACD): Ye indicator price momentum aur trend changes ko detect karne me madad deta hai.

    Momentum Indicators.

    Momentum indicators, price movements ki speed aur strength ko measure karte hain. Ye indicators overbought aur oversold conditions ko identify karte hain.
    • Relative Strength Index (RSI): Ye indicator price changes ki speed aur magnitude ko measure karta hai. RSI values 0 se 100 ke beech hoti hain, jahan 70 se upar ki value overbought aur 30 se neeche ki value oversold condition ko show karti hai.
    • Stochastic Oscillator: Ye indicator closing price aur price range ke beech ka relation measure karta hai, jise trend reversals ko predict karne ke liye use kiya jata hai.
    • Commodity Channel Index (CCI): Ye indicator price level aur its statistical average ke darmiyan difference ko measure karta hai.

    Volatility Indicators.

    Volatility indicators, market ke fluctuations ko measure karte hain. Ye indicators price volatility ko indicate karte hain jo trading decisions me madadgar hoti hain.
    • Bollinger Bands: Ye indicator price volatility ko measure karta hai aur price ki range ko define karta hai. Ye 3 lines (bands) par mushtamil hota hai - upper band, lower band, aur middle band.
    • Average True Range (ATR): Ye indicator market ki volatility ko measure karta hai aur price movements ke range ko indicate karta hai.
    • Standard Deviation: Ye indicator price volatility ko measure karta hai aur kisi asset ki price distribution ko indicate karta hai.

    Volume Indicators.

    Volume indicators, traded volume ka analysis karte hain. Ye indicators market strength aur trend confirmation ko identify karne me madad dete hain.
    • On-Balance Volume (OBV): Ye indicator volume aur price movement ke relation ko measure karta hai.
    • Volume Price Trend (VPT): Ye indicator volume aur price trend ka combination hota hai aur price movements ko predict karne me madadgar hota hai.
    • Accumulation/Distribution Line (A/D line): Ye indicator volume aur price movements ke changes ko measure karta hai.

    Click image for larger version

Name:	images (34).jpeg
Views:	17
Size:	62.4 کلوبائٹ
ID:	12971722

    Custom Indicators.

    Custom indicators wo indicators hain jo traders apne specific needs aur strategies ke liye khud create karte hain. Ye indicators market ko in-depth analyze karne me madadgar hote hain.
    • Custom Moving Averages: Traders apne requirements ke mutabiq different moving averages design kar sakte hain.
    • Custom Oscillators: Ye custom-made oscillators market ke specific trends aur conditions ko target karte hain.
    • Algorithmic Indicators: Ye automated systems aur algorithms hote hain jo predefined conditions par trades ko execute karte hain.

    Indicators Ka Istemaal.

    Forex indicators ko sahi tarike se use karne ke liye zaroori hai ke trader in indicators ke signals ko achi tarah samjhe aur inhe apne trading strategy me incorporate kare. Indicators ko individual use karna bhi faydemand ho sakta hai, lekin inhe combine karke zyada accurate results milte hain. Trading decisions banate waqt, multiple indicators ka analysis zaroori hai takay false signals se bacha ja sake.
  • <a href="https://www.instaforex.org/ru/?x=ruforum">InstaForex</a>
  • #2 Collapse

    Forex Trading Mein Indicators Ki Iqsam

    Forex trading mein indicators aik ahem kirdar ada karte hain. Yeh indicators traders ko market trends aur price movements ko samajhne mein madad dete hain. Indicators ko mukhtalif qisam mein taqseem kiya ja sakta hai jo ke traders ko behtar decisions lene mein madadgar hote hain. Iss article mein, hum 14 mukhtalif qisam ke forex trading indicators ko discuss karenge.
    1. Moving Averages


    Moving averages forex market ka aik buniyaadi indicator hai. Yeh past price data ka average nikaalte hain taake trends ko identify kiya ja sake. Do qisam ke moving averages aam tor par istemal hote hain: Simple Moving Average (SMA) aur Exponential Moving Average (EMA). SMA sirf past data ko equally weight deta hai, jabke EMA recent data ko zyada weightage deta hai, is wajah se EMA market changes ko tezi se reflect karta hai.

    Moving averages ko long-term aur short-term trends ko samajhne ke liye bhi use kiya jata hai. For example, agar 50-day SMA 200-day SMA ko cross kare, to yeh bullish signal hota hai, jo ke “Golden Cross” kehlata hai. Iske baraks, agar 50-day SMA 200-day SMA ke neeche chale jaye to yeh bearish signal hota hai, jo “Death Cross” kehlata hai.
    2. Relative Strength Index (RSI)


    RSI aik momentum oscillator hai jo ke price changes ki speed aur strength ko measure karta hai. Iski range 0 se 100 tak hoti hai. RSI 70 se ooper hota hai to overbought aur 30 se neeche hota hai to oversold condition ko darshata hai.

    RSI ko divergence bhi identify karne ke liye use kiya jata hai. Agar price nayi high bana rahi ho magar RSI nayi high na bana rahi ho, to yeh bearish divergence hota hai aur price reversal ka signal deta hai. Isi tarah, agar price nayi low bana rahi ho magar RSI nayi low na bana rahi ho, to yeh bullish divergence hota hai.
    3. Moving Average Convergence Divergence (MACD)


    MACD do moving averages ke darmiyan ka farq measure karta hai. Yeh indicator bullish aur bearish signals ko identify karne mein madadgar hota hai. Jab MACD line signal line ko cross karti hai to yeh buying ya selling ka signal ho sakta hai.

    MACD histogram bhi aik zaroori tool hai jo ki MACD line aur signal line ke darmiyan ka farq show karta hai. Agar histogram positive se negative ho jaye to yeh bearish signal hota hai, aur agar negative se positive ho jaye to yeh bullish signal hota hai.
    4. Bollinger Bands


    Bollinger Bands volatility ko measure karte hain. Yeh bands do standard deviations ke basis par calculate kiye jaate hain aur price ke aas paas move karte hain. Jab price upper band ke qareeb hoti hai to market overbought aur lower band ke qareeb hoti hai to market oversold consider hoti hai.

    Bollinger Bands ka central band aik moving average hota hai. Price jab upper band ko touch karti hai to yeh selling opportunity hoti hai aur jab lower band ko touch karti hai to yeh buying opportunity hoti hai. Iske sath sath, jab bands expand hoti hain to yeh high volatility ko show karta hai aur jab contract hoti hain to low volatility ko indicate karta hai.
    5. Stochastic Oscillator


    Yeh indicator price ka closing price aur high-low range ke darmiyan ka relation show karta hai. Stochastic oscillator 0 se 100 ke darmiyan move karta hai aur 80 se ooper overbought aur 20 se neeche oversold condition ko darshata hai.

    Stochastic Oscillator ko crossover signals ke liye bhi use kiya jata hai. Jab %K line %D line ko upar se cross karti hai to yeh selling signal hota hai aur jab neeche se cross karti hai to yeh buying signal hota hai.
    6. Fibonacci Retracement


    Fibonacci retracement levels support aur resistance levels ko identify karte hain. Yeh indicator horizontal lines draw karta hai jo ke price movement ke mukhtalif levels ko show karti hain jaise ke 38.2%, 50%, aur 61.8%.

    Fibonacci levels ko trend reversal aur pullbacks ko identify karne ke liye bhi use kiya jata hai. Agar price aik level par support ya resistance paaye to yeh strong level hota hai aur trend continuation ka signal deta hai.
    7. Ichimoku Cloud


    Ichimoku cloud aik complex indicator hai jo ke multiple averages ko combine karta hai aur potential support aur resistance areas ko highlight karta hai. Yeh indicator overall trend direction aur market momentum ko bhi show karta hai.

    Ichimoku Cloud mein paanch mukhtalif lines hoti hain: Tenkan-sen, Kijun-sen, Senkou Span A, Senkou Span B, aur Chikou Span. Jab price cloud ke upar hoti hai to yeh bullish trend hota hai aur jab neeche hoti hai to bearish trend hota hai. Cloud ka color aur thickness bhi trend strength ko indicate karta hai.
    8. Average Directional Index (ADX)


    ADX trend ki strength ko measure karta hai. Iski range 0 se 100 tak hoti hai. 20 se neeche value weak trend ko darshati hai aur 40 se ooper value strong trend ko indicate karti hai.

    ADX ko directional movement lines (+DI aur -DI) ke sath milakar istemal kiya jata hai. Jab +DI, -DI se ooper hoti hai to yeh bullish trend hota hai aur jab neeche hoti hai to bearish trend hota hai. ADX khud trend direction ko nahi batata, sirf trend ki strength ko measure karta hai.
    9. Parabolic SAR


    Parabolic SAR trend-following indicator hai jo ke price ka time ke sath movement ko show karta hai. Yeh indicator dots ke form mein hota hai jo price ke upar ya neeche lagte hain. Price ke neeche dots bullish aur upar dots bearish trend ko indicate karte hain.

    Parabolic SAR ko stop-loss levels set karne ke liye bhi use kiya jata hai. Jab dots price ke neeche se upar shift hoti hain to yeh trend reversal ka signal hota hai.
    10. Commodity Channel Index (CCI)


    CCI overbought aur oversold levels ko identify karne mein madad karta hai. Yeh price level ko average price level ke sath compare karta hai. CCI ki range unlimited hoti hai magar +100 se ooper overbought aur -100 se neeche oversold consider hota hai.

    CCI ko divergence signals ke liye bhi use kiya jata hai. Agar price new high bana rahi ho magar CCI nahi to yeh bearish divergence hota hai aur agar price new low bana rahi ho magar CCI nahi to yeh bullish divergence hota hai.
    11. Volume Indicators


    Volume indicators market ki trading activity ko measure karte hain. Volume ka zyada hona trend continuation ko indicate karta hai aur kam volume trend reversal ko show kar sakti hai. On-Balance Volume (OBV) aur Chaikin Money Flow (CMF) aam volume indicators hain.

    OBV price aur volume ka combination hota hai jo buying aur selling pressure ko measure karta hai. Jab OBV upar jata hai to yeh buying pressure ko show karta hai aur jab neeche jata hai to selling pressure ko indicate karta hai.
    12. Pivot Points


    Pivot points short-term trend direction aur potential support/resistance levels ko identify karte hain. Yeh indicator trading session ke high, low aur closing prices ko use karte hue pivot levels calculate karta hai.

    Pivot points ko intraday trading ke liye bohot useful samjha jata hai. Yeh traders ko din ke mukhtalif times par important levels ko identify karne mein madadgar hota hai jahan price action significant ho sakta hai.
    13. Williams %R


    Williams %R momentum indicator hai jo ke overbought aur oversold conditions ko identify karta hai. Iski range -100 se 0 tak hoti hai. -20 se ooper overbought aur -80 se neeche oversold condition ko indicate karta hai.

    Williams %R ko price reversals ko predict karne ke liye bhi use kiya jata hai. Jab indicator -20 se neeche chala jaye to yeh selling signal hota hai aur jab -80 se ooper chala jaye to yeh buying signal hota hai.
    14. Heiken Ashi


    Heiken Ashi candlestick charting technique hai jo ke price data ko smooth karke trends ko identify karne mein madadgar hoti hai. Yeh traditional candlesticks se mukhtalif hoti hain aur false signals ko filter karne mein madad karti hain.

    Heiken Ashi candles ko read karna aasaan hota hai kyun ke yeh consistent trends ko dikhati hain. Jab candles continuous green hoti hain to bullish trend aur continuous red hoti hain to bearish trend ko indicate karti hain.

    Nateeja Forex trading mein indicators ka istemal aik ahem tool hai jo traders ko market trends aur price movements ko samajhne mein madad deta hai. Mukhtalif qisam ke indicators ka istemal karke, traders market ki analysis ko mazid behtar banate hain aur trading strategies ko optimize karte hain. Har ek indicator ki apni makhraj, calculation method, aur interpretation hoti hai, jisay traders ko samajhna zaroori hai.

    Indicators ka istemal karke, traders market mein mukhtalif patterns aur trends ko detect kar sakte hain. In patterns aur trends ko samajh kar, traders market ke future directions ko predict kar sakte hain aur trading decisions lene ke liye taiyar ho sakte hain.

    Ek successful trading strategy banane ke liye, traders ko indicators ko sahi tareeqe se combine karna seekhna chahiye. Har ek indicator apne aap mein valuable hai, lekin ek single indicator par pura bharosa karna hamesha recommended nahi hai. Multiple indicators ka istemal karke, traders apni analysis ko confirm kar sakte hain aur false signals ko minimize kar sakte hain.

    Ek aur zaroori baat hai ke indicators ka istemal karne se pehle, traders ko apne trading goals aur risk tolerance ko samajhna chahiye. Har ek trader ka trading style alag hota hai, isliye har ek ke liye sabhi indicators equally effective nahi hote. Traders ko apne trading plan ke mutabiq hi indicators ka chayan karna chahiye.

    Indicators ka istemal karne ka ek aur faida ye hai ke ye traders ko market mein hone wale changes aur volatility ke baray mein alert rakhte hain. Market mein hone wale sudden changes ko identify karne aur un par react karne ke liye, indicators ek useful tool hote hain.

    Magar, ek zaroori baat hai ke indicators ke istemal mein bhi hoshiyari se kaam leni chahiye. Over-reliance on indicators se bachein aur hamesha apni analysis ko verify karte rahein. Kabhi-kabhi, indicators false signals bhi generate kar sakte hain, isliye traders ko apne analysis ko cross-check karte rahein aur sirf ek indicator par pura bharosa na karein.

    Aakhir mein, forex trading mein indicators ka istemal karna ek science aur art dono hai. Traders ko indicators ko samajhna, unka sahi istemal karna, aur market ke dynamics ko samajhna seekhna padta hai. Jaise-jaise traders experience gain karte hain, unki understanding aur proficiency indicators ke istemal mein bhi badhti jaati hai.

    Is tareeqe se, forex trading mein indicators ek ahem role ada karte hain aur traders ko market ka better understanding aur profitable trading decisions lene mein madad dete hain. Lekin, unka istemal hoshiyari aur samajhdaari se karna zaroori hai.
    • #3 Collapse

      Forex trading ek azeem aur dilchasp duniya hai jahan har kisi ko kamaai aur nuksan ka moqa hota hai. Is duniya mein tajwezat aur nishanay ek ahem kirdar ada karte hain. Yeh nishanay traders ko maqool faislon mein madad dete hain. Is lekh mein, hum Forex trading mein istemal hone wali mukhtalif qisam ke nishanay par baat karenge.

      1. Lagging Indicators (Pichey Rehne Wale Nishanay)

      Lagging indicators woh nishanay hain jo peechay chalte hain aur pehlay hote hue trend ki tasdeeq karte hain. Masalan, moving averages aur MACD lagging indicators hain. In indicators ka istemal trend ki tasdeeq karne aur entry aur exit points ka faisla karne mein kiya jata hai. Moving averages, past ki prices ka average hota hai jo future ke direction ko samajhne mein madad deta hai. Agar moving average current price se ooper hota hai, toh yeh uptrend ka indication hai, jabke agar moving average current price se neeche hota hai, toh yeh downtrend ka indication hai. MACD (Moving Average Convergence Divergence) bhi ek popular lagging indicator hai jo price ke divergences ko measure karta hai aur trend ke changes ko identify karta hai.

      2. Leading Indicators (Aagey Chalne Wale Nishanay)

      Leading indicators woh nishanay hain jo aage chalte hain aur agle trend ki shuruaat ko pehchante hain. Ismein RSI aur Stochastic shamil hain. In indicators ka istemal future ke trends ko predict karne mein kiya jata hai. RSI (Relative Strength Index) market ki sargarmi aur ghair-muslim prices ko dekhta hai, jo ke overbought ya oversold zones ko darust karta hai. Overbought zone mein jab RSI 70 se ooper hota hai, toh yeh ek downtrend ka signal hai, jabke oversold zone mein jab RSI 30 se neeche hota hai, toh yeh ek uptrend ka signal hai. Stochastic bhi market ki momentum ko measure karta hai aur overbought ya oversold conditions ko show karta hai.

      3. Oscillators (Hilne Wale Nishanay)

      Oscillators, market ki sthiti ko measure karte hain aur overbought ya oversold zones ko zahir karte hain. Yeh nishanay RSI aur Stochastic mein dekhe jate hain. Oscillators market ki sargarmi aur rukawat ko darust karte hain. Yeh indicators traders ko market ki direction ke baray mein maloomat faraham karte hain. Agar oscillator ki value overbought zone mein hai, toh yeh ek possible downtrend ka signal hai, jabke agar oversold zone mein hai, toh yeh ek possible uptrend ka signal hai.

      4. Trend Indicators (Trend Nishanay)

      Trend indicators, market ke trends ko pehchane mein madad karte hain. Moving averages aur Bollinger Bands is qisam ke nishanay hain. Trend indicators market ke trends ko identify karne mein madad karte hain, jaise ke uptrend, downtrend, ya sideways trend. Moving averages ek popular trend indicator hain jo market ke average price ko display karta hai. Agar moving average ka slope up hai, toh yeh ek uptrend ka indication hai, jabke agar slope down hai, toh yeh ek downtrend ka indication hai. Bollinger Bands bhi ek trend indicator hai jo volatility aur price ki range ko darust karta hai.

      5. Volume Indicators (Hajam Nishanay)

      Volume indicators, trading volume ko analyze karte hain aur market ki shidat ko darust karte hain. On-Balance Volume aur Chaikin Money Flow is misal hain. Volume indicators market ke shidat aur volume ke baray mein maloomat faraham karte hain. Volume ki bharak aur ghair-muslim price ke darmiyan taalluq ko dekhte hue traders volume indicators ka istemal karte hain. On-Balance Volume ek volume indicator hai jo trading volume aur price movement ko analyze karta hai. Agar OBV trend ke sath move karta hai, toh yeh trend ko confirm karta hai.

      6. Volatility Indicators (Musalsal Nishanay)

      Volatility indicators, market ki tabdeeliyon ki miqdar ko shamil karte hain. Average True Range aur Bollinger Bands is qisam ke nishanay hain. Volatility indicators market ki tabdeeliyon aur instability ko measure karte hain. Volatility ki maloomat traders ko market ke changes ke baray mein agah karte hain. Average True Range (ATR) market ki volatility ko measure karta hai aur price ke movement ki range ko darust karta hai. Bollinger Bands bhi ek popular volatility indicator hai jo price ke around ek band create karta hai, jisse ke traders volatility ko samajh sakte hain.

      7. Momentum Indicators (Sargarmi Nishanay)

      Momentum indicators, trend ki sargarmi ko measure karte hain. MACD aur RSI is misal hain. Momentum indicators market ke sargarmi aur momentum ko darust karte hain. Yeh indicators traders ko trend ke strength aur reversals ke baray mein maloomat faraham karte hain. MACD ek popular momentum indicator hai jo moving averages aur price ki divergences ko analyze karta hai. Jab MACD ki line signal line se ooper hoti hai, toh yeh ek uptrend ka indication hai, jabke agar signal line MACD ki line se neeche hoti hai, toh yeh ek downtrend ka indication hai. RSI bhi market ki sargarmi ko measure karta hai aur overbought ya oversold conditions ko identify karta hai.

      8. Economic Indicators (Maeeshat Nishanay)

      Economic indicators, mulk ki maeeshat ki halat ko darust karte hain. GDP, inflation rate, aur employment data is qisam ke nishanay hain. Economic indicators mulk ki maeeshat ki halat ke baray mein maloomat faraham karte hain. Yeh indicators traders ko maeeshat ki halat ke baray mein agah karte hain jisse ke woh trading decisions le sakein. GDP (Gross Domestic Product) ek Economic Indicators (Maeeshat Nishanay)

      Economic indicators, mulk ki maeeshat ki halat ko darust karte hain. GDP, inflation rate, aur employment data is qisam ke nishanay hain. Economic indicators mulk ki maeeshat ki halat ke baray mein maloomat faraham karte hain. Yeh indicators traders ko maeeshat ki halat ke baray mein agah karte hain jisse ke woh trading decisions le sakein. GDP (Gross Domestic Product) ek mulk ki maeeshat ki muddat hoti hai jo mulk mein tijarat aur karobari fa'aliyat ko darust karti hai. Agar GDP mein izafa hota hai, toh yeh ek mazid taraqqi ki alamat hai, jabke agar GDP mein kami hoti hai, toh yeh maeeshat ki kami ki alamat hai. Inflation rate ek mulk ki currency ki qeemat mein izafa ko darust karta hai. Agar inflation rate zyada hota hai, toh yeh currency ki qeemat mein kami ki alamat hai, jabke agar kam hota hai, toh yeh currency ki qeemat mein izafa ki alamat hai. Employment data bhi ek ahem economic indicator hai jo mulk ki rozgar ki halat ko darust karta hai. Agar employment data behtar hota hai, toh yeh mulk ki maeeshat ko taraqqi ki taraf le ja sakta hai.

      9. Sentiment Indicators (Jazbat Nishanay)

      Sentiment indicators, traders ki jazbat aur unke tawaqoat ko dekhte hain. VIX (Volatility Index) aur COT (Commitment of Traders) is misal hain. Sentiment indicators traders ke jazbat aur unke tawaqoat ko samajhne mein madad karte hain. Yeh indicators market ke mood ko measure karte hain aur sentiment ke changes ko identify karte hain. VIX (Volatility Index) market ki volatility ko measure karta hai aur investor ki jazbat ko darust karta hai. Agar VIX ki value zyada hoti hai, toh yeh market mein uncertainty ko zahir karta hai, jabke agar kam hoti hai, toh yeh market mein stability ki alamat hai. COT (Commitment of Traders) report traders ke positions aur unke sentiment ko display karta hai. Agar traders ka majority ek direction mein position le raha hai, toh yeh uss direction ki tawaqoat ko darust karta hai.

      10. Price Action Indicators (Keemat Amal Nishanay)

      Price action indicators, market ke price movements ko analyze karte hain. Candlestick patterns aur chart patterns is qisam ke nishanay hain. Price action indicators market ke price movements ko analyze karte hain aur traders ko potential entry aur exit points ke baray mein maloomat faraham karte hain. Candlestick patterns ek popular price action indicator hain jo price ke patterns ko darust karte hain. Misal ke tor par, agar ek bullish engulfing candlestick pattern ban raha hai, toh yeh ek uptrend ka signal hai, jabke agar ek bearish engulfing pattern ban raha hai, toh yeh ek downtrend ka signal hai. Chart patterns bhi price action indicators hain jo price ke geometric shapes ko analyze karte hain. Misal ke tor par, agar ek head and shoulders pattern ban raha hai, toh yeh ek reversal ka signal hai.

      11. Technical Indicators (Tech Nishanay)

      Technical indicators, price aur volume data se tajwezat nikalne mein madad karte hain. MACD, RSI, aur Bollinger Bands is misal hain. Technical indicators price aur volume data ko analyze karte hain aur traders ko potential trading opportunities ke baray mein maloomat faraham karte hain. MACD, RSI, aur Bollinger Bands jaise ke popular technical indicators market ke trends aur price movements ko darust karte hain. MACD moving averages aur price ke divergences ko analyze karta hai, RSI market ki sargarmi ko measure karta hai, aur Bollinger Bands volatility aur price ki range ko darust karta hai.

      12. Fundamental Indicators (Bunyadi Nishanay)

      Fundamental indicators, market mein maeeshat aur siyasat ke asrat ko darust karte hain. GDP growth rate aur interest rates is qisam ke nishanay hain. Fundamental indicators mulk ki maeeshat aur siyasat ke asrat ko analyze karte hain. Yeh indicators traders ko maeeshat aur siyasat ke changes ke baray mein agah karte hain jisse ke woh apne trading decisions le sakein. GDP growth rate mulk ki maeeshat ki taraqqi ko darust karta hai. Agar GDP growth rate zyada hai, toh yeh ek taraqqi ki alamat hai, jabke agar kam hai, toh yeh ek maeeshat ki kami ki alamat hai. Interest rates bhi ek ahem fundamental indicator hai jo currency ki qeemat aur mulk ki maeeshat ko influence karta hai.

      13. Combination Indicators (Milaap Nishanay)

      Combination indicators, do ya zyada nishanat ki milaap se tajwezat nikalte hain. Misalan, MACD aur RSI ka istemal ek saath karna. Combination indicators do ya zyada nishanat ki milaap se tajwezat nikalte hain aur traders ko zyada mukammal maloomat faraham karte hain. In indicators ka istemal karte hue traders multiple perspectives se market ko analyze kar sakte hain aur behtar trading decisions le sakte hain. Misal ke tor par, agar ek trader MACD aur RSI ka istemal kar raha hai, toh woh trend aur momentum dono ko analyze kar sakta hai aur behtar entry aur exit points tay kar sakta hai.

      Forex trading mein nishanay aham hotay hain, lekin unka sahi istemal karne ke liye traders ko inka thik tareeqa-e-kaam seekhna zaroori hai. Iske ilawa, har nishanat ki apni ahmiyat aur istemal ka tajziya karna bhi zaroori hai taake traders apne faislon ko behtareen tor par le sakein.
      • #4 Collapse

        Forex Trading Mein Indicators Ki Iqsam[][][][][]

        Forex trading mein, indicators ko do mukh categories mein taqseem kiya ja sakta hai:
        1. Technical Indicators: Yeh woh tools hain jo price action aur trading volumes par base karte hain. Technical indicators ke kuch examples yeh hain:
          • Trend Indicators:
            • Moving Averages (MA): Simple Moving Average (SMA), Exponential Moving Average (EMA)
            • Moving Average Convergence Divergence (MACD)
            • Parabolic SAR
          • Momentum Indicators:
            • Relative Strength Index (RSI)
            • Stochastic Oscillator
            • Average Directional Index (ADX)
          • Volatility Indicators:
            • Bollinger Bands
            • Average True Range (ATR)
          • Volume Indicators:
            • On-Balance Volume (OBV)
            • Volume Rate of Change (VROC)
          • Cycle Indicators:
            • Elliott Wave Oscillator
            • Cycle LinesTechnical Indicators:
        • Moving Averages (MA):
        • Simple Moving Average (SMA): Yeh past prices ka average hota hai over a specific period. Agar 50-day SMA 200-day SMA ke upar ho, toh yeh bullish signal hota hai.
        • Exponential Moving Average (EMA): EMA recent prices ko zyada weight deta hai. Short-term EMA ko long-term EMA ke saath compare karke trend reversal detect kiya ja sakta hai.
          • Moving Average Convergence Divergence (MACD): Yeh 12-day EMA aur 26-day EMA ka difference hota hai. MACD line aur signal line ke crossovers trend changes ko indicate karte hain.
          • Parabolic SAR: Yeh indicator dots form karta hai jo price ke upar ya neeche hotay hain. Dots price ke neeche ho toh uptrend, upar ho toh downtrend indicate hota hai.
        1. Fundamental Indicators: Yeh indicators economic data aur news events par base karte hain jo currency ke value par asar daal sakte hain. Fundamental indicators ke kuch examples yeh hain:
          • Economic Indicators:
            • Gross Domestic Product (GDP)
            • Consumer Price Index (CPI)
            • Employment Data (Non-Farm Payrolls, Unemployment Rate)
            • Interest Rates (Federal Reserve, European Central Bank decisions)
          • Political Events:
            • Elections
            • Government Policies
            • Geopolitical Tensions
          • Market Sentiment:
            • Commitment of Traders Report (COT)
            • Speculative Positioning
        ko zyadatar traders chart analysis ke zariye use karte hain, jabk
        ko macroeconomic analysis aur news trading ke liye istemal kiya jata hai. Yeh indicators mil kar traders ko informed decisions lene mein madad karte hain taake wo profitable trades kar sakein.Yeh indicators mil kar traders ko market conditions ko analyze karne aur informed decisions lene mein madad karte hain. Har trader apni strategy aur trading style ke mutabiq in indicators ka istemal karta hai.
        Last edited by ; 24-05-2024, 03:53 PM.
        • <a href="https://www.instaforex.org/ru/?x=ruforum">InstaForex</a>
        • #5 Collapse

          Forex Indicators

          Forex market main trading karte waqt, indicators ko use karna bohot zaroori hota hai. Indicators wo tools hain jo traders ko market ka analysis karne aur trading decisions lene mein madad karte hain. Indicators ko use karte hue, traders market trends, price movements, aur potential entry aur exit points identify kar sakte hain. Aayein kuch important forex indicators ko detail mein samjhte hain.
          Click image for larger version

Name:	images.png
Views:	13
Size:	22.4 کلوبائٹ
ID:	12972433
          Moving Averages

          Moving averages market ke trends ko samajhne ka aik popular tareeqa hain. Ye indicator price data ko smooth karke average trend ko dikhata hai. Do tarah ke moving averages hotay hain: Simple Moving Average (SMA) aur Exponential Moving Average (EMA).

          Simple Moving Average (SMA)
          SMA aik straightforward average hai jo specific period ke closing prices ko add karke divide kar deta hai. Agar 10-day SMA dekh rahe hain, to pichle 10 dinon ke closing prices ka average le kar dikhaya jata hai.

          Exponential Moving Average (EMA)
          EMA recent prices ko zyada weightage deta hai, jo SMA se thoda sensitive hota hai. Ye indicator latest price movements ko zyada accurately follow karta hai.

          Relative Strength Index (RSI)

          RSI aik momentum oscillator hai jo price movements ki speed aur change ko measure karta hai. Iska scale 0 se 100 tak hota hai. Agar RSI value 70 se upar ho, to market overbought consider hota hai, aur agar 30 se neeche ho, to market oversold consider hota hai. Overbought aur oversold signals se traders potential reversals identify kar sakte hain.

          Moving Average Convergence Divergence (MACD)

          MACD do different moving averages ke darmiyan relationship ko study karta hai. Do moving averages (usually 12-day EMA aur 26-day EMA) ka difference calculate kiya jata hai aur ek signal line (usually 9-day EMA) use hoti hai. Jab MACD line signal line ko cross karti hai, ye buying ya selling signal generate karta hai.

          Bollinger Bands

          Bollinger Bands price volatility ko measure karte hain. Ye bands price chart par draw hotay hain aur do standard deviations away hotay hain from a simple moving average. Jab price bands ke upar ya neeche jati hai, to market overbought ya oversold consider hota hai. Isse traders ko potential reversals ka idea hota hai.

          Fibonacci Retracement

          Fibonacci Retracement aik technical analysis tool hai jo support aur resistance levels ko identify karne ke liye use hota hai. Ye Fibonacci sequence ka use karta hai jisme key levels 23.6%, 38.2%, 50%, 61.8%, aur 100% hoti hain. Jab market move karta hai, ye levels possible reversal points indicate karte hain.

          Stochastic Oscillator

          Stochastic Oscillator aik momentum indicator hai jo price range ke hisaab se price level ko compare karta hai over a specific period of time. Iska scale 0 se 100 tak hota hai. Agar value 80 se upar ho to market overbought aur agar 20 se neeche ho to market oversold consider hota hai. Isse traders buying aur selling opportunities identify karte hai.

          Average Directional Index (ADX)

          ADX trend strength ko measure karta hai. Iska scale 0 se 100 tak hota hai. Agar ADX value 25 se zyada ho, to strong trend consider hota hai, aur agar 25 se kam ho to weak trend. ADX trend ki direction ko measure nahi karta, sirf trend ki strength ko dikhata hai.

          Note

          Forex trading mein successful hone ke liye indicators ka sahi use bohot zaroori hai. Har indicator ka apna specific use aur significance hota hai. Traders ko apne trading strategy ke hisaab se indicators ka selection karna chahiye aur unka effectively use karna chahiye. Indicators ka combination use karne se market analysis aur trading decisions accurate ho sakte hain.

          اب آن لائن

          avatar Ayn
          Working...
          X