How to Place a Flag on Trading Chart.

No announcement yet.
`
X
  • وقت
  • دکھائیں
Clear All
new posts
  • #1 Collapse

    How to Place a Flag on Trading Chart.
    Introduction.

    Trading charts pe flag lagana ek important part hai jo traders ke liye market trends aur patterns ko samajhne mein madad karta hai. Flag lagana trading analysis ka ek crucial aspect hai jis se traders apne trading decisions ko improve kar sakte hain.

    Selecting the Trading Chart.

    Sab se pehle, aapko apne trading platform par ek suitable chart select karna hoga. Aam taur par, traders candlestick, bar, ya line charts ka istemal karte hain. Candlestick charts zyada popular hain kyunki woh price movements ko achay taur par dikhate hain.

    Click image for larger version

Name:	bullish-flag-pattern_body_IDENTIFYINGFLAGOLEpngfull.png
Views:	63
Size:	26.7 کلوبائٹ
ID:	12948577

    Identifying the Trend.

    Flag lagane se pehle, aapko market trend ka pata lagana zaroori hai. Trend ko samajhne ke liye, aap price action aur technical indicators ka istemal kar sakte hain jaise ki moving averages aur trend lines.

    Selecting the Flag Pattern.

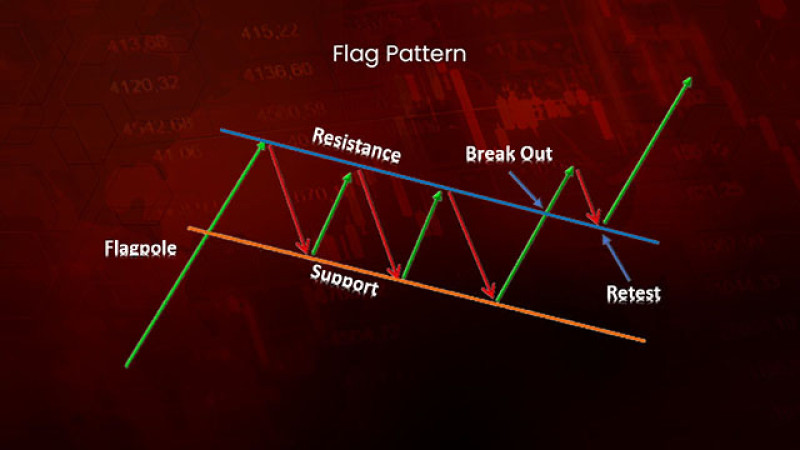
    Jab trend identify ho jaye, toh aapko flag pattern select karna hoga. Flag patterns trading charts par common hote hain. Bullish flag uptrend ke doran aur bearish flag downtrend ke doran dikhai dete hain.

    Placing the Flag.

    Flag ko lagane ke liye, aapko ek high aur ek low point ko connect karke flag ka shape draw karna hoga. Bullish flag mein, ek ascending trend line ko high points se connect kiya jata hai aur phir ek parallel line ko low points se draw kiya jata hai. Bearish flag mein, ek descending trend line ko low points se connect kiya jata hai aur phir ek parallel line ko high points se draw kiya jata hai.

    Pattern ko tasdeeq karne ke liye, aapko volume aur price action ko dekhna hoga. Agar flag pattern ke doran volume decrease hota hai aur price range narrow hoti hai, toh yeh pattern strong hota hai. Agar volume aur price action mein inconsistency hai, toh pattern weak ho sakta hai.

    Click image for larger version

Name:	images (19).jpeg
Views:	49
Size:	47.5 کلوبائٹ
ID:	12948578

    Setting Entry, Stop Loss, and Target Levels.

    Pattern confirm hone ke baad, aapko entry, stop loss, aur target levels set karna hoga. Entry level ko flag breakout ke baad confirm kiya jata hai. Stop loss level ko risk management ke liye set kiya jata hai aur target level ko potential profit ke hisab se set kiya jata hai.

    Trading mein risk management kaafi zaroori hai. Stop loss levels ko set karna zaroori hai taake agar trade opposite direction mein chala gaya toh nuksan kam ho sake. Risk reward ratio ko bhi dhyan mein rakhte hue trade karna zaroori hai taake potential profit potential loss se zyada ho.
  • <a href="https://www.instaforex.org/ru/?x=ruforum">InstaForex</a>
  • #2 Collapse

    How to Place a Flag on Trading Chart.

    Flag ko trading chart mein istemal kiya jata hai taake traders ko trend ka pata chale aur unhe future mein hone wale movements ke bare mein idea mil sake.Flag ek technical analysis tool hai jo price movements ko represent karta hai. Ye typically ek rectangle ya parallelogram ke shape mein hota hai, jo price chart par trend ke doran ban jata hai.

    Flag Ke Do Types
    1. Bullish Flag: Agar price uptrend mein hai aur phir thori cumpulsory retracement hoti hai, jisse flag banta hai, to ise bullish flag kehte hain. Ye uptrend ke continuation ki indication deta hai.
    2. Bearish Flag: Agar price downtrend mein hai aur phir thori cumpulsory rally hoti hai, jisse flag banta hai, to ise bearish flag kehte hain. Ye downtrend ke continuation ki indication deta hai.
    Click image for larger version

Name:	images (21).png
Views:	75
Size:	7.2 کلوبائٹ
ID:	12948596

    Flag Ka Placement

    Flag trading chart par do levels par hota hai.
    1. Flagpole: Flagpole wo part hota hai jahan se flag shuru hota hai. Ye ek trend ke part hota hai jo flag ke formation se pehle hota hai.
    2. Flag: Flagpole ke baad, jab price mein thori retracement hoti hai aur ek rectangle ya parallelogram shape ban jata hai, to ise flag kehte hain. Ye flagpole ke baad ka part hota hai.

    Flag Ki Formation

    Flag ki formation kaafi crucial hoti hai. Agar flag sahi se form nahi hota, to ye trading signals ko weak kar sakta hai. Sahi flag formation ke liye, price mein ek clear trend hone chahiye jaise uptrend ya downtrend.

    Click image for larger version

Name:	images (20).png
Views:	53
Size:	17.6 کلوبائٹ
ID:	12948597

    Trading Strategy

    Flag trading strategy ko samajhna zaroori hai.
    1. Entry Point: Entry point ko determine karne ke liye, traders price breakout ka wait karte hain. Agar price flag ke upper side se breakout karta hai, to ye bullish signal hai aur traders long positions le sakte hain. Agar price flag ke lower side se breakout karta hai, to ye bearish signal hai aur traders short positions le sakte hain.
    2. Stop Loss: Har trade mein stop loss zaroori hota hai. Agar trade opposite direction mein chala gaya to stop loss trade ko bacha sakta hai.
    3. Target: Target price ko set karna bhi important hai. Traders typically flagpole ka height calculate karke target set karte hain.

    Risk Management

    Har trading strategy mein risk management ka hona zaroori hai. Risk ko minimize karne ke liye, traders apni investment ko manage karte hain aur apne trades ke liye stop loss aur target set karte hain.
    • #3 Collapse

      Flag on Trading Chart ka Introduction:

      Flag pattern ek continuation pattern hai jo market mein trend ke doran aksar dekha jata hai. Is pattern ka naam isliye hai kyunki iska shape ek flag jaisa hota hai, jismein ek pole ya mast aur uske baad ek horizontal rectangle ya band hota hai.

      Flag Pattern ke Types:

      Flag pattern do tarah ke hote hain:
      1. Bullish Flag: Ye pattern uptrend ke doran dikhai deta hai jab market mein price increase hoti hai. Ismein ek pole ke baad ek horizontal rectangle pattern banega.
      2. Bearish Flag: Ye pattern downtrend ke doran dekha jata hai jab market mein price decrease hoti hai. Ismein bhi ek pole ke baad ek horizontal rectangle pattern dikhai deta hai.
      Flag pattern ki pehchan karne ke liye aapko pole aur rectangle ke levels ko identify karna hota hai. Normally, pole ke baad price mein sudden move hoti hai, phir ek rectangle shape form hota hai jise flag kehte hain. Is pattern ko confirm karne ke liye traders volume ki bhi analysis karte hain. Agar volume pole ke doran increase hoti hai aur rectangle ke doran decrease hoti hai (in case of a bullish flag), ya phir pole ke doran decrease hoti hai aur rectangle ke doran increase hoti hai (in case of a bearish flag), to ye pattern strong hota hai.

      Flag pattern ka use traders trend continuation ke liye karte hain. Agar aap ek bullish flag pattern dekhte hain, to aap expect kar sakte hain ke price ka next move uptrend mein hi hoga, aur agar bearish flag pattern dekhte hain, to price ka next move downtrend mein hoga. Lekin, jaise har pattern mein hota hai, flag pattern ko bhi confirm karne ke liye aur additional indicators aur analysis ki zarurat hoti hai.
      Click image for larger version

Name:	555.png
Views:	61
Size:	388.3 کلوبائٹ
ID:	12948606

      Flag ko Trading Chart Pr Place krnay ka Tarika:

      Flag pattern ko trading chart par place karna asan hai agar aap trading platform ka istemal kar rahe hain. Yahan tak ke aapko roman Urdu mein samjha sakoon:
      1. Trading Platform Open Karein: Sab se pehle, apne chosen trading platform ko open karein. Ye platform aapko market charts, indicators, aur trading tools provide karega.
      2. Chart Select Karein: Trading platform mein, aapko chart select karna hoga jismein aap flag pattern place karna chahte hain. Aam taur par, candlestick ya bar chart zyadatar traders ka preference hota hai.
      3. Price Chart Ko Zoom Karein: Chart par price ko zoom karein takay aap price action ko clearly dekh sakein aur flag pattern ko identify kar sakein.
      4. Flag Pattern Ki Pehchan Karein: Flag pattern ko identify karne ke liye, aapko trend ke doran ek pole ya mast aur uske baad ek horizontal rectangle ya band dekhna hoga. Bullish flag mein price increase ke baad ek pole aur phir horizontal rectangle dikhta hai, jabke bearish flag mein price decrease ke baad pole aur phir rectangle dikhta hai.
      5. Drawing Tools Ka Istemal Karein: Trading platform ke drawing tools ka istemal karke, aap flag pattern ko chart par draw kar sakte hain. Drawing tools normally chart ke bottom ya top mein hoti hain. Flag pattern draw karte waqt, pole aur rectangle ko clearly mark karein.
      6. Pattern Confirm Karein: Flag pattern ko confirm karne ke liye, aapko volume analysis bhi karni hogi. Agar volume pole ke doran increase hoti hai aur rectangle ke doran decrease hoti hai (bullish flag), ya phir pole ke doran decrease hoti hai aur rectangle ke doran increase hoti hai (bearish flag), to pattern confirm hota hai.
      7. Trade Entry Point Aur Stop Loss Set Karein: Flag pattern ko dekh kar, aap trade entry point aur stop loss bhi set kar sakte hain. Bullish flag mein, entry point usually rectangle ke breakout ke baad set kiya jata hai, jabke bearish flag mein entry point rectangle ke breakout ke niche set kiya jata hai. Stop loss ko bhi apne risk management plan ke mutabiq set karein.
      8. Trade Execute Karein: Pattern confirm hone ke baad, apne trading plan ke mutabiq trade execute karein.
      Flag pattern ko chart par place karna ek step-by-step process hai jo traders ko market direction mein help karta hai. Isko practice karke aur confirm karke hi live trading mein istemal karein.
      Click image for larger version

Name:	5555.png
Views:	55
Size:	20.5 کلوبائٹ
ID:	12948608


      Flag pattern ke Characteristics:

      Flag pattern ke kuch important characteristics hain jo traders ko pattern ko samajhne mein madad karte hain:
      1. Trend Continuation: Flag pattern ek trend continuation pattern hai, matlab agar market mein already ek trend hai (upward ya downward), to flag pattern us trend ko continue karne ka indication deta hai.
      2. Pole aur Rectangle Formation: Flag pattern mein ek pole ya mast aur uske baad ek horizontal rectangle ya band hota hai. Bullish flag mein pole ke baad price increase aur phir rectangle formation hoti hai, jabke bearish flag mein pole ke baad price decrease aur phir rectangle formation hoti hai.
      3. Volume Analysis: Flag pattern ko confirm karne ke liye volume analysis ki zarurat hoti hai. Agar volume pole ke doran increase hoti hai aur rectangle ke doran decrease hoti hai (bullish flag), ya phir pole ke doran decrease hoti hai aur rectangle ke doran increase hoti hai (bearish flag), to pattern strong hota hai.
      4. Duration: Flag pattern ka duration kuch din se lekar kuch weeks tak ho sakta hai, ismein market ke movement aur volatility ka impact hota hai.
      5. Target Price: Flag pattern ko measure karne ke liye, traders pole ka height calculate karte hain aur usko breakout point se upar ya niche extend karte hain, jo target price hota hai.
      6. Breakout Confirmation: Flag pattern ka breakout confirm hona zaruri hai trade entry ke liye. Bullish flag mein breakout rectangle ke upar hota hai, jabke bearish flag mein breakout rectangle ke niche hota hai.
      7. Stop Loss Placement: Flag pattern ke trading mein stop loss ko sahi jagah set karna zaruri hai. Bullish flag mein stop loss rectangle ke niche aur bearish flag mein stop loss rectangle ke upar set kiya jata hai.
      In characteristics ko samajh kar aur sahi analysis karke, traders flag pattern ko successful trading mein istemal kar sakte hain.

      Click image for larger version

Name:	55555.jpg
Views:	50
Size:	38.7 کلوبائٹ
ID:	12948607

      Conclusion:

      Flag pattern ko trading chart par place karna ek important step hai jab aap trend analysis aur trading decisions le rahe hote hain. Is process ka conclusion yeh hai:
      1. Identify Flag Pattern: Sab se pehle, aapko chart par flag pattern ko identify karna hota hai. Ismein pole ya mast aur uske baad ek horizontal rectangle ya band hota hai. Bullish flag mein price increase ke baad pole aur phir rectangle dikhta hai, jabke bearish flag mein price decrease ke baad pole aur phir rectangle dikhta hai.
      2. Draw Flag Pattern: Trading platform ke drawing tools ka istemal karke, aap flag pattern ko chart par draw karte hain. Isse aapko pattern ka clear visual representation milta hai.
      3. Confirm Pattern: Flag pattern ko confirm karne ke liye, aapko volume analysis bhi karni hogi. Agar volume pole ke doran increase hoti hai aur rectangle ke doran decrease hoti hai (bullish flag), ya phir pole ke doran decrease hoti hai aur rectangle ke doran increase hoti hai (bearish flag), to pattern confirm hota hai.
      4. Set Entry Point aur Stop Loss: Flag pattern ko dekh kar, aap apne trade ka entry point aur stop loss set karte hain. Bullish flag mein entry point rectangle ke breakout ke baad set kiya jata hai, jabke bearish flag mein entry point rectangle ke breakout ke niche set kiya jata hai. Stop loss ko bhi apne risk management plan ke mutabiq set karein.
      5. Execute Trade: Pattern confirm hone ke baad, apne trading plan ke mutabiq trade execute karein.
      Flag pattern ka place karna trading mein ek technical analysis ka hissa hai jo trend continuation ko identify karne mein madad karta hai. Isko samajhne aur istemal karne ke liye practice aur market analysis zaruri hai.

      • #4 Collapse

        User

        How to Place a Flag on Trading Chart.


        Click image for larger version

Name:	download (7).jfif
Views:	47
Size:	13.8 کلوبائٹ
ID:	12948621


        1. Chart Par Jhandi Lagana


        Chart par jhandi laganay ka maqsad trading analysis ko madad dena hai. Yeh aik aham tool hai jo traders istemal karte hain takay woh trend, entry aur exit points ko samajh sakein. Neechay diye gaye tareeqay se chart par jhandi laga sakte hain:


        2. Jhandi ki Zarurat


        Jab aap trading chart ko dekhte hain, toh aksar trend lines, support aur resistance levels wagera ko identify karna mushkil ho sakta hai. Is maslay ko hal karne ke liye, jhandi ko lagana aham hai. Jhandi, mukhtalif trading signals aur patterns ko highlight karta hai.


        3. Trend Direction Maloom Karna


        Pehli cheez jo aapko karni hai wo hai trend direction ka pata lagana. Agar aap long-term trend ko dekh rahe hain, toh jhandi ko trend ki direction ke mutabiq lagaen. Agar uptrend hai, toh jhandi ko neeche se upar lagayen aur agar downtrend hai, toh oopar se neeche.


        4. Jhandi Lagane ke Liye Steps
        • Highs aur Lows ko Identify Karen: Pehle, recent highs aur lows ko chart par dekhein. Yeh aapko current trend ka idea dega.
        • Jhandi Start Point Chunein: Agar aap uptrend ko dekh rahe hain, toh recent low point ko chunein aur agar downtrend hai, toh recent high point ko chunein. Yeh aapka start point hoga.
        • Second Point Chunein: Ab, trend ke direction ke mutabiq dusra point chunein. Agar uptrend hai, toh recent high point ko chunein aur agar downtrend hai, toh recent low point ko chunein.
        • Jhandi Ko Draw Karen: Ab, chosen points ko connect karte hue jhandi ko draw karen. Isse aapko trend ka clear idea mil jayega.


        5. Jhandi ki Importance


        Jhandi laganay se traders ko trend ka pata chalta hai, jisse woh trading decisions sahi tareeqay se le sakte hain. Iske ilawa, jhandi support aur resistance levels ko bhi identify karta hai, jo traders ke liye useful hota hai.


        6. Jhandi ki Types


        Mukhtalif tarah ki jhandiyan hoti hain jaise simple moving averages, exponential moving averages, aur Fibonacci retracement levels. Har ek ki apni importance aur istemal hoti hai, jisko traders apne trading strategy ke mutabiq istemal karte hain.


        7. Conclusion


        Jhandi laganay ka tareeqa chart analysis mein aham hai. Traders ko trend ko samajhne aur trading decisions ko improve karne mein madad milti hai. Is liye, har trader ko jhandi ko istemal karne ka tareeqa seekhna chahiye.
        منسلک شدہ فائلیں
        • #5 Collapse

          Topic : How to Place a Flag on Trading Chart

          Click image for larger version

Name:	bullish-flag-pattern_body_IDENTIFYINGFLAGOLEpngfull.png
Views:	43
Size:	26.7 کلوبائٹ
ID:	12948631

          1. Introduction: Flag ek technical analysis tool hai jo trading charts par price movements ke patterns ko identify karne aur trading opportunities ko spot karne mein madad karta hai. Yeh typically price trends ke baad aati hai aur ek brief consolidation period ko represent karti hai.

          2. Flag Types: Flag do prakar ke hote hain:

          a. Bullish Flag: Jab price ek uptrend ke baad ek small rectangular consolidation pattern form karta hai, toh yeh bullish flag kaha jata hai. Is pattern mein price typically uptrend ke continuation ka sign hota hai.

          b. Bearish Flag: Jab price ek downtrend ke baad ek small rectangular consolidation pattern form karta hai, toh yeh bearish flag kaha jata hai. Is pattern mein price typically downtrend ke continuation ka indication hota hai.

          3. Flag Lagane ka Tareeqa:

          Flag lagane ka tareeqa simple hai aur traders chart par flag ko identify kar sakte hain:

          a. Uptrend ya Downtrend Ke Baad Search Karein: Flag usually trend ke baad form hoti hai, isliye pehle uptrend ya downtrend ko identify karein.

          b. Consolidation Period Ko Dhundein: Uptrend ya downtrend ke baad price ka ek consolidation period dhundhein jahan par price range tight hoti hai aur ek small rectangular pattern form hota hai.

          c. Flag Ki Length Aur Height Measure Karein: Flag ki length aur height ko measure karein taake aapko target aur stop-loss levels set karne mein madad mile.

          4. Trading Strategy:

          Flag ko trading strategy ke taur par istemal karne ke liye kuch steps hain:

          a. Entry Point: Agar price flag pattern ko break kar raha hai, toh woh entry point ban sakta hai. Traders entry point par enter karte hain aur trend ke saath trading karte hain.

          b. Stop-Loss Order: Agar price flag ke against move karta hai, toh traders apne positions ke liye stop-loss order set karte hain taake losses ko minimize kiya ja sake.

          c. Target Levels: Traders flag pattern ki length ko measure karke target levels set karte hain. Yeh unke potential profits ko define karta hai.

          5. Limitations:

          Flag patterns ke interpretation mein kuch limitations bhi hain:

          a. False Breakouts: Kabhi kabhi flag patterns false breakouts generate kar sakti hain, jisse traders ko losses ho sakte hain.

          b. Market Conditions: Market conditions aur volatility flag patterns ke performance par asar daal sakti hai. Choppy market conditions mein flag patterns less reliable ho sakte hain.

          Flag patterns trading charts par trading opportunities ko identify karne ka ek powerful tool hai. Sahi tareeqe se flag patterns ko identify karke aur sahi risk management ke saath istemal karke traders apne trading strategies ko improve kar sakte hain.
          • #6 Collapse

            How to Place a Flag on Trading Chart.
            Trading charts pe flag lagana ek important part hai jo traders ke liye market trends aur patterns ko samajhne mein madad karta hai. Flag lagana trading analysis ka ek crucial aspect hai jis se traders apne trading decisions ko improve kar sakte hain.Pattern confirm hone ke baad, aapko entry, stop loss, aur target levels set karna hoga. Entry level ko flag breakout ke baad confirm kiya jata hai. Stop loss level ko risk management ke liye set kiya jata hai aur target level ko potential profit ke hisab se set kiya jata hai. Strategy.Entry point ko determine karne ke liye, traders price breakout ka wait karte hain. Agar price flag ke upper side se breakout karta hai, to ye bullish signal hai aur traders long positions le sakte hain. Agar price flag ke lower side se breakout karta hai, to ye bearish signal hai aur traders short positions le sakte hain. flag pattern select karna hoga. Flag patterns trading charts par common hote hain. Bullish flag uptrend ke doran aur bearish flag downtrend ke doran dikhai dete hain.traders ko trend ka pata chalta hai, jisse woh trading decisions sahi tareeqay se le sakte hain. Iske ilawa, jhandi support aur resistance levels ko bhi identify karta hai, jo traders ke liye useful hota hai. Management

            Har trading strategy mein risk management ka hona zaroori hai. Risk ko minimize karne ke liye, traders apni investment ko manage karte hain aur apne trades ke liye stop loss aur target set karte hain.Pattern ko tasdeeq karne ke liye, aapko volume aur price action ko dekhna hoga. Agar flag pattern ke doran volume decrease hota hai aur price range narrow hoti hai, toh yeh pattern strong hota hai. Agar volume aur price action mein inconsistency hai, toh pattern weak ho sakta hai.jab price mein thori retracement hoti hai aur ek rectangle ya parallelogram shape ban jata hai, to ise flag kehte hain. Ye flagpole ke baad ka part hota hai.
            • #7 Collapse

              Forex Trading Mein Flag Ki Tadbeer Kaise Lagayein

              Forex trading mein safar shuru karne wale traders ke liye, chart par flags lagana ek ahem qadam hai. Flags, asasa ki tarah kaam karte hain jo aapko trading signals provide karte hain. Yeh article aapko batayega ke Forex trading chart par flag kaise lagayein aur inka istemal kaise karein.

              1. Forex Trading Mein Flags Ka Maqsad

              Flags ka maqsad market trends ko samajhne mein madad karna hai. Yeh patterns market ke changes ko detect karte hain aur traders ko trading decisions ke liye guide karte hain. Flags ki madad se traders market ke directions aur potential reversals ko anticipate kar sakte hain. Flags ke istemal se traders market ke short-term aur long-term trends ko identify kar sakte hain, jisse unka trading performance improve hota hai.

              2. Flag Kya Hai?

              Flag ek technical analysis tool hai jo price action ko represent karta hai. Yeh typically short-term price movements ko depict karta hai aur trading opportunities ko identify karne mein madad karta hai. Flags, market mein temporary pauses ya consolidations ko show karte hain jinse traders ko future price movements ka idea milta hai. Har flag formation ek unique pattern hota hai jiska interpretation traders ke experience aur market conditions par depend karta hai.

              3. Bullish Aur Bearish Flags

              Bullish flags uptrend ke doran develop hote hain jabke bearish flags downtrend ke doran develop hote hain. In dono ke istemal mein, traders market direction ke potential changes ko anticipate karte hain. Bullish flags, uptrend ke mukhtalif phases ko indicate karte hain aur bullish continuation signals provide karte hain. Bearish flags, downtrend ke mukhtalif phases ko indicate karte hain aur bearish continuation signals provide karte hain. Bullish flags mein price ka consolidation ek upwards sloping trendline ke saath hota hai jabke bearish flags mein price ka consolidation ek downwards sloping trendline ke saath hota hai.

              4. Flag Kaise Banate Hain?

              Flag ko banane ke liye, pehle uptrend ya downtrend ka pata lagayein. Phir, price action mein ek consolidation phase ko dhundhein jo trend ke against hota hai. Yeh consolidation phase flag ka main component hota hai. Bullish flag formation mein, price uptrend ke doran ek short-term downward move ke baad sideways consolidation hoti hai. Bearish flag formation mein, price downtrend ke doran ek short-term upward move ke baad sideways consolidation hoti hai. Flag ki formation ke doran, price action ke sath-sath volume bhi consider kiya jata hai jisse flag ki authenticity determine ki ja sakti hai.

              5. Flag Ki Recognizing

              Flag ko recognize karne ke liye, price action ko closely monitor karein. Agar price mein ek sharp move ke baad consolidation phase aata hai, toh yeh flag ki possibility hai. Bullish flag recognition mein, price ka downward move ke baad sideways consolidation observe karein. Bearish flag recognition mein, price ka upward move ke baad sideways consolidation observe karein. Flag ki recognition ke liye traders ko price action ke saath-saath volume bhi dekhna chahiye taake false signals ko avoid kiya ja sake.

              6. Flag Ki Confirming

              Flag ko confirm karne ke liye, volume ko bhi dekhein. Agar flag formation ke doran volume kam hota hai, toh yeh ek confirmation sign hai. Kam volume wale flags zyada reliable hote hain kyunki yeh indicate karte hain ke market mein less participation hai aur consolidation ka genuine nature hai. Volume ke saath price action ka bhi confirmation dekha ja sakta hai. Ek strong flag pattern ko confirm karne ke liye, traders ko volume ke saath-saath price ke breakout ko bhi dekhna chahiye jisse flag ki strength ka pata chal sake.

              7. Entry Point

              Flag formation ke baad, entry point ko determine karna zaroori hai. Bullish flag mein, entry point usually flag ke upper trendline ke breakout par hota hai jabke bearish flag mein, entry point flag ke lower trendline ke breakout par hota hai. Breakout ke baad entry point ko confirm karne ke liye, traders ko price action aur volume ko closely monitor karna chahiye. Entry point ko determine karte waqt, traders ko risk aur reward ka balance rakhna chahiye taake unke trading decisions consistency maintain kar sake.

              8. Stop Loss Aur Target

              Har trade mein stop loss aur target ka hona zaroori hai. Stop loss ko flag ke opposite side ke breakout ke just neeche set karein aur target ko consolidation phase ki length ke hisab se set karein. Stop loss ko calculate karte waqt, traders ko risk tolerance aur trade ka time frame bhi madadgar hote hain. Target ko set karte waqt, traders ko risk reward ratio ko bhi dhyan mein rakhna chahiye. Stop loss aur target ko set karte waqt, traders ko market volatility aur flag pattern ki strength ko bhi consider karna chahiye.

              9. Flag Trading Strategies

              Flag trading strategies mein ek popular approach hai flag ke breakout par enter karna. Ismein traders entry point ko confirm karne ke baad trade karte hain aur stop loss aur target ko set karte hain. Another approach is to trade within the flag pattern itself, taking advantage of the range-bound price action until a breakout occurs. Traders can also combine flags with other technical indicators or chart patterns for more robust trading signals. For example, using a moving average crossover with a bullish flag breakout can provide a stronger buy signal.

              10. Flag Ko Validate Karna

              Flag ko validate karne ke liye, multiple timeframes aur indicators ka istemal kiya ja sakta hai. Yeh confirm karta hai ke flag formation genuine hai aur false signal nahi hai. Traders can use higher timeframes to validate flag patterns seen on lower timeframes. Additionally, technical indicators like moving averages, RSI, or MACD can be used to confirm the strength of the flag pattern. Flag ki validation ke liye traders ko multiple confirmatory signals ko dekhna chahiye jisse unka trading decision more reliable ban sake.

              11. Flag Aur Other Technical Analysis Tools

              Flags ko other technical analysis tools ke saath combine karke bhi istemal kiya ja sakta hai jaise ke moving averages, Fibonacci retracements, aur oscillators. Yeh aur zyada strong trading signals provide karte hain. By combining flags with other technical tools, traders can enhance their trading strategies and increase the probability of successful trades. For example, using a combination of Fibonacci retracement levels and bullish flag breakout can provide a stronger indication of potential price targets. Traders should experiment with different combinations of technical tools to find what works best for their trading style and preferences.

              12. Psychological Aspects

              Forex trading mein psychological aspects ka bhi bohot ahem role hota hai. Flags ke istemal se traders apne emotions ko control karke logical trading decisions le sakte hain. Emotional discipline is crucial when trading flags as it requires patience to wait for the proper setup and discipline to follow the trading plan. By mastering the psychological aspects of trading, traders can improve their overall performance and consistency. Traders should develop a strong mindset and emotional resilience to overcome the challenges of trading, including dealing with losses and managing stress.

              13. Practice Aur Patience

              Flags ko samajhne aur unka istemal karne ke liye practice aur patience ki zaroorat hoti hai. Beginners ko demo accounts par practice karte hue flags ko recognize aur trade karna seekhna chahiye. Patience is key when trading flags as it may take time for the pattern to develop and for the breakout to occur. By practicing patience, traders can avoid impulsive decisions and wait for high-probability trading opportunities. Continuous practice is essential for traders to gain experience and improve their skills in identifying and trading flag patterns effectively.

              14. Risk Management

              Har trading strategy mein risk management ka hona zaroori hai. Flags ko istemal karte waqt, traders ko apne capital ko protect karne ke liye risk ko manage karna chahiye. Risk management is essential when trading flags as it helps to minimize losses and protect capital. Traders should always use stop-loss orders to limit potential losses and should never risk more than a certain percentage of their trading capital on any single trade. By implementing effective risk management techniques, traders can safeguard their capital and preserve their trading account in the face of market uncertainties.

              15. Conclusion

              Forex trading mein flags ka istemal karke traders apne trading strategies ko enhance kar sakte hain. Flags ki sahi understanding aur istemal se, traders market trends ko samajh sakte hain aur successful trading decisions le sakte hain. By mastering the art of flag trading, traders can improve their trading skills and increase their profitability in the forex market. Is article mein humne dekha ke Forex trading chart par flags kaise lagaye ja sakte hain aur unka istemal kaise karein. Flags ek powerful technical analysis tool hain jo traders ko market trends ko samajhne aur trading opportunities ko identify karne mein madad karta hai. By understanding the different types of flags, recognizing their formations, and implementing effective trading strategies, traders can gain a competitive edge in the forex market.
              • #8 Collapse

                1. Introductions: Trading charts samundari data ki visual representation hote hain, jo traders ko price movements ka tajziya karne, trends ko pehchanne aur sahi faislay karne mein madad karte hain. Trading charts par jhanday lagana technical analysis ka aham hissa hai, jo traders ko market behavior ko samajhne ke liye visual cues faraham karta hai. Jhanday mukhtalif technical indicators, chart patterns ya trend lines ko represent kar sakte hain, jo traders ko potenti entry aur exit points, trend reversals aur continuation patterns ko dekhne mein madad deta hai. Jhanday ko trading charts par lagana seekh kar, traders apni trading performance ko behtar bana sakte hain.
                2. Chart Platform Ka Intikhab: Sahi charting platform ka intikhab karna traders ke liye zaroori hai taake wo market data ko behtar tor par analyze kar sakein aur trades execute kar sakein. MetaTrader 4 (MT4), apni user-friendly interface aur advanced charting tools ke liye mashhoor hai aur forex traders ke darmiyan pasand kiya jata hai. TradingView, jiska bharpoor library of technical indicators aur customizeable charts hai, beginners aur experienced traders dono ke liye aik achi choice hai. Interactive Brokers aik comprehensive trading platform pesh karta hai jis mein advanced charting capabilities shamil hain, ideal hai active traders aur institutional investors ke liye. Jab charting platform ka intikhab karte hue, traders ko asani se istemal, mojooda features, technical analysis tools aur unke trading style aur preferences ke mutabiq compatibility ka ghor karna chahiye.
                3. Jhanday Ka Size Aur Type Chunein: Jhanday mukhtalif sizes aur types mein aate hain, har ek trading strategy ke liye mukhtalif hai. Moving average flags moving averages ka istemal karke trend aur potential reversals ko pehchanne mein madad karte hain. Trendline flags trendlines ka istemal karke chart par significant support aur resistance levels ko highlight karte hain. Candlestick pattern flags candlestick formations ke base par key reversal ya continuation patterns ko represent karte hain. Traders ko apni trading strategy, timeframe aur risk tolerance ke mutabiq sahi size aur type ka flag choose karna chahiye. Alag alag flag sizes aur types ke saath experiment karke traders ko ye pata chalta hai ke konse flags unke trading analysis mein sab se zyada effective hote hain.
                4. Jhanday Ki Colors Aur Styles: Flag colors aur styles ko customize karna chart readability aur visual interpretation ko behtar banane ke liye zaroori hai. Chamakdar aur mukhtalif rangon ka istemal bullish aur bearish flags ko alag karna asan bana deta hai, traders ko market trends aur patterns ko pehchanne mein madad milti hai. Mukhtalif styles jaise solid lines, dashed lines, ya dotted lines, kisi khaas flag formation ya price levels ko highlight karne mein madadgar hote hain. Traders ko alag alag rangon aur styles ka istemal karke apni trading preferences ko behtar banane aur apni chart analysis ko enhance karne ke liye experiment karna chahiye.
                5. Trend Lines Ka Istemal Karein: Trend lines traders ke liye powerful tools hote hain jo price movements ke trends ko pehchanne aur visualize karne mein madad karte hain. Consecutive highs ya lows ko connect karke, trend lines ek trend ka direction aur strength saaf tor par dikhate hain. Ek uptrend higher highs aur higher lows ke sath hota hai, jabke ek downtrend lower highs aur lower lows ke sath nazar aata hai. Trend lines dynamic support aur resistance levels ke tor par bhi kaam karte hain, traders ko trades enter ya exit karne ke decisions par asar dalte hain. Accurate trend lines banana practice aur precision ki zaroorat hai, lekin is skill ko sikhne se traders ko profitable trading opportunities ko pehchanne mein kafi madad milti hai.
                6. Support Aur Resistance Levels Ko Mark Karein: Support aur resistance levels technical analysis ka ek ahem hissa hote hain, jo traders ko market sentiment aur price movements ka andaza lagane mein madad karte hain. Support levels woh areas hote hain jahan buying interest selling pressure ko rokta hai, prices ko aur zyada girne se bachata hai. Resistance levels, doosri taraf, woh areas hote hain jahan selling pressure buying interest ko peechay chor deta hai, prices ko aur zyada upar nahi jane deta hai. In levels ko identify aur chart par mark karna traders ko potential price reversals ya breakouts ko anticipate karne aur apni trading strategies ko adjust karne ki ijazat deta hai. Support aur resistance levels ko manually draw karne ke liye historical price data par based ya technical indicators ya charting software ke zariye automate karna mumkin hai.
                7. Fibonacci Retracement Ka Istemal: Fibonacci retracement ek popular technical analysis tool hai jo traders ko price movements mein potential support aur resistance levels ko identify karne mein madad karta hai. Fibonacci sequence par based, retracement levels ko draw kiya jata hai jo significant high ya low ko connect karke, phir vertical distance ko key Fibonacci ratios jaise 23.6%, 38.2%, 50%, 61.8%, aur 100% se divide karte hain. Ye retracement levels aksar natural support aur resistance levels ke sath milte hain, traders ko possible price reversals ya continuation patterns ke bare mein valuable insights faraham karte hain. Fibonacci retracement ko various timeframes aur asset classes par apply kiya ja sakta hai, jo isay traders ke liye versatile tool banata hai.
                8. Chart Patterns Ko Dhundhein: Chart patterns price movements ke formations hote hain jo trading chart par ban jate hain, potential trend reversals ya continuations ko indicate karte hain. Aam chart patterns mein head and shoulders, triangles, flags, pennants, aur double tops/bottoms shamil hote hain. Har pattern ka apna khaas characteristic aur market direction ke liye implications hote hain, aur traders inhe trading opportunities ko pehchanne aur sahi entry aur exit points ko set karne ke liye istemal karte hain. Chart patterns ko pehchanne ke liye detail par tawajjo aur price action aur market psychology ka gehra understanding zaroori hota hai. Historical price data ko study karna aur pattern recognition ki practice karke, traders apni trading setups ko pehchanne mein behtar ho sakte hain aur apni trading profits ko maximize kar sakte hain.
                9. Price Action Ko Samajhna: Price action analysis price movements ko samajhne aur interpret karne par mabni hota hai bina traditional technical indicators ya chart patterns ke liye rely kiye. Individual candlesticks aur price bars ke behavior ko dekh kar, traders market sentiment aur potential future price movements ke valuable insights gain kar sakte hain. Price action signals jaise pin bars, engulfing patterns, aur inside bars reversals, continuations, ya market mein uncertainty ko indicate kar sakte hain. Price action analysis ko sikhne ke liye sabr, discipline, aur market dynamics ka gehra understanding zaroori hota hai. Traders jo price action trading mein mahir hote hain wo market mein unique faida hasil kar sakte hain aur consistent profitability ko achieve kar sakte hain.
                10. Technical Indicators Ka Istemal: Technical indicators mathematical calculations hote hain jo price aur volume data par apply kiye jate hain taake traders market trends ko analyze kar sakein aur trading opportunities ko identify kar sakein. Aam technical indicators mein oscillators, trend-following indicators, aur volume-based indicators shamil hote hain. Examples mein Relative Strength Index (RSI), Moving Average Convergence Divergence (MACD), aur Bollinger Bands shamil hain. Har indicator ke apne parameters aur interpretation rules hote hain, aur traders aksar multiple indicators ko combination mein istemal karte hain taake signals ko confirm kar sakein aur noise ko filter kar sakein. Technical indicators ki strengths aur limitations ko samajhna effective trading decision-making aur risk management ke liye zaroori hai.
                11. Multiple Timeframe Analysis: Multiple timeframe analysis price movements ko different timeframes par analyze karke market trends aur dynamics ko samajhne ke liye hota hai. Short-term, intermediate-term, aur long-term charts ka tajziya karke, traders high-probability trading opportunities ko identify kar sakte hain aur overall market context ka assessment kar sakte hain. Maslan, aik trader longer-term weekly chart ka istemal karke primary trend direction ko identify kar sakta hai aur phir shorter-term daily ya hourly charts ko istemal karke entry aur exit points ko determine kar sakta hai. Multiple timeframe analysis traders ko tunnel vision se bachata hai aur unhe apni strategies ko changing market conditions ke mutabiq adjust karne mein madad deta hai, jo ke zyada informed aur profitable trading decisions tak pohchata hai.
                12. Risk Management Ki Ahmiyat: Risk management successful trading ka aham pehlu hai, jo capital ko preserve karna aur trading risks ko effectively manage karna ki importance ko samjhaata hai. Traders various risk management techniques jaise ke stop-loss orders, position sizing, aur diversification ko istemal karke potential losses ko limit kar sakte hain aur apne trading accounts ko protect kar sakte hain. Risk parameters ko define karna aur strict risk management rules ko follow karna, traders ko adverse market movements ke asar ko kam karne aur unki trading results mein consistency banaye rakhne mein madad karta hai. Risk management ek ongoing process hai jo sabr, discipline, aur focus ko demand karta hai aur short-term gains ke bajaye long-term profitability par zyada tawajjo dena chahiye.
                13. Practice Aur Learning: Practice aur continuous learning traders ke liye zaroori hai apne skills ko develop karne aur financial markets mein aage rehne ke liye. Traders historical price data ka tajziya karke, trading charts ko study karke, aur technical analysis techniques ko practice karke apni charting skills ko improve kar sakte hain. Simulated trading ya paper trading mein shamil hona bhi traders ko experience gain karne aur apni trading strategies ko test karne mein madadgar hai bina real money risk kiye. Is ke ilawa, market news, economic events, aur emerging trends par updated rehna valuable insights aur trading opportunities faraham kar sakta hai. Time aur effort ko practice aur learning mein invest karne se, traders apne trading edge ko sharpen kar sakte hain aur apne financial goals ko achieve kar sakte hain.
                14. Conclusion: Trading charts par jhanday lagana traders ke liye zaroori skill hai jo unhe market trends ko analyze karne, trading opportunities ko pehchanna aur informed decisions lene mein madad karta hai. Is article mein discuss kiye gaye techniques ko maahir karke, traders apni chart analysis skills ko enhance kar sakte hain aur apni trading performance ko behtar bana sakte hain. Chahe aap ek naye trader hon ya phir ek experienced investor, flags ko apni trading strategy mein shamil karke market dynamics ko samajhne mein aur apne trading goals ko achieve karne mein madad milti hai. Yaad rakhein ki sabr, discipline, aur risk management ko follow karna zaroori hai, aur hamesha market developments ke bare mein updated rehna chahiye taake aap trading ke competitive duniya mein aage rahein.
                • #9 Collapse

                  How to Place a Flag on Trading Chart.


                  Click image for larger version

Name:	download (4).jpg
Views:	65
Size:	13.6 کلوبائٹ
ID:	12948892


                  Trading chart par ek flag lagana aam tor par ek "flag pattern" ko pehchanna hai. Ye pattern traders ke liye hota hai takay woh maali markets mein potential trend continuation opportunities ko pehchan sakein. Yahan ek general guide hai ke flag pattern ko kaise pehchana aur trading chart par kaise lagaya jata hai:
                  1. Trend Ka Pehchan Karna: Flag patterns ke talash mein jaate waqt, mahatvapurna hai ke maujooda trend ko pehchana jaye. Flags aam tor par continuation patterns hote hain, matlab unka paida hona maujooda trend ke context mein hota hai. Trend ooncha (bullish), neecha (bearish) ya fir sideways (neutral) ho sakta hai.
                  2. Flagpole Ko Pehchana: Flag pattern do mukhya components se milta hai: flagpole aur flag khud. Flagpole woh pehli taqatwar price move hoti hai jo flag pattern ke banaavat se pehle hoti hai. Ek uptrend mein, flagpole ek ooncha move hota hai, jabki ek downtrend mein, woh ek neecha move hota hai.
                  3. Trendlines Ka Draw Karna: Flagpole ko pehchane ke baad, aap trendlines draw kar sakte hain flag pattern ko outline karne ke liye. Ek bullish flag ke liye, highs ko flagpole se jodne wali trendline draw karein, phir ek parallel trendline draw karein jo consolidation phase ke lows ko jodti hai (flag). Ek bearish flag ke liye, yeh ulta hota hai: flagpole ke lows ko jodein aur consolidation phase ke highs ko jodne wali ek parallel trendline draw karein.
                  4. Pattern Ko Confirm Karna: Jab trendlines draw ho jayein, confirm karein ke price action flag pattern ke typical characteristics ke mutabiq hai. Ismein ek relatively short consolidation phase hota hai (flag) jo flagpole ko follow karta hai, jahan price trendlines ke boundaries ke andar oscillate karta hai.
                  5. Entry aur Exit Points: Traders aksar ek trade mein dakhil hone ki koshish karte hain jab price prevailing trend ke direction mein consolidation phase se bahar nikalti hai. Ek bullish flag ke liye, yeh matlab hota hai ke jab price upper trendline ke upar se bahar nikalti hai, toh ek long position mein dakhil ho jayein. Ulta, ek bearish flag ke liye, traders consolidation phase ke lower trendline ke neeche nikalne par short position mein dakhil ho sakte hain. Risk ko manage karne ke liye stop-loss orders ko flag ke low ke neeche rakha ja sakta hai (bullish flags ke liye) ya flag ke high ke upar (bearish flags ke liye). Profit targets ko breakout point se projected kiya ja sakta hai flagpole ki height ke basis par.
                  6. Risk Management: Jaise ki kisi bhi trading strategy mein, sahi risk management techniques ko implement karna zaroori hai, jaise ki stop-loss orders set karna aur positions ka sahi size karna, taaki nuksan ke khilaf bachaya ja sake.

                  Yaad rakhein ke jabki flag patterns potential trading opportunities ko pehchane mein madadgar ho sakte hain, woh foolproof nahi hote, aur effective trading decisions ke liye unhe doosri forms ke analysis aur risk management strategies ke saath combine karna zaroori hai.
                  • #10 Collapse

                    Trading Chart Par Jhanday Ki Jagah Kaise Tay Karen
                    1. Muhim: Trading Chart Par Jhanday Ki Maqamiyat

                      Trading chart par jhanday lagana ek ahem amal hai jo tajurba aur dhang se karna zaroori hai. Jhanday chart par mukhtalif indicators, patterns, aur price action ko samajhne ka zariya hote hain. In jhandon ki sahi jagah tay karna trading ke liye zaroori hai taake sahi faislay kiye ja sakein.

                      Trading chart par jhanday ki maqamiyat ke tajurba karne se traders ko market ki movement, trend changes, aur price action ka behtar andaza ho jata hai. Yeh ek mukhtasar lekin ahem tareeqa hai market ko samajhne ka.
                    1. Chart Par Jhanday Ki Ahmiyat

                      Jhanday lagana chart par aham hai taake trends ko samjha ja sake aur trading decisions liya ja sake. Jhanday chart par traders ko market ki movements ko samajhne aur samne wale patterns ko pehchanne mein madad milti hai.

                      Jhanday lagana aik tarika hai jo traders ko market ke direction aur momentum ka andaza dene mein madad karta hai. Is ke zariye traders trends aur reversals ko samajh sakte hain aur trading strategies ko istemal karke faida hasil kar sakte hain.
                    1. Sahi Jaga Chunanay ka Tareeqa

                      Jhanday ki jagah chunne ka tareeqa tajurba, technical analysis aur trend ko samajhne par mabni hona chahiye. Yeh ek mushkil aur maharat se bhari task hai jo traders ko mehnat aur istiqamat se karne ki zaroorat hoti hai.

                      Sahi jaga chunne ke liye traders ko market ki tafteesh karni chahiye, jismein support aur resistance levels, trend lines, aur price patterns shamil hote hain. Iske ilawa, traders ko multiple time frames ka istemal karna chahiye taake sahi jaga chunne mein madad mile.
                    1. Trend ki Tafteesh

                      Chart par trend ki tafteesh karein taake samajh mein aaye ke uptrend, downtrend ya sideways market hai. Trend ki tafteesh karne ke liye traders ko price action ko observe karna chahiye aur moving averages jaise indicators ka istemal karke trend ki direction ko confirm karna chahiye.

                      Trend ki tafteesh ke doran traders ko market ki movements ko samajhna aur sahi samay par entry aur exit points ka faisla karna chahiye. Trend ki tafteesh karne se traders ko market ke overall direction ka andaza ho jata hai, jo unhein sahi trading decisions lene mein madad karta hai.
                    1. Support aur Resistance Levels Ka Taeen

                      Support aur resistance levels ko taeen karna jhanday ki jagah chunne mein madadgar hota hai. Support aur resistance levels market mein mukhtalif price points hote hain jo traders ko price ke behavior ko samajhne mein madad karte hain.

                      Support level woh price point hota hai jahan se price girne ke baad rebound karne ka imkan hota hai, jabke resistance level woh price point hota hai jahan se price barhne ke baad ruk karne ka imkan hota hai. In levels ko taeen karke traders apne trading strategies ko improve kar sakte hain aur sahi entry aur exit points tay kar sakte hain.
                    1. Moving Averages Ka Istemal

                      Moving averages ka istemal karke trend ko samajhne aur jhanday ki jagah tay karne mein asani hoti hai. Moving averages market ki price ki average value ko calculate karte hain aur traders ko trend ka direction dikhate hain.

                      Short-term moving averages, jaise ke 20-day aur 50-day moving averages, aur long-term moving averages, jaise ke 100-day aur 200-day moving averages, ka istemal karke traders trend ke direction ko confirm kar sakte hain aur sahi jaga chun sakte hain.
                    1. Price Action Ki Tadrees

                      Price action ko samajh kar jhanday ki jagah tay karne mein madad milti hai. Price action traders ko market ki current aur past price movements ko samajhne mein madad karta hai aur sahi trading decisions lene mein madad deta hai.

                      Price action analysis mein traders market ke price movements ko naked eye se dekhte hain aur patterns aur signals ko pehchantay hain. Yeh ek powerful technique hai jo traders ko market ki behavior ko samajhne mein madad deta hai aur sahi entry aur exit points tay karne mein madad karta hai.
                    1. Volume ki Ahmiyat

                      Volume ki tafteesh karke jhanday ki jagah chunne mein asani hoti hai. Volume market mein kiye gaye transactions ka volume ko represent karta hai aur traders ko market ki liquidity aur momentum ka andaza deta hai.

                      High volume ke sath price ka barhna ya ghatna ek strong signal hota hai aur low volume ke sath price ka movement weak hota hai. Volume ki tafteesh karke traders market ki sentiment aur direction ko samajh sakte hain aur sahi trading decisions lene mein madad le sakte hain.
                    1. Indicators ka Istemal

                      Indicators ka istemal karke trend aur market ki mizaji ko samajh kar jhanday ki jagah tay ki ja sakti hai. Indicators market ki price aur volume ke patterns ko analyze karte hain aur traders ko trading signals provide karte hain.

                      Mukhtalif indicators, jaise ke RSI (Relative Strength Index), MACD (Moving Average Convergence Divergence), aur Bollinger Bands, ka istemal karke traders market ki behavior ko samajh sakte hain aur sahi trading decisions lene mein madad le sakte hain.
                    1. Risk aur Reward ka Tawazun

                      Jhanday ki jagah tay karte waqt risk aur reward ka tawazun banaye rakhna zaroori hai. Risk aur reward ka tawazun traders ko trading strategies ko optimize karne mein madad deta hai aur trading ke losses ko minimize karne mein madad karta hai.

                      Traders ko sahi risk management techniques ka istemal karna chahiye aur apne trading positions ko manage karte waqt risk aur reward ka tawazun banaye rakhna chahiye. Iske ilawa, traders ko apne trading goals aur risk tolerance ke mutabiq trading decisions lena chahiye.
                    1. Multiple Time Frame Analysis

                      Muktalif time frames par analysis karke jhanday ki jagah tay karna faida mand ho sakta hai. Multiple time frame analysis traders ko market ki movements ko mukhtalif time frames par dekhne aur samajhne mein madad deta hai.

                      Traders ko short-term aur long-term time frames ka istemal karke market ki behavior ko samajhna chahiye aur sahi trading decisions lene ke liye mukhtalif time frames par analysis karna chahiye. Iske zariye traders market ke overall direction aur trend changes ko samajh sakte hain aur sahi entry aur exit points tay kar sakte hain.
                    1. Tajurba aur Sabr

                      Tajurba aur sabr se jhanday ki jagah chunne ka tareeqa behtar ho sakta hai. Tajurba traders ko market ki behavior ko samajhne aur sahi trading decisions lene mein madad deta hai.

                      Tajurba ke zariye traders apne previous trades se seekh sakte hain aur apni trading strategies ko improve kar sakte hain. Iske ilawa, traders ko sabr se kaam lena chahiye aur market ke fluctuations ko samajhne mein waqt dena chahiye.
                    1. Backtesting ka Tareeqa

                      Backtesting karke pichlay trends aur signals ka mutala karna jhanday ki jagah tay karne mein madadgar ho sakta hai. Backtesting traders ko apni trading strategies ko test karne aur optimize karne ka moka deta hai.

                      Traders ko apni trading strategies ko historical market data par test karna chahiye aur sahi entry aur exit points ka tay karna chahiye. Iske zariye traders apne trading strategies ko improve kar sakte hain aur sahi trading decisions lene mein madad le sakte hain.
                    1. Demo Trading ka Istemal

                      Demo trading se jhanday ki jagah tay karte waqt ghalatiyon ka moka milta hai aur seekhne ka dor barqarar rehta hai. Demo trading ek mufeed tareeqa hai jhanday ki jagah tay karne aur trading strategies ko test karne ka.

                      Demo trading mein traders virtual money ka istemal karte hain aur real market conditions par trading karte hain. Iske zariye traders apne trading skills ko improve kar sakte hain aur sahi trading decisions lene mein behtar ban sakte hain.
                    1. Aakhir Mein, Zati Tehqiqat aur Tajarbay ka Istemal

                      Apni zati tehqiqat aur tajarbay ka istemal karke jhanday ki jagah tay karna aakhir mein asani aur durusti se mumkin ho sakta hai. Har trader ka apna tajurba aur approach hota hai jo unhein sahi jaga chunne mein madad deta hai.

                      Traders ko apne trading journey mein mukhtalif strategies aur techniques ko test karna chahiye aur apne tajarbay ka istemal karke sahi trading decisions lene chahiye. Iske ilawa, traders ko apne weaknesses ko pehchan kar un par kaam karna chahiye aur apne strengths ko istemal karke apni trading performance ko behtar banane ka pesh qadam lena chahiye.
                    • #11 Collapse

                      Trading Chart Pe Flag Ka Ban'na:!:!:!:!:!

                      Trading charts mein flag pattern ek common technical analysis tool hai jo price action ko identify karne aur future price movements ka estimate lagane mein madad karta hai. Flag pattern usually ek temporary pause ya consolidation phase ko represent karta hai, jahan price ek recent trend ke against move karta hai before fir se us trend ki direction mein move karna shuru karta hai.


                      Flag pattern usually ek rectangle ya parallelogram shape mein hota hai, jismein price ek sharp move (upward ya downward) ke baad ek relatively calm phase mein rehta hai aur phir wahi trend continue hota hai.

                      Trading Chart Pe Flag Ka Ban'na Ke Ehem Nukaat:!:!:!:!:!

                      ek aur important point flag patterns ke bare mein hai ki ye typically short-term ya intermediate-term trends ke liye useful hote hain. Agar ek trader flag pattern ka istemal kar raha hai, toh wo ideally short to medium term timeframes jaise ki 15-minute, 1-hour, ya 4-hour charts par focus karega.

                      Flag patterns ke sath trading karte waqt, kuch important points hote hain jo traders ko dhyan mein rakhna chahiye:
                      1. Volume: Flag pattern ke breakout ke time par volume ka role important hota hai. Agar breakout volume ke saath hota hai, toh ye breakout strong hota hai aur uski credibility badhti hai.
                      2. Entry aur Exit Points: Flag pattern ke entry aur exit points ko define karna important hota hai. Entry typically breakout ke baad kiya jata hai, jab price trend ki direction mein fir se move karta hai. Exit points ko define karne ke liye stop loss aur target levels set kiye jaate hain.
                      3. Confirmation: Flag pattern ke breakout ko confirm karne ke liye additional technical indicators ka istemal kiya ja sakta hai, jaise ki moving averages, RSI (Relative Strength Index), ya MACD (Moving Average Convergence Divergence).
                      4. Risk Management: Lagatar risk management ka dhyan rakhna bhi zaroori hai. Position size ko sahi tareeke se manage karna chahiye aur stop loss orders ka istemal karna chahiye taaki losses ko control kiya ja sake.

                      Flag pattern ek versatile tool hai, lekin jaise ki kisi bhi technical analysis tool ki tarah, ye bhi kabhi-kabhi galat ho sakta hai. Isliye, sahi knowledge aur experience ke saath hi iska istemal karna chahiye.
                      • #12 Collapse

                        1. Introduction: Trading charts are essential tools for traders to analyze price movements and make informed decisions. Placing flags on these charts can provide valuable insights into market trends and potential trading opportunities. Whether you are a beginner or an experienced trader, understanding how to effectively place flags on trading charts is crucial for success in the financial markets.

                        2. Jhanday Ka Maqsad: Jhanday chart par laganay ka maqsad market trends ko samajhna aur trading ke liye sahi waqt ka intezar karna hai. Jhanday aam tor par price fluctuations ko darust karnay ke liye istemal hotay hain. In flags ka maqsad traders ko market ke movements ka pata lagana aur potential trading opportunities ko identify karna hota hai.

                        3. Chart Analysis: Chart analysis shuru karne se pehle, zaroori hai ke aap market ke trends ko samajhain. Ismein past price movements aur current market conditions ka tajziya shamil hai. Chart analysis ke dauran traders ko market ke direction ka pata lagana hota hai taake woh sahi waqt par trades execute kar sakein.

                        Chart analysis ka ek important aspect hai technical analysis, jismein traders price charts, indicators, aur patterns ka istemal karte hain market movements ko predict karne ke liye. Technical analysis ke saath saath fundamental analysis bhi zaroori hoti hai jismein economic indicators, news events, aur company financials ka tajziya kiya jata hai.

                        4. Chart Type Select Karein: Different types of charts hote hain jaise line charts, bar charts, aur candlestick charts. Apne preference ke mutabiq chart type ko select karein jo aapko sabse zyada comfortable feel ho.

                        Line charts straight lines ka istemal karte hain price movements ko represent karne ke liye, jab ke bar charts bars ka istemal karte hain. Candlestick charts sabse popular charts mein se ek hain jo price movements ko candlesticks ke form mein darust karte hain. Har chart type ke apne benefits aur drawbacks hote hain, isliye traders ko apne requirements ke mutabiq chart type select karna zaroori hai.

                        5. Trend Identification: Jhanday laganay se pehle, trend ka pata lagana zaroori hai. Agar market uptrend mein hai to jhanday ko upar ki taraf lagana behtar hai, jab ke downtrend mein hain to jhanday ko neechay ki taraf lagana behtar hai. Trend identification market analysis ka ek crucial aspect hai jise traders ko samajhna zaroori hai.

                        Trend ko identify karne ke liye traders price charts par trend lines ka istemal karte hain jo market ke direction ko darust karte hain. Uptrend mein trend line ko neechay se draw kiya jata hai jab ke downtrend mein trend line ko upar se draw kiya jata hai. Iske saath saath traders ko price action aur indicators ka bhi istemal karna chahiye trend identification ke liye.

                        6. Flag Parameters: Jhanday ko laganay ke liye kuch parameters hote hain jaise price level, trend direction, aur time frame. In parameters ko samajhna aur istemal karna zaroori hai jhanday ko sahi tareeqay se lagane ke liye.

                        Price level ka selection karte waqt traders ko support aur resistance levels ka bhi dhyan rakhna chahiye. Trend direction ke mutabiq flags ko place karna zaroori hai taake woh market ke current trend ke sath match karein. Time frame ka selection bhi important hai jhanday ko lagane ke liye, kyun ke different time frames par flags ke patterns alag ho sakte hain.

                        7. Lagane Ka Tareeqa: Jhanday ko chart par lagane ke liye, pehle chart par trend lines aur support/resistance levels ko identify karein. Phir jhanday ko appropriate price level par lagayein.

                        Jhanday ko lagane ke liye traders ko price level par horizontal lines draw karna hota hai. Iske baad traders ko flags ko appropriate price level par lagakar confirm karna hota hai. Lagane ke baad, traders ko apne trades ko monitor karte rehna chahiye taake woh market ke movements ka pata laga sakein.

                        8. Price Confirmation: Jhanday lagane se pehle, price confirmation zaroori hai. Yani ke jhanday ka price level sahi hona chahiye aur trend ke mutabiq hona chahiye. Price confirmation ke liye traders ko multiple time frames par price analysis karna chahiye taake woh sahi price level ko confirm kar sakein.

                        Price confirmation ke liye traders ko technical indicators ka bhi istemal karna chahiye jaise ke moving averages, RSI, aur MACD. In indicators ki madad se traders ko price movements ka confirmation milta hai aur woh sahi waqt par trades execute kar sakte hain.

                        9. Time Frame Consideration: Jhanday ko lagane se pehle, time frame ko consider karna zaroori hai. Chhota time frame par lagaye gaye jhanday ko zyada closely monitor karna hota hai compared to longer time frames.

                        Time frame ka selection traders ke trading style aur objectives par depend karta hai. Agar short-term trading karna hai to chhota time frame select karna behtar hai jab ke long-term trading ke liye longer time frame select karna recommended hai. Time frame selection mein traders ko apne risk tolerance level ko bhi consider karna chahiye.

                        10. Risk Management: Har trading strategy mein risk management ka ek ahem hissa hota hai. Jhanday lagane se pehle, apne risk tolerance level ko samajhkar aur stop-loss orders ka istemal karke apna risk manage karein.

                        Risk management ka maqsad traders ko apne trading positions ki risk ko control karne mein madad karta hai. Stop-loss orders lagakar traders apne losses ko minimize kar sakte hain aur apne capital ko protect kar sakte hain. Risk management ke dauran traders ko apne trading plan ko strictly follow karna chahiye.

                        11. Monitoring and Adjustment: Jhanday ko lagane ke baad, market ko monitor karte rahein aur zaroorat par adjust karte rahein. Agar market conditions change ho jayein to jhanday ko update karna zaroori ho sakta hai.

                        Market monitoring ka maqsad traders ko market ke movements ka pata lagana hai taake woh apne positions ko adjust kar sakein. Agar market ke conditions change ho jayein to traders ko apne flags ko update karna chahiye taake woh current market trends ke mutabiq trading kar sakein.

                        12. Learning from Experience: Apni trading journey mein har naye experience se seekhna zaroori hai. Jhanday lagane ke baad, apne trades ka performance analyze karein aur future mein behtar decisions ke liye seekhain.

                        Learning from experience traders ko apne mistakes se seekhne aur apne trading skills ko improve karne mein madad karta hai. Jhanday lagane ke baad, traders ko apne trades ka performance analyze karke apne trading strategies ko refine karna chahiye taake woh future mein behtar results achieve kar sakein.

                        13. Conclusion: Jhanday chart par lagane ka tareeqa trading mein ek ahem hissa hai. Sahi tareeqay se jhanday lagakar, traders market trends ko samajh sakte hain aur sahi waqt par trades execute kar sakte hain. Iske liye chart analysis, risk management, aur constant monitoring zaroori hai. Trading charts par flags lagane ke tareeqe ko samajhne aur sahi tareeqay se istemal karne se traders apne trading skills ko improve kar sakte hain aur consistent profits earn kar sakte hain.

                        • #13 Collapse


                          HOW TO PLACE A FLAGE ON TRADING CHART DEFINITION

                          Make sure ke condition particular strategy ki trading ke liye suitable hai Ek Trigger set Karen jo aapko tell ke ab act karne ka time a gaya hai Ek Stop loss and target set Karen and phir determine Karen ke whether reward risk se out weighs Hai agar aisa hota hai to trade le lo agar aisa Nahin hota hai to better opportunity look karo other factor per consider Karen jo aapki trading ko affect kar sakte hain and Agar required ho to additional step ko implement Karen is scenario mein aap ya to market Mein ASAP sell kar sakte hain ya trailing stop Laga sakte hain Ta ke aap minimum Kuch profit gather Kar saken Jab Ke other up side attempt ki l allowing thien


                          FIGURE ONE STOCK IN UPTREND THAT APPEAR IN TO BE FAILING BULLISH YA BEARISH

                          Figure one main chart nividia stock ko ek up channel Mein show karta hai Jo Hamen two potential set up deta hai pahla set up higher trend ke Sath Jana Hai Jahan two hundred fourty$ key daily resistance point look aata hai and Higher move ko continuation rakhne ke liye Trigger hai Jo Bullish ka set up two hundred fourte$ sy above daily close ho jaega is case Mein Trigger


                          THE TRADE TRIGGER

                          Downside parasol ke liye Trigger ab channel ke vilo Ek break hai jo currently two hundred thirty$ ke around hai and sharply rising ho raha hai dusre potential short trade Trigger ichimuko ki tinkan line and kijun line ke Barish crossover ko found out Karke looking Kiye Ja sakte hain other negative signal ADX mein bearishly main appearance Hota Hai Jo recent new high se match nahi tha and currently declining hai yeh suggest Karta Hai Ke trend weakening ho raha hai and ho sakta hai ending ho raha hai Agar aapki trade ki reason present hai to aapki abhi bhi Ek precise event ki need hai jo aapko bataenge ab trade ka time a gaya hai above chart main stock recent weeks main ek up trend main Aage moving ho raha tha but recently stalled ho gaya hai and sideway ke pattern mein consolidating hona Begun kar diya hai abhi bhi up channel mein remaining hai
                          • #14 Collapse

                            Introduction: Forex trading mein, trading chart par jhanday lagana aham hai taake traders ko trend aur price movement ka pata chale. Jhanday lagana ek technical analysis ka hissa hai jo traders ko market ke future direction ke baare mein idea deta hai. Yeh article aapko sikhaega ke forex trading chart par jhanday kaise lagayein aur kis tarah se is technique ko istemal karke trading performance ko improve kiya ja sakta hai.
                            1. Jhanday Ki Ahmiyat: Jhanday lagana forex trading mein trend aur price movement ka andaza lagane mein madadgar hota hai. Jhanday chart par trend aur support/resistance levels ko samajhne mein madad deta hai. Yeh ek visual indicator hai jo traders ko market ke current sentiment ko samajhne mein madad deta hai. Jhanday ke patterns ko samajh kar, traders trend reversals aur price breakouts ka pata lagate hain jo unhe profitable trading opportunities provide karte hain.
                            2. Chart Platform Chunein: Sab se pehle, aapko ek charting platform chunna hoga jaise MetaTrader 4 ya MetaTrader 5. Ye platform traders ko advanced tools aur indicators provide karte hain. In platforms par aap alag alag currency pairs aur timeframes choose kar sakte hain jo aapki trading strategy ke anusar ho.

                            MetaTrader 4 aur MetaTrader 5 ke saath, aapko access milta hai various technical indicators aur drawing tools jo aapko market analysis mein madad karte hain. In platforms ka use karna aapko real-time market data aur trading opportunities ke liye empower karta hai.
                            1. Trading Chart Open Karein: Apne chosen charting platform par trading chart open karein. Ismein aapko currency pairs aur timeframes select karne ki suvidha milti hai. Trading chart ko open karte waqt, dhyan dein ki aapka chart clear aur easy to read ho. Cluttered charts se trading decisions lena mushkil ho sakta hai.
                            2. Flag Indicator Search Karein: Flag indicator aapko trading platform ke library mein mil sakta hai. Iske liye aap 'flag' ya 'flag pattern' search kar sakte hain. Agar aapko flag indicator nahi milta hai to aap third-party sources se bhi ise download kar sakte hain. Flag indicator chart par flag patterns ko detect karta hai aur unhe traders ko highlight karta hai.

                            Flag indicator ka use karne se pehle, aapko iske settings ko customize karna hoga jaise ki pattern ki sensitivity aur colors. Har trader ka apna preference hota hai, isliye apne requirements ke hisab se indicator ko adjust karein.
                            1. Indicator Ko Chart Par Apply Karein: Flag indicator ko chart par apply karne ke liye, simply indicator ko drag karke chart par drop karein. Fir settings customize karein agar zarurat ho. Indicator ko chart par apply karte waqt, dhyan dein ki indicator clear aur easily visible ho. Isse aapko patterns ko sahi tarah se identify karne mein madad milegi.

                            Flag indicator apply karne ke baad, aapko chart par flag patterns ko closely monitor karna hoga. Flag patterns ke variations aur unki significance ko samajhne ke liye practice aur experience ki zarurat hoti hai.
                            1. Flag Pattern Identify Karein: Flag pattern ko identify karne ke liye, chart par price movement ko closely observe karein. Flag pattern usually price consolidation ke baad hota hai. Yeh ek continuation pattern hota hai jo indicate karta hai ki market ka trend continue hone ki sambhavna hai.

                            Flag pattern ko identify karne ke liye, aapko chart par price action ko dhyan se dekhna hoga. Flag pattern ko recognize karne ke liye, aapko high aur low points ko connect karna hoga jo ek flag shape create karte hain.

                            Flag pattern ko samajhne ke liye, aapko market ki behavior aur previous price action ko analyze karna hoga. Flag patterns ki variations aur unke different forms ko recognize karna bhi important hai.
                            1. Entry Point Aur Stop Loss Tay Karein: Flag pattern identify karne ke baad, entry point aur stop loss tay karein. Entry point usually flag pattern ke breakout point par hota hai. Breakout point ko identify karne ke liye, traders ko price action aur volume ko closely monitor karna hota hai.

                            Entry point aur stop loss tay karte waqt, traders ko apne risk aur reward ka balance rakhna chahiye. Entry point ko determine karte waqt, traders ko price volatility aur market conditions ka bhi dhyan rakhna chahiye.

                            Stop loss lagane ka purpose hai traders ko apne losses ko control karne mein madad karna. Stop loss levels ko determine karte waqt, traders ko apne risk tolerance aur trading strategy ka bhi dhyan rakhna chahiye.
                            1. Risk Aur Reward Calculate Karein: Har trade mein risk aur reward ka balance rakhna zaroori hai. Entry point aur stop loss ke basis par apna risk aur reward calculate karein. Risk aur reward ka balance maintain karna traders ke liye crucial hai taake wo apne trading capital ko protect kar sakein.

                            Risk aur reward ko calculate karte waqt, traders ko apne trading plan aur financial goals ka bhi dhyan rakhna chahiye. Sahi risk aur reward ratio maintain karke, traders apne trading performance ko improve kar sakte hain aur consistent profits generate kar sakte hain.
                            1. Trade Execute Karein: Apne analysis ke mutabiq, trade execute karein. Entry point, stop loss aur target levels ko dhyan mein rakhte hue trade place karein. Trade execute karte waqt, traders ko apne trading plan ko follow karna chahiye aur emotional decisions se bachein.

                            Trade execution ke baad, traders ko apne positions ko monitor karna chahiye. Market ke movements ko closely observe karte hue, traders apne positions ko manage kar sakte hain aur profits maximize kar sakte hain.
                            1. Monitor Karein: Trade execute karne ke baad, market ko monitor karte rahein. Price movement ko closely observe karein aur position ko manage karein. Market ke movements ko regularly monitor karke, traders apne trading decisions ko refine kar sakte hain aur market trends ko better understand kar sakte hain.

                            Market ko monitor karte waqt, traders ko apne open positions aur upcoming trading opportunities ka bhi dhyan rakhna chahiye. Market ke volatility aur news events ko bhi monitor karna important hai taake traders apne positions ko effectively manage kar sakein.
                            1. Profit Ya Loss Book Karein: Jab trade apne target levels tak pahunch jaye ya stop loss hit ho jaye, profit ya loss book karein. Isse apne trading plan ko follow karne mein madad milti hai. Profit ya loss book karte waqt, traders ko apne trading performance ka analysis karna chahiye taake wo apne mistakes ko identify kar sakein aur apni trading strategy ko improve kar sakein.

                            Profit ya loss book karte waqt, traders ko apne emotional reactions ko control karna chahiye. Emotional decisions se bache kar, traders apne trading decisions ko rationalize kar sakte hain aur long-term success achieve kar sakte hain.
                            1. Trading Psychology Par Dhyan Dein: Trading mein success ke liye strong trading psychology ka hona zaroori hai. Emotions ko control karna aur disciplined trading approach maintain karna mushkil hota hai par zaroori hai. Trading psychology ko understand karke, traders apne emotional reactions ko control kar sakte hain aur apne trading decisions ko improve kar sakte hain.

                            Trading psychology ke important aspects mein patience, discipline, aur confidence shamil hain. Trading mein ups aur downs ke saath deal karte waqt, traders ko apne psychological well-being ka bhi dhyan rakhna chahiye taake wo apne trading journey mein consistent aur long-term success achieve kar sakein.
                            1. Learning Aur Improvement: Har trade se kuch seekhein aur apne trading skills ko improve karte rahein. Regularly market analysis karein aur apni strategy ko refine karein. Learning aur improvement ke liye, traders ko apne mistakes ko accept karna aur unse seekhna chahiye.

                            Market ke dynamic nature ko samajhne ke liye, traders ko apne knowledge aur skills ko regularly update karna chahiye. Technical analysis ke alawa fundamental analysis aur risk management techniques ko bhi explore karna important hai.

                            Learning aur improvement ke liye, traders ko trading community se connect rehna chahiye aur experienced traders se seekhna chahiye. Learning process ko ongoing banaye rakhkar, traders apne trading skills ko enhance kar sakte hain aur consistent profits generate kar sakte hain.
                            1. Conclusion: Jhanday lagana forex trading mein ek important technique hai. Sahi tareeqe se flag pattern identify karke, traders apne trading performance ko improve kar sakte hain. Discipline aur learning ke saath, traders apni trading journey mein success pa sakte hain. By following the steps mentioned above, traders can effectively incorporate flag patterns into their trading strategy and enhance their chances of success in the forex market.
                            • <a href="https://www.instaforex.org/ru/?x=ruforum">InstaForex</a>
                            • #15 Collapse

                              How to Place a Flag on Trading Chart?


                              Click image for larger version

Name:	download (1) (8).png
Views:	42
Size:	4.5 کلوبائٹ
ID:	12949677


                              **Trading Chart Par Flag Kaise Lagayein**
                              Flag ek technical analysis tool hai jo ke price action ko analyze karne aur trading opportunities ko identify karne ke liye istemal kiya jata hai. Flag typically trend continuation patterns ko represent karta hai aur traders ko market mein direction ke potential changes ka pata lagane mein madad karta hai. Niche diye gaye steps ko follow karke aap trading chart par flag lagana seekh sakte hain:

                              **1. Chart Analysis:**
                              Sab se pehle, aapko chart analysis karna hoga jisse aap trend ko identify kar sakein. Flag typically trend continuation pattern hota hai, isliye aapko pehle current trend ko determine karna hoga, yaani uptrend ya downtrend.

                              **2. Flag Formation:**
                              Flag formation typically ek sharp price movement ke baad hoti hai, jo ke ek pole ke roop mein dikhti hai. Yeh pole ek trend ke continuation ko represent karta hai. Uske baad, price mein ek consolidation phase aata hai, jo ke ek rectangular shape mein hota hai. Yeh consolidation phase flag ke roop mein dikhta hai.

                              **3. Highs aur Lows Connect Karein:**
                              Flag formation ke doran, highs aur lows ko connect karna important hai. Agar trend uptrend hai, to highs ko connect karein; agar downtrend hai, to lows ko connect karein. Yeh aapko flag ki boundaries provide karta hai.

                              **4. Breakout Ke Wait Karein:**
                              Flag formation ke baad, breakout ka wait karna zaroori hai. Agar price consolidation phase se bahar nikal kar trend ke opposite direction mein move karta hai, toh yeh breakout signal deta hai. Breakout typically high volume ke sath hota hai.

                              **5. Entry aur Exit Points Set Karein:**
                              Breakout ke baad, aapko entry aur exit points set karna zaroori hai. Agar price uptrend ke breakout kiya hai, to long position enter karein; agar downtrend ke breakout kiya hai, to short position enter karein. Stop-loss aur take-profit orders ko bhi set karna zaroori hai risk management ke liye.

                              **6. Confirmation Ke Liye Wait Karein:**
                              Kuch traders flag breakout ko confirm karne ke liye additional technical indicators ka istemal karte hain jaise volume analysis, moving averages, ya price oscillators. Yeh confirmation ko strengthen karta hai.

                              **7. Risk Management Ka Dhyan Rakhein:**
                              Har trading strategy mein risk management ka dhyan rakhna zaroori hai. Stop-loss orders ka istemal karke aap apne losses ko control kar sakte hain. Position size ko manage karke bhi aap apne risk ko minimize kar sakte hain.

                              **Niche di gayi steps ko follow karke, aap trading chart par flag ka istemal karke potential trading opportunities ko identify kar sakte hain aur market mein successful trading kar sakte hain.**

                              اب آن لائن

                              Working...
                              X