بولنجر بینڈز کی عملکردگی کو سمجھنے کے لئے، یہ ضروری ہوتا ہے کہ بینڈز کی چوڑائی کیا معنی رکھتی ہے۔ وولٹیلٹی کے درمیان فرق کو مختلف انفارمیشن فراہم کرتی ہے۔ بینڈز جو کبھی بھی بہت چوڑے ہوتے ہیں، ایک قیمتیں میں شدت پیدا کرتے ہیں، جبکہ وولٹیلٹی کی کمی معمولاً محافظت کے حالات میں راہ کا پتہ لگانے کے لئے استعمال ہوتی ہے۔ یہ ایک تجربہ کار ٹول ہے جو بائیں کی جانب، دائیں یا درمیانی لکیر کے نقشے پر بنائے گئے حرکت کی تبدیلیوں کو نشان دے سکتا ہے۔بولنجر بینڈز کی عملکردگی کو سمجھنے کے لئے، یہ ضروری ہوتا ہے کہ بینڈز کی چوڑائی کیا معنی رکھتی ہے۔ وولٹیلٹی کے درمیان فرق کو مختلف انفارمیشن فراہم کرتی ہے۔ بینڈز جو کبھی بھی بہت چوڑے ہوتے ہیں، ایک قیمتیں میں شدت پیدا کرتے ہیں، جبکہ وولٹیلٹی کی کمی معمولاً محافظت کے حالات میں راہ کا پتہ لگانے کے لئے استعمال ہوتی ہے۔ یہ ایک تجربہ کار ٹول ہے جو بائیں کی جانب، دائیں یا درمیانی لکیر کے نقشے پر بنائے گئے حرکت کی تبدیلیوں کو نشان دے سکتا ہے۔بولنجر بینڈز کی عملکردگی کو سمجھنے کے لئے، یہ ضروری ہوتا ہے کہ بینڈز کی چوڑائی کیا معنی رکھتی ہے۔ وولٹیلٹی کے درمیان فرق کو مختلف انفارمیشن فراہم کرتی ہے۔ بینڈز جو کبھی بھی بہت چوڑے ہوتے ہیں، ایک قیمتیں میں شدت پیدا کرتے ہیں، جبکہ وولٹیلٹی کی کمی معمولاً محافظت کے حالات میں راہ کا پتہ لگانے کے لئے استعمال ہوتی ہے۔ یہ ایک تجربہ کار ٹول ہے جو بائیں کی جانب، دائیں یا درمیانی لکیر کے نقشے پر بنائے گئے حرکت کی تبدیلیوں کو نشان دے سکتا ہے۔
-
MhammdukashaJunior Member

- Apr 2024
- 28
- 1
- 3
-
<a href="https://www.instaforex.org/ru/?x=ruforum">InstaForex</a> -
JawadbSenior Member
- Jan 2024
- 650
- 5
- 19
- 90 USD
Topic : Bollinger Bands Explained
1. Introduction:
Bollinger Bands ek technical analysis tool hai jo ke market volatility aur price movements ko evaluate karne mein madad deta hai. John Bollinger ne develop kiya tha aur ye bands price ke around ek volatility envelope create karte hain.
2. Kaise Kaam Karte Hain:
a. Middle Band (SMA): Bollinger Bands ke middle band usually ek simple moving average (SMA) hota hai jo ke price ke trend ko represent karta hai. Ye typically 20-period SMA hota hai.
b. Upper Band: Upper band ek standard deviation ke saath middle band ke upar plot kiya jata hai. Ye volatility ko measure karta hai aur usually 2 standard deviations ke upar hota hai middle band se.
c. Lower Band: Lower band bhi ek standard deviation ke saath middle band ke neeche plot kiya jata hai. Ye bhi volatility ko measure karta hai aur usually 2 standard deviations ke neeche hota hai middle band se.
3. Interpretation:
Bollinger Bands ka interpretation market volatility aur price movements ko samajhne mein madad karta hai:
a. Squeeze: Jab bands narrow ho jaate hain, toh yeh squeeze ka indication hota hai aur usually volatility ka sign hota hai.
b. Expansion: Jab bands wide ho jaate hain, toh yeh expansion ka indication hota hai aur usually price ka strong move hone ka sign hota hai.
4. Trading Strategies:
Bollinger Bands ko trading strategies ke taur par istemal karne ke liye kuch popular techniques hain:
a. Bollinger Bands Squeeze Strategy: Jab bands narrow ho jaate hain, toh traders breakout ka wait karte hain jisse unhe next price direction ka idea mil sake.
b. Mean Reversion: Jab price upper ya lower band ke near hota hai, toh yeh mean reversion ka sign ho sakta hai, jismein traders reversal ka wait karte hain.
5. Limitations:
a. False Signals: Bollinger Bands sometimes false signals generate kar sakte hain, especially choppy market conditions mein.
b. Not Standalone Indicator: Bollinger Bands ko doosre indicators ke saath istemal karna zyada reliable results produce karta hai.
6. Advantages:
Bollinger Bands ka istemal market volatility aur price movements ko samajhne aur trading opportunities ko identify karne mein madadgar hota hai. Ye versatile tool hai jo ke traders ko market analysis mein assist karta hai.
Bollinger Bands ek powerful technical analysis tool hai jo ke market volatility aur price movements ko evaluate karne mein madad deta hai. Traders ko iska sahi istemal karke market trends ko samajhne aur trading decisions ko improve karne mein madad milti hai. -
JulliMember
- Mar 2024
- 87
- 9
- 10
- 8 USD
Bollinger Bands ek technical analysis tool hai jo market volatility aur price movements ko analyze karne ke liye istemal kiya jata hai. Ye indicator, ek price chart ke upar aur niche bands ya lines create karta hai jo price ke around ek dynamic range ko represent karte hain. Bollinger Bands ko John Bollinger ne develop kiya tha, aur iska istemal traders aur investors ke liye market trends aur potential trading opportunities ko identify karne mein hota hai. Is article mein, hum Bollinger Bands ke concept, calculation, interpretation, aur trading strategies par baat karenge.
Bollinger Bands ka Concept:
Bollinger Bands, ek volatility indicator hai jo traders ko price volatility aur potential price reversals ko analyze karne mein madad karta hai. Ye indicator ek simple moving average ke around ek upper band aur ek lower band create karta hai. Upper band, 2 standard deviations upar jati hai from the SMA, jabki lower band 2 standard deviations niche jati hai from the SMA. Bollinger Bands ka primary concept ye hai ke jab price upper band ya lower band ko touch karta hai, toh ye indicate karta hai ke market overbought ya oversold ho sakta hai aur potential reversal ka chance hai.
Bollinger Bands ke Calculation:
Bollinger Bands ke calculation ke liye kuch steps hote hain:- Calculate the Simple Moving Average : Pehle, ek specific time period ke prices ka simple moving average calculate kiya jata hai. Commonly, 20-period SMA ka istemal kiya jata hai.
- Calculate the Standard Deviation: Uske baad, is SMA ke around ek standard deviation calculate kiya jata hai. Standard deviation, price volatility ko measure karta hai.
- Upper Bollinger Band Calculation: Upper band ke liye, SMA se 2 times standard deviation ko add kiya jata hai.
- Lower Bollinger Band Calculation: Lower band ke liye, SMA se 2 times standard deviation ko subtract kiya jata hai.
Bands ka Interpretation:
Bollinger Bands ke interpretation mein kuch key points hain:- Volatility Analysis: Bollinger Bands, market volatility ko represent karte hain. Jab bands wide hote hain, toh ye indicate karta hai ke market volatile hai. Jab bands narrow hote hain, toh ye indicate karta hai ke market mein kam volatility hai.
- Overbought aur Oversold Conditions: Jab price upper band ko touch karta hai, toh ye indicate karta hai ke market overbought ho sakta hai aur downward reversal ka chance hai. Jab price lower band ko touch karta hai, toh ye indicate karta hai ke market oversold ho sakta hai aur upward reversal ka chance hai.
- Trend Identification: Bollinger Bands ki madad se, traders market trends ko identify kar sakte hain. Jab bands ke beech mein price consistently move karta hai, toh ye indicate karta hai ke trend strong hai. Jab bands ke beech mein price consolidate hota hai, toh ye indicate karta hai ke market range-bound hai.
- Breakout Signals: Bollinger Bands ke breakout signals bhi important hote hain. Jab price upper band ya lower band ko break karta hai, toh ye indicate karta hai ke market mein potential breakout ka chance hai.
Trading Strategies:
Kuch common Bollinger Bands trading strategies niche diye gaye hain:- Bollinger Squeeze Strategy: Jab bands narrow hote hain aur price range-bound hota hai, toh ye indicate karta hai ke market squeeze ho raha hai. Agar price upper band ya lower band ko breakout karta hai, toh traders entry point determine kar sakte hain expecting a sharp price move.
- Mean Reversion Strategy: Jab price upper band ya lower band ko touch karta hai, toh ye indicate karta hai ke market overextended hai aur potential reversal ka chance hai. Is strategy mein, traders counter-trend trades lete hain expecting a price reversion towards the SMA.
- Trend Confirmation Strategy: Jab bands ke beech mein price consistently move karta hai, toh ye indicate karta hai ke trend strong hai. Traders is situation mein trend-following trades le sakte hain jab price band ko break karta hai.
- Volatility Breakout Strategy: Jab bands widen hote hain aur price spikes show karta hai, toh ye indicate karta hai ke market mein sudden volatility hai. Is strategy mein, traders quick trades lete hain expecting a continuation of the volatility-driven move.
Istemal aur Limitations:
Bollinger Bands ka istemal karne ke baad bhi kuch limitations hote hain:- False Signals: Bollinger Bands, false signals generate kar sakta hai especially during periods of low volatility.
- Not Standalone Indicator: Bollinger Bands ko always confirmatory indicators ke saath istemal karna chahiye. Ek individual indicator ke base par trading decisions lena risky ho sakta hai.
- Whipsaw Movements: Market mein whipsaw movements ke wajah se Bollinger Bands ka interpretation sometimes challenging ho sakta hai.
- Parameter Sensitivity: Bollinger Bands ke effectiveness parameter settings par depend karta hai. Different time periods aur standard deviation settings ko try karke traders ko apne trading style ke according customize karna chahiye.
In sab limitations ke bawajood, Bollinger Bands ek valuable technical analysis tool hai jo traders ko market volatility aur price movements ke bare mein insights provide karta hai. Lekin, iska istemal karne se pehle thorough analysis aur practice zaroori hai.
-
<a href="https://www.instaforex.org/ru/?x=ruforum">InstaForex</a> -
TractorSenior Member
- Sep 2023
- 2357
- 55
- 386
- 690 USD
# Bollinger Bands Explained
Bollinger Bands ek popular technical analysis tool hai jo traders ko market volatility aur price levels ko samajhne mein madad karta hai. Is tool ko John Bollinger ne 1980s mein develop kiya tha. Bollinger Bands teen lines par mabni hoti hain: ek middle line jo moving average hoti hai, aur do outer lines jo standard deviation par base karti hain. In bands ka istemal karne se traders ko market ki dynamics ka achha andaza lagta hai.
Bollinger Bands ki middle line aksar 20-period simple moving average (SMA) hoti hai. Yeh line price ki average position dikhati hai, jo market ke trend ka pata deti hai. Jab price is middle line ke aas paas hota hai, toh market stable mana jata hai. Lekin jab price is line se door jata hai, toh yeh volatility ka signal hota hai.
Outer bands ko standard deviation se tay kiya jata hai. Pehli outer band upper side par hoti hai, jo 2 standard deviations upar hoti hai, aur doosri lower band, jo 2 standard deviations neeche hoti hai. Jab price upper band ko touch karta hai, toh yeh overbought condition ka indication hota hai, jahan price girne ka andaza hota hai. Is waqt traders ko selling opportunities par nazar rakhni chahiye.
Iske baraks, agar price lower band ko touch karta hai, toh yeh oversold condition ka signal hota hai, jo buying opportunities ko darshata hai. Is waqt traders ko sochna chahiye ke price wapas middle line ki taraf aa sakta hai.
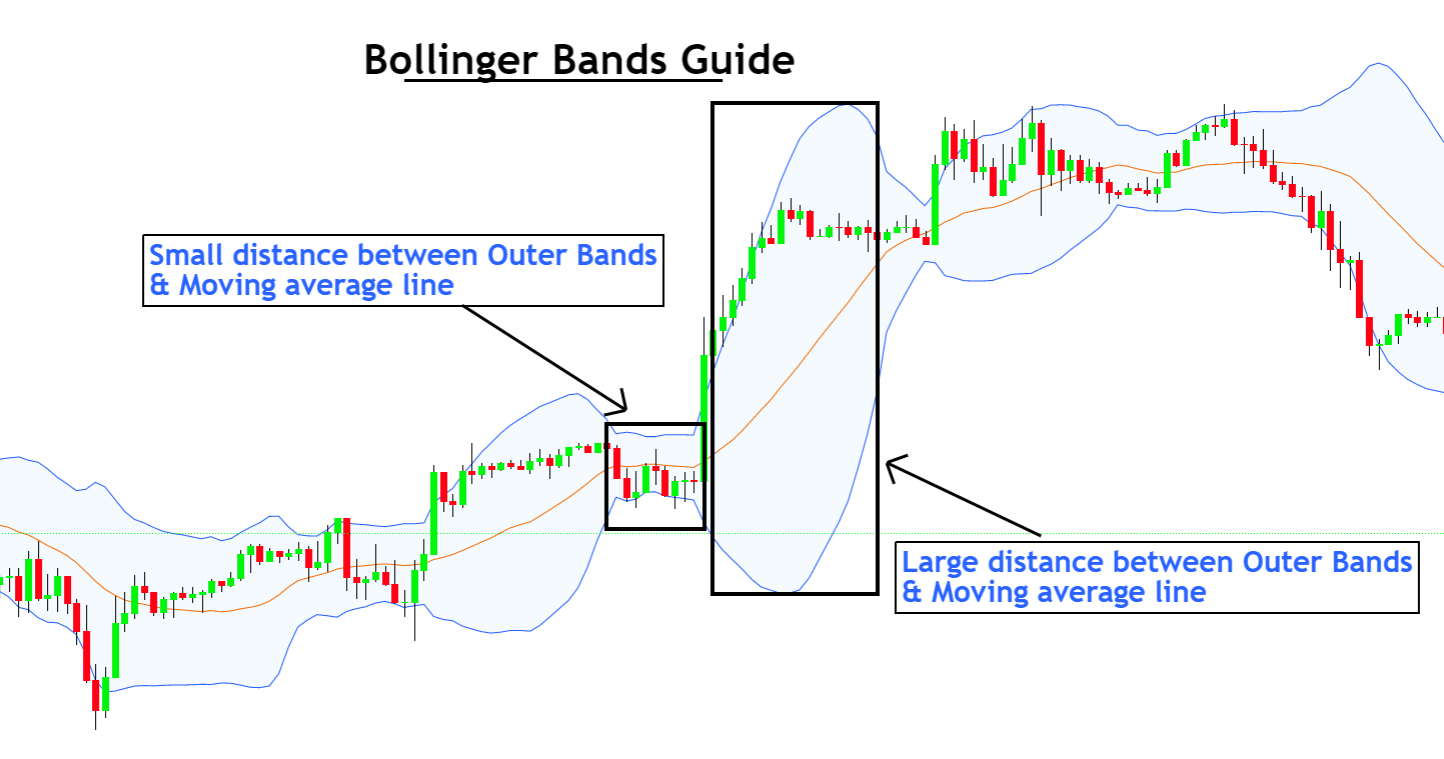
Bollinger Bands ka ek khas feature yeh hai ke yeh market ki volatility ko measure karte hain. Jab bands ki distance barh jati hai, toh yeh high volatility ko darshata hai, aur jab bands close hoti hain, toh yeh low volatility ka signal hota hai. Yeh information traders ko market ke potential breakout ya breakdown ke liye tayyar karne mein madad karti hai.
Is tool ka istemal karte waqt, kuch aur indicators jaise RSI (Relative Strength Index) ya MACD (Moving Average Convergence Divergence) ka istemal bhi faydemand hota hai. Yeh combination traders ko confirmation signals dene mein madad karta hai.
Lekin, yeh yaad rakhna zaroori hai ke Bollinger Bands kisi bhi trading strategy ka akele hissa nahi honi chahiye. Iska sahi istemal karne ke liye risk management aur market analysis ki zaroorat hoti hai.
Aakhir mein, Bollinger Bands ek powerful tool hai jo traders ko market volatility aur price action ko samajhne mein madad karta hai. Iska istemal aapko informed trading decisions lene mein madadgar sabit ho sakta hai.
اب آن لائن
Working...
تبصرہ
Расширенный режим Обычный режим