Inverse Head and Shoulders Candlestick Patterns Trading..
X
  • وقت
  • دکھائیں
Clear All
new posts
  • #1 Collapse

    Inverse Head and Shoulders Candlestick Patterns Trading..
    Inverse Head and Shoulders Candlestick Patterns Trading.

    Inverse Head and Shoulders hai ek candlestick pattern hai jo market analysis mein istemal hota hai. Inverse Head and Shoulders pattern ek powerful tool hai jo traders ko market trends aur reversals ko samajhne mein madad karta hai. Is pattern ko samajh kar, traders apne trading strategies ko improve kar sakte hain aur better entry aur exit points identify kar sakte hain. Magar, pattern ke istemal se pehle, thorough analysis aur risk management zaroori hai.


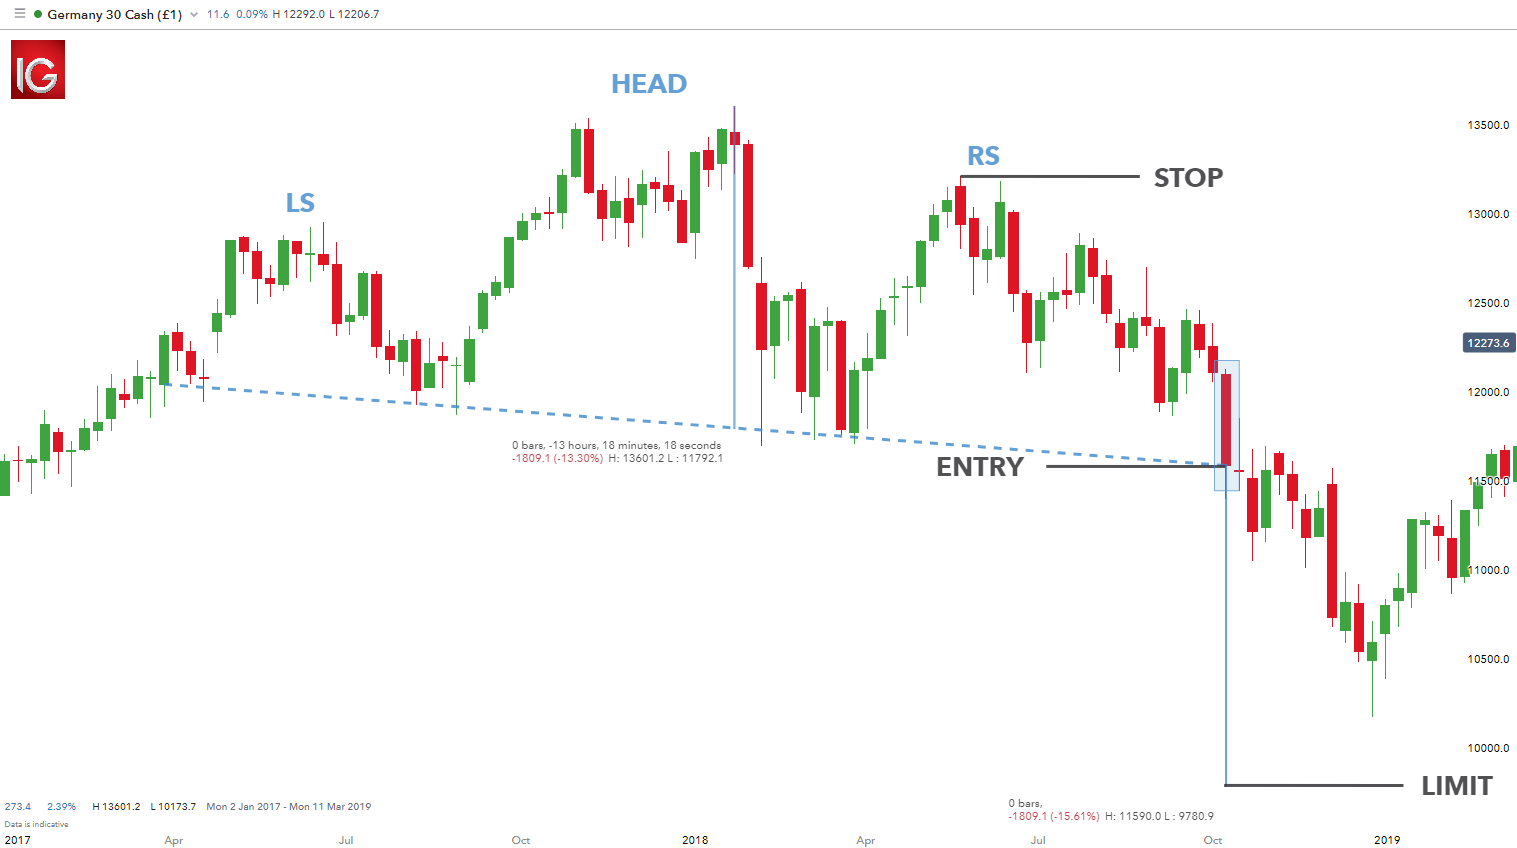
    Inverse Head and Shoulders, ek bullish reversal pattern hai jo normal head and shoulders pattern ka ulta hota hai. Ye typically bearish trend ke baad dekha jata hai aur indicate karta hai ke market ka trend change hone wala hai.

    Click image for larger version

Name:	images (10).png
Views:	43
Size:	7.4 کلوبائٹ
ID:	12941434

    Components of Inverse Head and Shoulders.

    Head.Yeh pattern ka sabse prominent part hota hai, jo typically market ke low points ko represent karta hai. Head usually shoulders ke darmiyan hota hai aur ye market ki weakest phase ko indicate karta hai.

    Shoulders. Inverse Head and Shoulders pattern mein do shoulders hote hain, jo head ke dono taraf hote hain. Ye market mein trend reversal ko suggest karte hain. Right shoulder usually left shoulder se kam bada hota hai, indicating ke bearish momentum kamzor ho raha hai.

    Neckline.Neckline, left shoulder aur right shoulder ke darmiyan ek line hoti hai jo support ya resistance ke tor par kaam karti hai. Agar price is line ko break kar ke upar jaata hai, to ye bullish signal hota hai.

    Trading Strategies using Inverse Head and Shoulders.

    Inverse Head and Shoulders pattern ko identify karna pehla qadam hai. Iske liye, traders ko market ke price action ko closely monitor karna hota hai aur potential Inverse Head and Shoulders pattern ki talaash karni hoti hai.

    Pattern ko confirm karne ke liye, traders ko price ke movements ko aur technical indicators ko dekhna hota hai. Agar price neckline ko break kar ke upar jaata hai aur volume bhi increase hota hai, to ye pattern confirm hota hai.


    Trade mein dakhil hone se pehle, traders ko apne risk aur reward ko calculate karna chahiye. Agar pattern confirm hota hai, traders long position le sakte hain, ideally neckline break ke upar.Stop loss set karna trading ka zaroori hissa hai. Agar price opposite direction mein chala gaya, to stop loss trader ki protection provide karta hai.aur aap ko btata chaloon kay Target set karna bhi important hai. Traders ko pata hona chahiye ke unka expected profit kitna hai aur jab price us level tak pahunchta hai, to wo trade close kar den.

    Maan lo ke ek stock ka price downtrend mein hai aur phir ek Inverse Head and Shoulders pattern form hota hai. Agar price neckline ko break kar ke upar jaata hai, to ye ek entry point ho sakta hai. Stop loss set kiya ja sakta hai neeche left shoulder ke niche aur target set kiya ja sakta hai pattern ke height ke hisaab se.

    Click image for larger version

Name:	images (11).png
Views:	38
Size:	28.3 کلوبائٹ
ID:	12941435

    Inverse Head and Shoulders Pattern ki Limitations.

    Kabhi kabhi Inverse Head and Shoulders pattern false signals bhi de sakta hai, isliye confirmatory indicators ka istemal zaroori hai.Pattern ko validate karne ke liye volume ki confirmation bhi zaroori hoti hai. Agar volume pattern ke sath nahi hai, to pattern ka asar kam ho sakta hai.Market conditions bhi pattern ke effectiveness ko influence karte hain. Strong trends mein, ye pattern kam effective ho sakta hai.
  • <a href="https://www.instaforex.org/ru/?x=ruforum">InstaForex</a>
  • #2 Collapse


    Click image for larger version

Name:	a.jpeg
Views:	44
Size:	12.5 کلوبائٹ
ID:	12941444

    Head and Shoulders pattern ek bearish trend reversal pattern hai jo chart analysis mein use hota hai. Ye typically uptrend ke baad dikhai deta hai aur bearish trend ki shuruat ki indication deta hai.
    Yeh pattern teen prominent peaks aur valleys se bana hota hai. In teeno peaks aur valleys mein se pehla aur teesra peak ya valley, jo shoulders hote hain, almost ek level par hote hain aur second peak ya valley, jo head hota hai, unse uncha ya neeche hota hai.
    Yeh pattern bearish trend ki starting ki indication deta hai, jab price ek resistance level par aake girne lagta hai. Iske baad, jab price head ke niche se nikalne lagta hai aur shoulder ke level tak jaata hai, ye pattern confirm hota hai.Is pattern ka name isiliye hai kyunki ye ek human ke head aur shoulders ki shape ko resemble karta hai. Mukamal points:


    Pehla Shoulder:

    Price uptrend mein hoti hai aur ek peak banati hai. Is peak ke baad, price kuch girne lagti hai lekin phir se recover kar leti hai, jo ek minor valley banati hai.

    Head:

    Is peak ke baad, price higher peak banati hai, jo previous peak se uncha ya neeche hota hai. Head usually shoulders ke beech hota hai aur ye head shoulders ke level se upar ya neeche ho sakta hai.

    Doosra Shoulder:

    Head ke baad, price phir se girne lagti hai aur ek doosra peak banati hai, jo pehle ke shoulder ke level par hota hai. Ye peak bhi shoulders ke jaise almost ek level par hota hai.

    Neckline:

    Neckline wo level hota hai jo pehle ke shoulders aur doosre ke shoulders ko connect karta hai. Ye typically ek straight line hoti hai jo horizontally draw ki jaati hai.

    Volume:

    Volume bhi dekha jaata hai, jisme head ke formation ke dauran typically volume increase hota hai.

    Breakdown:

    Jab price neckline ko break kar ke neeche jaata hai, ye bearish signal hai aur indicate karta hai ke bearish trend shuru ho sakta hai.

    Target:

    Head and Shoulders pattern ka target usually head ke height ka approximate distance hota hai, jise neckline se neeche measure kiya jaata hai. Ye pattern ek powerful bearish reversal signal hai, lekin iski accuracy ko confirm karne ke liye doosre technical indicators aur analysis ki zarurat hoti hai.


    • #3 Collapse

      1. Introduction: Forex trading mein candlestick patterns ka istemal market ke future movements ka andaza lagane mein madadgar hota hai. Candlestick patterns, jaise ki Inverse Head and Shoulders, traders ko market ke trend changes ka pata lagane mein madad karte hain. Inverse Head and Shoulders pattern, specifically bullish trend ke shuru hone ka advance indication deta hai. Yeh pattern market mein confidence aur clarity la sakta hai jo traders ke liye crucial hai.
      2. Inverse Head and Shoulders Kya Hai? Inverse Head and Shoulders pattern ek price action pattern hai jo typically bearish trend ke baad dekha jata hai aur bullish reversal ke indication ke roop mein aata hai. Is pattern mein ek central peak (head) aur do smaller peaks (shoulders) hote hain. Head peak shoulders se zyada bada hota hai aur price chart par center mein hota hai.

        Inverse Head and Shoulders pattern ek bullish trend ke shuru hone ke pehle kiya gaya potential reversal signal hai. Is pattern ko samajhna traders ke liye zaroori hai takay woh market movement ko samajh sake aur sahi waqt par positions le sake.
      3. Head Aur Shoulders: Inverse Head and Shoulders pattern mein, ek central peak (head) ke dono taraf do smaller peaks (shoulders) hota hain. Head peak shoulders se zyada bada hota hai aur typically price chart par center mein hota hai. Left shoulder, head, aur right shoulder ke peaks ko dekhte hue traders pattern ko identify karte hain.

        Left shoulder, head, aur right shoulder ke peaks ki size aur relative positions ko dekhkar traders trend reversal ke possibility ko assess karte hain. Yeh pattern ko recognize karna traders ke liye ek important skill hai jo unhe market ka sentiment samajhne mein madad karta hai.
      4. Inverse Head and Shoulders Formation: Inverse Head and Shoulders pattern ka formation bearish trend ke end par hota hai aur bullish trend ke shuru hone ka indication deta hai. Is pattern mein pehle ek downward trend hota hai jisme price ek low tak girta hai (left shoulder). Phir price ek upward movement shuru karta hai jo ek low tak jaata hai (head), phir dobara down aata hai lekin pehle se zyada girta nahi hai (right shoulder).

        Formation ke dauran, price ki movement ko closely monitor kiya jata hai takay trend reversal ka confirmation mil sake. Agar price neckline ko break karke upar jaata hai, toh yeh bullish reversal ke indication ke roop mein consider kiya jata hai.
      5. Neckline: Neckline Inverse Head and Shoulders pattern ke ek important component hai jo left shoulder, head, aur right shoulder ke peaks ko join karta hai. Yeh line horizontal ya sloping ho sakti hai aur traders ko entry aur exit points ke liye guide karta hai.

        Neckline breakout hone par traders ko bullish trend ka confirmation milta hai aur woh long positions lete hain. Iske saath hi, neckline ka slope aur direction bhi traders ke liye important hai kyunki yeh trend ke direction ko indicate karta hai.
      6. Entry Point: Inverse Head and Shoulders pattern mein entry point ko determine karne ke liye traders neckline ko break karne ka wait karte hain. Jab price neckline ko breakout karta hai aur usse upar jaata hai, tab traders long positions lete hain.

        Entry point ko determine karte waqt, traders ko volume aur other indicators ka bhi dhyan rakhna chahiye. High volume breakout, bullish trend ke confirmation ke liye ek positive sign ho sakta hai.
      7. Stop Loss: Stop loss ko set karte waqt, traders usually neckline ke neeche ek small margin rakhte hain taki agar price reversal ho toh loss minimize ho sake. Stop loss ka main purpose hai trader ko excessive loss se bachana.

        Stop loss ko set karte waqt traders apni risk tolerance aur trading strategy ko dhyan mein rakhte hain. Agar price reversal hota hai aur stop loss trigger hota hai, toh trader apni position ko exit kar leta hai.
      8. Target Price: Inverse Head and Shoulders pattern ke target price ko calculate karne ke liye, traders neckline ka height measure karte hain aur usse upside par extend karte hain. Target price bullish trend ke continuation ke liye potential price level ko indicate karta hai.

        Target price ko determine karte waqt, traders market conditions aur price action ko bhi consider karte hain. Target price ke saath saath, traders ko profit booking aur trailing stop loss ka bhi plan banana chahiye.
      9. Example: Ek example ke roop mein, maan lijiye market ek downtrend mein hai aur ek Inverse Head and Shoulders pattern form ho raha hai. Agar price neckline ko break karke upar jaata hai, toh traders long positions le sakte hain. Stop loss aur target price ko bhi set kiya ja sakta hai.

        Example ke through, traders ko pattern ko identify karne aur uska istemal karne ka practical insight milta hai. Real-time examples se traders apni analysis aur decision-making skills ko improve kar sakte hain.
      10. Confirmation: Inverse Head and Shoulders pattern ki sahi confirmation ke liye, traders volume ki bhi ek close monitoring karte hain. Agar breakout volume ke saath ho, toh yeh pattern ki confirmation ko strong banata hai.

        Volume ki analysis ke through, traders ko pattern ke strength aur validity ke bare mein aur bhi zyada clarity milti hai. Volume ke saath sahi confirmation hone par traders apne positions ko confidently manage kar sakte hain.
      11. False Breakouts: Kabhi kabhi price neckline ko briefly break karke phir se neeche gir sakta hai, jo false breakout kehlata hai. False breakouts se bachne ke liye, traders ko patience aur market ko closely monitor karna zaroori hai.

        False breakouts ko identify karne aur unse bachne ke liye traders ko price action aur market dynamics ko samajhna zaroori hai. False breakout ke waqt, traders ko apne stop loss aur risk management strategy ko reevaluate karna chahiye.
      12. Risk Management: Har trading strategy mein risk management ka ahem role hota hai. Inverse Head and Shoulders pattern mein bhi risk management ko dhyan mein rakhte hue stop loss aur position sizing ka istemal kiya jana chahiye.

        Risk management strategy ko develop karte waqt, traders apni risk tolerance aur trading objectives ko dhyan mein rakhte hain. Sahi risk management ke saath, traders apne trading career ko sustain aur grow kar sakte hain.
      13. Practice: Inverse Head and Shoulders pattern ko samajhne aur trading mein istemal karne ke liye practice zaroori hai. Demo accounts ka istemal karke traders apni skills ko improve kar sakte hain.

        Practice ke through, traders apni analysis aur decision-making skills ko refine kar sakte hain. Regular practice se traders apne confidence level ko bhi boost kar sakte hain aur market ke challenging situations ka saamna karne mein taiyar ho sakte hain.
      14. Conclusion: Inverse Head and Shoulders pattern ek powerful bullish reversal pattern hai jo traders ko market ke trend changes ka advance indication deta hai. Is pattern ko samajhne aur istemal karne se pehle thorough research aur practice zaroori hai.

        Conclusion mein, traders ko samajhna chahiye ke Inverse Head and Shoulders pattern ke saath sahi risk management aur trading discipline kitna zaroori hai. Yeh pattern sirf ek tool hai jo traders ke toolkit ka ek hissa hai aur iska sahi istemal karne se traders apne trading performance ko improve kar sakte hain.


      • #4 Collapse

        Inverse Head and Shoulders Candlestick Patterns Trading.

        Click image for larger version

Name:	download (6).png
Views:	39
Size:	4.1 کلوبائٹ
ID:	12941470
        "Inverse Head and Shoulders" candlestick patterns, jaise ke naam se zahir hai, ek technical analysis tool hai jo traders ko market trends aur potential price reversals identify karne mein madad karta hai. Yeh pattern typically bullish reversal ke indications provide karta hai aur traders ko price ka future direction predict karne mein help karta hai.

        Yeh pattern ek specific sequence of candlesticks ko represent karta hai, jo typically ek downtrend ke baad dikhta hai. Is pattern mein teen main components hote hain: ek "head" aur do "shoulders". "Head" pattern market ke lowest point ko represent karta hai aur isse do "shoulders" flank karte hain, jo slightly higher lows hote hain. Jab yeh pattern complete hota hai, ek "neckline" draw kiya jata hai, jo shoulders ke tops ko connect karta hai.

        Inverse Head and Shoulders pattern ka trade karne ka basic concept hai jab price neckline ko break kar ke upar jaata hai, to yeh bullish signal provide karta hai aur traders ko long positions lena suggest karta hai. Traders typically entry point ko neckline ke breakout ke baad rakhte hain, jab price uptrend mein jaane ka indication deta hai. Stop-loss orders usually set kiye jate hain neeche shoulder ke niche, jisse risk manage kiya ja sake.

        Yeh pattern kaafi versatile hai aur alag-alag timeframes aur markets mein bhi kaam karta hai. Iska istemal karne se pehle, traders ko confirmatory signals ka bhi dhyaan dena chahiye jaise volume increase ya phir aur technical indicators ka use karke.

        Overall, Inverse Head and Shoulders candlestick pattern ek powerful tool hai jo traders ko potential price reversals identify karne mein madad karta hai, lekin saath hi sahi risk management ke saath istemal karna bhi important hai.
        • #5 Collapse

          Forex Trading Mein Candlestick Patterns Ki Ahmiyat:

          Forex trading mein candlestick patterns ki ahmiyat ka andaza lagane ke liye traders ko market ka movement samajhna zaroori hai. Candlestick patterns, price action ko analyze karne ka ek powerful tool hote hain. Ye patterns market mein sentiment aur direction ke baray mein maloomat faraham karte hain, jo traders ko trading decisions lene mein madad karte hain.

          Candlestick patterns ka istemal karte waqt, traders ko market ki trend, reversal points aur potential entry/exit levels ka pata lagana asan ho jata hai. In patterns ki madad se traders market ke future direction ka idea bana sakte hain aur iske mutabiq apni strategies ko adjust kar sakte hain.

          Head and Shoulders Pattern Ki Tafseel:

          Head and shoulders pattern ek classic reversal pattern hai jo traders ke liye khaas tor par important hota hai. Is pattern mein price ka movement ek specific structure follow karta hai jo bearish trend ki indication deta hai. Is pattern mein typically teen peaks hote hain: ek head aur do shoulders.

          Left shoulder, head aur right shoulder ke points ko connect karne se ek visual representation ban jati hai jo ek human ke head aur shoulders ki shape se milti hai, isliye isko 'head and shoulders' pattern kaha jata hai. Jab market is pattern ko follow karta hai, to yeh bearish trend ki khatam hone ki possibility darust karti hai.

          Inverse Head and Shoulders Pattern Kya Hai?:

          Inverse head and shoulders pattern, head and shoulders pattern ka ulta hota hai. Yani ke ismein bullish reversal ki indication hoti hai. Is pattern mein bhi teen peaks hote hain, lekin yahan par trend bearish se bullish ki taraf change hoti hai. Is pattern ko identify karne ke liye traders ko price action aur volume ka tawajjo dena hota hai.

          Inverse head and shoulders pattern mein pehla low point left shoulder hota hai, doosra low point head hota hai aur teesra low point right shoulder hota hai. In points ke darmiyan price ka upward movement hota hai jo bullish reversal ki indication deta hai.

          Inverse Head and Shoulders Ki Pehchan:

          Inverse head and shoulders pattern ko identify karne ke liye traders ko market mein specific low points par tawajjo deni hoti hai. Left shoulder, head aur right shoulder ke points ko connect karke ek visual representation banai ja sakti hai. Is pattern ki pehchan karne ke liye traders ko trend ke against ki taraf movement par focus karna hota hai.

          Structure of Inverse Head and Shoulders Pattern:

          Inverse head and shoulders pattern ka structure market ke bullish reversal ko darust karti hai. Is pattern mein typically teen peaks hote hain: left shoulder, head aur right shoulder. In points ke darmiyan price ka upward movement hota hai jo bullish trend ki indication hoti hai.

          Left shoulder se right shoulder tak ke darmiyan price ka movement ascending hota hai jo bullish sentiment ko reflect karta hai. Head typically left shoulder aur right shoulder se ziada prominent hota hai aur iska height bhi ziada hota hai. Yeh head ka characteristic hota hai jo bullish reversal ki possibility ko darust karta hai.

          Inverse Head and Shoulders Pattern Ka Matlab:

          Inverse head and shoulders pattern ka matlab hota hai ke market ka trend bearish se bullish ki taraf change hone wala hai. Jab yeh pattern complete hota hai, to traders ko bullish reversal ki expectation hoti hai aur woh long positions enter karte hain.

          Yeh pattern market ke sentiment ka positive change indicate karta hai. Traders is pattern ko dekh kar market mein confidence ke saath trades kar sakte hain aur bearish trend se nikal kar bullish trend mein shamil ho sakte hain.

          Trading Strategy with Inverse Head and Shoulders Pattern:

          Inverse head and shoulders pattern ke sath trading karne ki strategy ko samajhna traders ke liye zaroori hai. Jab yeh pattern complete hota hai, to traders long positions enter karte hain. Entry point typically right shoulder ke breakout ke baad hota hai.

          Traders ko pattern ki confirmation ke liye wait karna chahiye aur jab price right shoulder ke breakout ke baad upar jaata hai, tab hi long positions enter karna chahiye. Stop loss ko usually right shoulder ke niche aur take profit ko pattern ke height par rakha jata hai.

          Stop Loss and Take Profit Placement:

          Stop loss aur take profit placement inverse head and shoulders pattern ke sath trading karte waqt ahem hota hai. Stop loss ko right shoulder ke niche aur take profit ko pattern ke height par rakha jata hai. Yeh positions ko manage karne ka ek tarika hota hai taake nuqsaan se bacha ja sake.

          Traders ko apni risk tolerance ke mutabiq stop loss aur take profit levels set karna chahiye. Stop loss ko tight rakha jana chahiye taake nuqsaan minimum ho aur take profit ko pattern ke target ke mutabiq adjust kiya ja sakta hai.

          Risk Management with Inverse Head and Shoulders Pattern:

          Inverse head and shoulders pattern ke sath trading karte waqt risk management ka khayal rakhna zaroori hai. Traders ko apni position sizes ko control karna chahiye taake excessive loss se bacha ja sake. Risk reward ratio ka bhi tawajjo dena chahiye taake profitable trades ka faida maximum ho.

          Traders ko apni risk tolerance ke mutabiq stop loss aur take profit levels set karna chahiye. High leverage ka istemal karne se bacha jana chahiye taake overexposure se bacha ja sake aur trading capital ko protect kiya ja sake.

          Inverse Head and Shoulders Pattern Ki Mukhtalif Variations:

          Inverse head and shoulders pattern ki mukhtalif variations bhi hoti hain jaise double bottom pattern. Double bottom pattern mein bhi bullish reversal ki indication hoti hai jahan do low points ek saath hote hain.

          Traders ko in variations ko bhi samajh kar market mein opportunities dhoondhne chahiye. Har pattern ki apni characteristics hoti hain jo traders ko market ka mood samajhne mein madad karte hain.

          Inverse Head and Shoulders Pattern Ki Confirmation:

          Inverse head and shoulders pattern ki confirmation ke liye traders ko volume aur price action ka tawajjo dena hota hai. High volume aur strong bullish candlesticks pattern ki confirmation hoti hai. Jab pattern complete hota hai aur price right shoulder ke breakout ke baad upar jaata hai, tab confirmation milti hai.

          Traders ko pattern ke confirmation ke liye wait karna chahiye aur jab sahi waqt aaye, tabhi positions enter karna chahiye. Jaldi entry karne se bachna chahiye taake false signals se bacha ja sake.

          Inverse Head and Shoulders Pattern Aur Dusre Indicators:

          Inverse head and shoulders pattern ke sath traders doosre technical indicators jaise ki moving averages aur RSI ka bhi istemal karte hain. Moving averages bullish crossover aur RSI ke oversold conditions bhi pattern ki strength ko confirm karte hain.

          Traders ko multiple indicators ka istemal karke pattern ki confirmation ko verify karna chahiye. Ek indicator ki confirmation par zyada rely na karein aur multiple factors ka consideration karein.

          Conclusion:

          Inverse head and shoulders pattern forex trading mein ek important tool hai jo traders ko bullish reversal ki indications deta hai. Lekin, is pattern ko istemal karte waqt traders ko proper risk management aur confirmation ki zaroorat hoti hai. Pattern ki sahi understanding aur iske sath doosre technical indicators ka istemal karke traders market mein successful trades kar sakte hain.
          • #6 Collapse

            An Introduction to Inverse Head and Shoulders Candlestick Patterns Trading

            Candlestick patterns are visual representations of price movements in financial markets. They provide traders with valuable insights into market sentiment, helping them make informed decisions. Among the myriad of candlestick patterns, the inverse head and shoulders pattern stands out for its significance in identifying potential trend eversals.
            The inverse head and shoulders pattern is characterized by three distinct peaks and troughs, resembling the silhouette of a head and shoulders. Unlike its counterpart, the regular head and shoulders pattern, which indicates a potential reversal from bullish to bearish, the inverse head and shoulders pattern signals a reversal from bearish to bullish.
            Traders often look for inverse head and shoulders patterns at the bottom of a downtrend, as they suggest that selling pressure may be diminishing and buyers could be gaining control. Understanding the anatomy of this pattern is crucial for traders looking to capitalize on potential trend reversals and maximize their profits.

            Understanding the Inverse Head and Shoulders Pattern

            To fully grasp the inverse head and shoulders pattern, traders must familiarize themselves with its key components:
            1. Left Shoulder: The first trough in the pattern, representing the initial downward movement in price.
            2. Head: The central trough, indicating the lowest point reached during the downtrend. This is typically lower than both the left and right shoulders.
            3. Right Shoulder: The final trough in the pattern, slightly higher than the head. Its formation suggests a potential reversal in the downtrend.
            The distinct shape formed by these three troughs resembles the inverse of a head and shoulders, hence the name of the pattern.

            Key Components of the Inverse Head and Shoulders Pattern

            The inverse head and shoulders pattern is characterized by several key components, each playing a vital role in its interpretation:
            1. Volume: During the formation of the pattern, traders pay close attention to trading volume. Typically, volume tends to decline as the pattern develops, signaling a decrease in selling pressure. A notable increase in volume upon breakout above the neckline confirms the validity of the pattern and strengthens the bullish signal.
            2. Neckline: The neckline is a horizontal line connecting the highs of the two shoulders. It serves as a crucial level of resistance that, once breached, confirms the reversal. Traders often wait for a decisive breakout above the neckline before entering long positions.
            3. Confirmation: While the formation of an inverse head and shoulders pattern is a bullish signal in itself, traders often seek confirmation from other technical indicators or patterns. This may include bullish divergence on oscillators, such as the Relative Strength Index (RSI), or a breakout above key resistance levels.

            Identifying the Inverse Head and Shoulders Pattern

            Identifying an inverse head and shoulders pattern requires a keen eye for detail and an understanding of its defining characteristics. Traders typically look for the following criteria:
            1. Distinct Troughs: The pattern should consist of three distinct troughs, with the head being the lowest point.
            2. Declining Volume: As the pattern develops, trading volume should decline, indicating a weakening of selling pressure.
            3. Symmetrical Shoulders: The left and right shoulders should be approximately symmetrical in height and width, with the right shoulder forming slightly higher than the head.
            4. Breakout Confirmation: A decisive breakout above the neckline, accompanied by increased volume, confirms the validity of the pattern and signals a bullish reversal.
            By carefully analyzing price movements and candlestick formations, traders can identify potential inverse head and shoulders patterns and position themselves to take advantage of impending trend reversals.

            Significance of the Neckline

            The neckline plays a crucial role in the inverse head and shoulders pattern, serving as a key level of resistance that must be overcome for the reversal to be confirmed. Traders often monitor the neckline closely, waiting for a breakout above this level before entering long positions.
            The significance of the neckline extends beyond its role as a resistance level. Once breached, the neckline transforms into a support level, providing traders with a reference point for setting stop-loss orders and assessing the strength of the bullish trend.

            Trading Strategies for Inverse Head and Shoulders Patterns

            Trading inverse head and shoulders patterns requires a combination of patience, discipline, and technical analysis. While the pattern itself provides a valuable signal of potential trend reversal, traders must employ appropriate strategies to capitalize on these opportunities effectively.
            1. Entry Point: The most common entry point for traders is upon breakout above the neckline. This breakout confirms the reversal and signals the beginning of a new bullish trend. However, some traders may opt to wait for a pullback to the neckline before entering to improve their risk-reward ratio.
            2. Stop Loss Placement: Placing a stop-loss order is essential to manage risk and protect against potential losses. Traders typically place their stop-loss orders slightly below the right shoulder or the neckline, as a break below these levels could indicate a false breakout and invalidate the pattern.
            3. Profit Targets: Determining profit targets is a critical aspect of trading inverse head and shoulders patterns. One common approach is to project the height of the pattern from the neckline to the head and add it to the breakout point. This provides traders with an initial target for their trades, although many may choose to trail their stop loss or employ other techniques to maximize profits as the trend progresses.
            4. Confirmation: While the formation of an inverse head and shoulders pattern is a bullish signal, traders often seek confirmation from other technical indicators or patterns before entering a trade. This may include bullish divergence on oscillators, such as the Relative Strength Index (RSI), or a breakout above key resistance levels.

            Factors to Consider

            While inverse head and shoulders patterns can be powerful indicators of potential trend reversals, traders should consider several factors before placing trades based solely on this pattern:
            1. Market Context: It is essential to consider the broader market context before trading inverse head and shoulders patterns. Factors such as overall market trends, economic indicators, and geopolitical events can influence the effectiveness of the pattern and increase the likelihood of success.
            2. Volume Confirmation: While declining volume during the formation of the pattern is typical, traders should seek confirmation from increased volume upon breakout above the neckline. Volume confirmation lends credibility to the reversal and increases the probability of a successful trade.
            3. Confirmation from Other Indicators: In addition to volume confirmation, traders often look for confirmation from other technical indicators or patterns. This may include bullish divergence on oscillators, such as the Relative Strength Index (RSI), or a breakout above key resistance levels.
            4. Risk Management: Managing risk is paramount in trading, regardless of the strategy employed. Traders should use stop-loss orders to limit potential losses and adhere to proper position sizing to ensure that no single trade jeopardizes their overall trading capital.
            By considering these factors alongside the inverse head and shoulders pattern, traders can increase their probability of success and minimize the risk of losses.

            Conclusion

            Inverse head and shoulders candlestick patterns trading offers traders a valuable tool for identifying potential trend reversals and capitalizing on bullish market conditions. By understanding the characteristics, significance, and trading strategies associated with this pattern, investors can improve their ability to spot lucrative trading opportunities and make informed decisions.
            However, like any trading strategy, it is essential to exercise caution and combine pattern recognition with thorough analysis and risk management. By doing so, traders can navigate the markets with confidence and achieve consistent success over the long term.
            • #7 Collapse

              Topic: Inverse Head and Shoulders Candlestick Patterns Trading

              Click image for larger version

Name:	head-and-shoulders-pattern_body_FXTRADE.png.full.png
Views:	36
Size:	23.5 کلوبائٹ
ID:	12941482

              Introduction:
              Inverse Head and Shoulders (IHS) ek popular bullish reversal pattern hai jo ke technical analysis mein istemal hota hai. Yeh pattern market trends ko identify karne aur trading signals generate karne ke liye istemal hota hai. Is article mein, hum Inverse Head and Shoulders Candlestick Patterns Trading ke baare mein aur uske key features, interpretation, aur trading strategy ke baare mein baat karenge.

              1. Key Features:

              a. Three Lows: Inverse Head and Shoulders pattern teen alag alag bottoms ya lows se banta hai. Middle low ko "head" aur do side lows ko "shoulders" kaha jata hai.

              b. Neckline: Neckline ek imaginary line hoti hai jo ke shoulders ke peaks ko connect karti hai. Jab price neckline ko break karta hai, toh yeh ek bullish reversal signal deta hai.

              2. Interpretation:

              Inverse Head and Shoulders pattern ka interpretation bullish reversal ke liye hota hai. Yeh pattern downtrend ke baad dekha jata hai aur indicate karta hai ke market mein trend reversal hone wala hai.

              3. Trading Strategy:

              Inverse Head and Shoulders pattern ka istemal trading strategy ke taur par kiya ja sakta hai:

              a. Confirmation: Traders usually ek confirmation candle ka wait karte hain jab price neckline ko break karta hai. Agar volume bhi increase hota hai jab price neckline ko break karta hai, toh yeh pattern ki validity ko confirm karta hai.

              b. Entry Point: Entry point usually neckline ke break ke baad kiya jata hai. Traders apni positions lena shuru karte hain jab price neckline ko break karta hai aur uptrend start hota hai.

              c. Stop-Loss aur Target Levels: Traders apne positions ke liye stop-loss aur target levels ko set karte hain taake unki risk ko minimize kiya ja sake aur profits maximize kiya ja sake.

              Inverse Head and Shoulders pattern ek powerful bullish reversal pattern hai jo ke traders ko potential trend reversal ke baare mein alert karta hai. Lekin, traders ko sahi risk management aur confirmation ke saath trading karna zaroori hai taake woh apne positions ko effectively manage kar sakein.
              • #8 Collapse

                Forex Mein Inverse Head and Shoulders Candlestick Patterns{}{}{}{}{}

                Forex mein Inverse Head and Shoulders Candlestick pattern ek famous technical analysis pattern hai, jo market trend reversal ko dikhata hai. Ye pattern aam tor par downtrend ke baad aata hai aur bullish reversal signal provide karta hai.


                Forex Mein Inverse Head and Shoulders Candlestick Patterns Ki Detail{}{}{}{}{}

                Is pattern mein teen mukhya ahem hisse hote hain:
                1. Sar: Ye pattern ka markazi hissa hota hai. Ye ek price low ko darust karta hai jo market ke downtrend ke doran banta hai. Sar aksar shoulders ke niche hota hai.
                2. Kandhay: Sar ke dono sides mein hote hain. Ye price lows hote hain, jo sar ke price level se kam hote hain. Inka level aapas mein mushaba hota hai aur ye sar ke price level se oopar hote hain.
                3. Sar ke Khandaq: Ye bhi sar ke dono sides mein hota hai. Ye bhi price lows hote hain, jo sar ke price level se kam hote hain. Inka level aapas mein mushaba hota hai aur ye sar ke price level se oopar hote hain.

                  Jab ye teeno elements ek saath aate hain, pattern poora hota hai aur ye indicate karta hai ke market ka trend change hone wala hai - downtrend se uptrend ki taraf. Traders is pattern ko dekhte hue market mein long positions lete hain ya existing short positions ko cover karte hain. Lekin hamesha dhyan rahe ke kisi bhi pattern ki confirmation ke liye price action ka wait karna zaroori hai.
                Overall, Inverse Head and Shoulders pattern ek powerful tool hai jo traders ko market ka direction samajhne mein aur profitable trading decisions lene mein madad karta hai. Lekin hamesha yaad rahe ki kisi bhi pattern ya indicator ka istemal karne se pehle, thorough analysis aur risk management zaroori hai.
                • #9 Collapse

                  Inverse Head and Shoulders Candlestick Patterns Trading

                  Inverse Head and Shoulders candlestick pattern ek ahem technical analysis tool hai jo forex trading mein istemal hota hai. Ye pattern commonly reversal pattern ke tor par jaana jaata hai aur traders ko potential trend changes ki pehchaan karne mein madad karta hai.

                  Pattern Ki Tashkeel: Inverse Head and Shoulders pattern ek specific chart pattern hai jo ek bearish trend ko reverse karne ki indication deta hai. Is pattern mein teen important components hote hain: ek left shoulder, ek head, aur ek right shoulder. Ye components price action ke highs aur lows se shape hote hain.
                  Click image for larger version

Name:	download (1).png
Views:	27
Size:	5.3 کلوبائٹ
ID:	12941531Click image for larger version

Name:	images (1).png
Views:	154
Size:	6.4 کلوبائٹ
ID:	12941530
                  Tashkeel Ke Tafasilat:
                  1. Left Shoulder: Left shoulder ek bearish move ke baad form hota hai aur typically ek downtrend ke doran develop hota hai. Isme price action down trend mein move karta hai, lekin jab price bottom out karta hai, yeh left shoulder form hota hai.
                  2. Head: Head left shoulder ke neeche form hota hai aur typically left shoulder se zyada bottom out hota hai. Yeh bearish move ke baad form hota hai aur iske baad se price action up trend ki taraf move karta hai.
                  3. Right Shoulder: Right shoulder head ke upar form hota hai aur typically left shoulder ke level tak retrace karta hai. Yeh bhi bearish move ke baad form hota hai.
                  Click image for larger version

Name:	images.png
Views:	28
Size:	10.7 کلوبائٹ
ID:	12941534Click image for larger version

Name:	download.png
Views:	27
Size:	8.9 کلوبائٹ
ID:	12941533Click image for larger version

Name:	download (2).png
Views:	30
Size:	7.5 کلوبائٹ
ID:	12941532
                  Trading Strategy: Inverse Head and Shoulders pattern ko identify karne ke baad, traders typically entry point ke liye wait karte hain jab price right shoulder ko break karta hai aur uptrend ki shuruaat hoti hai. Stop loss ko typically left shoulder ke neeche rakha jaata hai aur target price ko head ke height se measure kiya jaata hai.

                  Conclusion: Inverse Head and Shoulders candlestick pattern ek powerful reversal pattern hai jo traders ko bearish trend ke reversals ki pehchaan karne mein madad karta hai. Is pattern ko identify karna aur sahi tareeke se trade karna, traders ko potential profits ki opportunities faraham karta hai aur unhe market ke trend changes ko samajhne mein madad deta hai.
                  • #10 Collapse

                    Forex trading mein candlestick patterns ka istemal bohot ahem hota hai taakeh traders market ka trend aur future price movements ka andaza laga sakein. Inverse Head and Shoulders ek aham candlestick pattern hai jo bullish reversal ko indicate karta hai. Is article mein hum Inverse Head and Shoulders pattern ke bare mein mazeed tafseel se baat karenge.

                    1. Introduction to Candlestick Patterns

                    Forex trading mein price action ko samajhne ka ek important tareeqa hain. Ye patterns price charts par candlesticks ki shape aur formation ko analyze karne se nikalte hain. Candlestick patterns traders ko market sentiment aur price direction ke baray mein maloomat dete hain.

                    Candlesticks ek visual representation provide karte hain price movements ka jo traders ko market ki psychology samajhne mein madad karte hain. Har candlestick ka structure open, high, low, aur close price ko represent karta hai jo ek specific time period par hota hai.

                    2. Understanding Inverse Head and Shoulders

                    Inverse Head and Shoulders ek specific chart pattern hai jo price trend ka reversal signal karta hai. Ye pattern typically downtrend ke baad banata hai aur bullish trend ke start hone ka indication deta hai.

                    Is pattern mein teen main components hote hain: aik head aur do shoulders. Head center mein hota hai aur do shoulders us se pehle aur baad hotay hain. Left shoulder aur right shoulder, head ke dono sides par hotay hain.

                    3. Components of Inverse Head and Shoulders

                    a. Head: Head candlestick price chart par ek low point hota hai jo shoulders se neechay hota hai. Ye typically lowest point hota hai pattern mein.

                    b. Shoulders: Shoulders head ke sides par hote hain. Left shoulder usually downtrend ke starting point ke baad banega aur right shoulder head ke baad banega.

                    c. Neckline: Neckline pattern ka ek critical part hai jo support ya resistance level ke roop mein kaam karta hai. Ye head aur shoulders ke tops ko join karta hai.

                    4. Recognition of Inverse Head and Shoulders

                    Inverse Head and Shoulders pattern ko recognize karna zaroori hai taakeh traders price trend ka reversal anticipate kar sakein. Is pattern ko identify karne ke liye price chart par specific characteristics dekhe jate hain.

                    Typically, pehle ek downtrend hota hai jisme price ek low point tak jaati hai. Phir price do higher lows banati hai jo shoulders ko form karte hain. Head banane ke baad, price ek higher high banati hai jo pattern ka completion hota hai.

                    5. Significance of Volume

                    Inverse Head and Shoulders pattern ko confirm karne mein volume ka role bohot ahem hota hai. Generally, left shoulder aur head ke beech volume kam hota hai jabke right shoulder ban raha hota hai toh volume increase hone lagta hai.

                    Volume ki increase neckline breakout ke waqt bhi ek bullish signal deta hai aur price trend ka strong reversal indicate karta hai.

                    6. Neckline Breakout

                    Inverse Head and Shoulders pattern ka sab se ahem hissa neckline ka breakout hota hai. Agar price neckline ko breakout karta hai toh ye bullish reversal ka signal deta hai.

                    Traders neckline breakout ke baad entry points confirm karte hain taakeh unko favorable market conditions mein trade karne ka opportunity mil sake.

                    7. Entry Points and Stop Loss

                    Inverse Head and Shoulders pattern ko samajhne ke baad entry point aur stop loss levels ka tay karna zaroori hai. Entry usually neckline breakout ke baad kiya jata hai jab price trend confirm ho jata hai.

                    Stop loss typically neckline ke neeche rakha jata hai taakeh agar pattern fail hota hai toh losses minimize kiya ja sake.

                    8. Target Calculation

                    Inverse Head and Shoulders ka target calculation neckline se head ka height project karke kiya ja sakta hai. Ye target price reversal ke liye important hota hai taakeh traders ko profit booking ka idea mil sake.

                    Target price usually pattern formation ke duration aur market conditions ke mutabiq decide kiya jata hai.

                    9. Real-Life Examples

                    Is pattern ko samajhne ke liye real-life examples dekhna bhi faida mand hai. Historical charts par Inverse Head and Shoulders ki examples study karne se traders ko iska concept samajhne mein madad milti hai.

                    Traders ko real-life examples analyze karke pattern ki characteristics aur behavior ko samajhna chahiye taakeh unko pattern recognition mein expertise ho.

                    10. Importance of Confirmation

                    Har trading strategy mein confirmation ka bohot ahem role hota hai. Isi tarah, Inverse Head and Shoulders pattern ko confirm karna bhi zaroori hai doosri technical indicators se jaise ki RSI, MACD, ya price action.

                    Traders ko sirf pattern recognition par bharosa nahi karna chahiye balki confirmatory signals ka wait karna chahiye taakeh unki trades ka success rate increase ho.

                    11. Pitfalls and Challenges

                    Kabhi kabhi false signals bhi aate hain jo traders ko trap kar sakte hain. Isliye pattern ko confirm karne ke baad hi trade karna chahiye taakeh false breakouts se bacha ja sake.

                    Challenges include pattern ki accuracy aur market volatility ka impact jo traders ko cautious rehne par majboor karte hain.

                    12. Risk Management

                    Har trading strategy mein risk management bohot ahem hota hai. Inverse Head and Shoulders pattern trading mein bhi stop loss aur position size ke zaroorat hai taakeh losses control mein rahein.

                    Traders ko apne risk tolerance ke mutabiq apni positions ka size tay karna chahiye aur stop loss levels ko strictly follow karna chahiye.

                    13. Conclusion

                    Inverse Head and Shoulders pattern ek powerful bullish reversal pattern hai jo traders ko market trends ko samajhne aur future movements ka idea dene mein madad karta hai.

                    Traders ko is pattern ko master karne ke liye regular practice aur analysis ki zaroorat hai taakeh unki trading skills improve ho sakein.

                    14. Practice and Experience

                    Pattern ko samajhne ke liye practice aur experience ka hona zaroori hai. Traders ko regular practice aur historical data analysis se is pattern ko master karne ki koshish karni chahiye.

                    Successful trading requires consistent efforts, discipline, aur patience jo traders ko consistent profitability ki taraf le jaata hai. Inverse Head and Shoulders pattern ka mastery traders ko ek powerful tool provide karta hai market ka direction predict karne ke liye.

                    • #11 Collapse


                      Inverse head and shoulders candlestick patterns trading..

                      Introduction

                      Forex trading mein candlestick patterns ka istemal price movements aur trend reversals ko identify karne ke liye kiya jata hai. Inverse Head and Shoulders (IHS) ek bullish reversal pattern hai jo downtrend ke baad trend reversal indicate karta hai. Is article mein hum IHS candlestick pattern ko samjhein ge aur iska istemal forex trading mein kaise kiya jata hai.

                      Click image for larger version

Name:	A13.png
Views:	25
Size:	6.3 کلوبائٹ
ID:	12942960

                      1. Inverse Head and Shoulders: Kya Hai?


                      Inverse Head and Shoulders ek technical analysis pattern hai jo price chart par shoulders aur ek head se mil kar bana hota hai. Yeh pattern typically ek downtrend ke baad dekha jata hai aur bullish reversal ka indication deta hai.
                      • Shoulder: Price chart par do shoulders hote hain jo ek downtrend ke baad form hote hain. Ye shoulders price chart par left aur right side par shoulders ke roop mein dikhte hain.
                      • Head: Head shoulders ke darmiyan hota hai aur typically shoulders se neeche hota hai. Head shoulders se thoda bara hota hai.
                      • Neckline: Neckline shoulders ke darmiyan ek line hoti hai jo left shoulder aur right shoulder ko join karti hai.
                      2. Inverse Head and Shoulders: Formation

                      Inverse Head and Shoulders pattern ka formation niche diye gaye steps ko follow karta hai:
                      1. Left Shoulder: Downtrend ke baad price chart par ek low point form hota hai jo left shoulder ki tarah dikhta hai.
                      2. Head: Left shoulder ke baad ek lower low point form hota hai jo head ki tarah dikhta hai. Head typically left shoulder se neeche hota hai.
                      3. Right Shoulder: Head ke baad ek higher low point form hota hai jo right shoulder ki tarah dikhta hai. Is low point left shoulder se higher hota hai.
                      4. Neckline: Left shoulder aur right shoulder ke beech ek neckline form hoti hai jo horizontal line ya sloping line ho sakti hai.

                      3. Inverse Head and Shoulders: Trading Strategy

                      Inverse Head and Shoulders pattern ko trading strategy ke liye istemal karne ke liye niche diye gaye steps ko follow kiya ja sakta hai:
                      1. Identify Pattern: Price chart par inverse head and shoulders pattern ko identify karein. Iske liye left shoulder, head, aur right shoulder ko confirm karna zaroori hai.
                      2. Entry Point: Pattern ko confirm karne ke baad, entry point ka wait karein jab price neckline ko breakout karta hai. Breakout ke baad bullish entry lena consider kiya ja sakta hai.
                      3. Stop Loss: Stop loss ko set karein just neeche left shoulder ya neckline ke neeche taki losses ko minimize kiya ja sake.
                      4. Target Price: Target price ko set karein jo neckline ke upar ya pattern ke height se calculate kiya ja sakta hai.
                      4. Inverse Head and Shoulders: Example

                      Maan lo ki EUR/USD ka price chart par inverse head and shoulders pattern form hua hai. Left shoulder, head, aur right shoulder clearly identify kiye gaye hain aur neckline breakout bhi confirm ho chuka hai. Is scenario mein trader bullish entry lena consider kar sakta hai stop loss set karke aur target price ko calculate karke.

                      5. Conclusion

                      Inverse Head and Shoulders candlestick pattern ek powerful bullish reversal pattern hai jo traders ko trend reversal ka early indication deta hai. Is pattern ko identify karke traders trading opportunities ko spot kar sakte hain aur profits generate kar sakte hain. Yeh pattern market analysis ke liye ek important tool hai jo forex trading mein istemal kiya ja sakta hai.

                      Dhyan rahe ki har pattern aur strategy ke saath risk management zaroori hai. Pattern ko confirm karne ke baad bhi market conditions aur price action ko monitor karte rahein taki aap apne trading decisions ko optimize kar sakein aur losses ko minimize kar sakein.


                      • <a href="https://www.instaforex.org/ru/?x=ruforum">InstaForex</a>
                      • #12 Collapse

                        **Inverse Head and Shoulders Candlestick Patterns Trading: Kya Hai Aur Kaise Trade Karein?**
                        Forex trading mein technical analysis ka istemaal market trends aur price movements ko samajhne ke liye hota hai. In patterns mein se ek hai "Inverse Head and Shoulders Pattern." Yeh pattern price charts par specific formation ke sath appear hota hai aur traders ko bullish reversal signals provide karta hai. Is post mein, hum Inverse Head and Shoulders Pattern ko detail mein samjhenge, iski characteristics aur trading strategies ko explore karenge, aur dekhenge ke forex trading mein is pattern ka istemaal kaise kiya ja sakta hai.

                        **Inverse Head and Shoulders Pattern Kya Hai?**

                        Inverse Head and Shoulders Pattern ek candlestick pattern hai jo market ke bearish trend ke baad bullish reversal ko indicate karta hai. Yeh pattern teen distinct parts par مشتمل hota hai: left shoulder, head, aur right shoulder. Is pattern ka formation market ke downtrend ke baad bullish trend ki taraf shift ko signify karta hai.

                        **Characteristics of Inverse Head and Shoulders Pattern:**

                        1. **Formation:**
                        - **Left Shoulder:** Yeh pattern ka pehla part hota hai, jahan market ek decline ke baad thoda rebound karta hai aur phir se girta hai.
                        - **Head:** Yeh pattern ka central part hota hai, jahan market ne pehle se lower decline create kiya aur phir rebound karta hai.
                        - **Right Shoulder:** Yeh pattern ka last part hota hai, jahan market head ke level ke paas decline karta hai aur phir se upar ki taraf move karta hai.

                        2. **Neckline:** Inverse Head and Shoulders Pattern ki ek key component neckline hoti hai. Yeh horizontal line hoti hai jo left shoulder aur right shoulder ke peaks ko connect karti hai. Pattern complete tab hota hai jab price neckline ko breakout karti hai.

                        3. **Volume:** Pattern ke formation ke dauran volume bhi increase hona chahiye. Volume left shoulder se right shoulder tak gradually increase hota hai aur breakout ke waqt high volume observe hota hai, jo pattern ke validity ko confirm karta hai.

                        **Trading Strategies Using Inverse Head and Shoulders Pattern:**

                        1. **Trade Entry Points:** Inverse Head and Shoulders Pattern ko identify karke aap trade entry points ko determine kar sakte hain. Pattern ke complete hone ke baad aur neckline ko breakout karne par buy signal generate hota hai. Yeh point aapke trade open karne ke liye ideal hota hai.

                        2. **Stop-Loss Aur Take-Profit Levels:** Effective risk management ke liye, stop-loss aur take-profit levels ko set karna zaroori hota hai. Stop-loss ko right shoulder ke low ke niche set karna chahiye taake unexpected market fluctuations se bach sakein. Take-profit levels ko pattern ke height ke according calculate kiya ja sakta hai, jo aapko potential gains ko maximize karne mein madad karta hai.

                        3. **Confirmation Indicators:** Inverse Head and Shoulders Pattern ko confirm karne ke liye other technical indicators, jaise Moving Averages (MA) aur Relative Strength Index (RSI), ka use karna beneficial hota hai. Yeh indicators aapko market ke overall trend aur momentum ko verify karne mein madad karte hain.

                        4. **Risk Management:** Risk management ke liye, pattern ke signals aur market conditions ko consider karke trading decisions lein. Pattern ko high volatility aur other risk factors ke sath trade karte waqt cautious approach adopt karna zaroori hai.

                        **Conclusion:**

                        Inverse Head and Shoulders Pattern forex trading mein ek valuable tool hai jo bearish trend ke baad bullish reversal ko indicate karta hai. Is pattern ki characteristics ko samajhkar aur effective trading strategies ko implement karke, aap market ke potential reversals ko accurately identify kar sakte hain. Inverse Head and Shoulders Pattern ke sath other technical indicators ka use karke, aap apne trading decisions ko refine kar sakte hain aur successful trading outcomes achieve kar sakte hain.

                        اب آن لائن

                        Working...
                        X