Forex Top Chart Pattern.
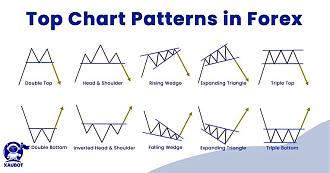
Forex Top chart pattern is a technical analysis term that refers to a trend reversal pattern that signals the end of an uptrend. This pattern is formed when the price of an asset rises to a certain level and then starts to decline, forming a peak or top.

The Forex Top pattern is also known as a "double top" when it occurs twice in a row. Pattern ki help se agar trading ko continue kiya jaaye to is Tarah se ki jaane wali trading ke results bahut acche hasil ho jaate Hain.
Continuation Chart Pattern.
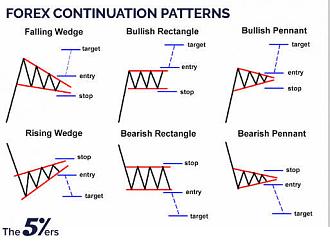
Continuation chart patterns are technical analysis patterns that indicate the continuation of the current trend. These patterns are formed when the price of an asset takes a pause or consolidates before continuing in the same direction as the previous trend. The most common continuation patterns are "flags," "pennants," and "wedges."Maximum members Apne trading ko bahut acchi se continue kiye hue hain aur yahi reason hai ki vah apni trading mein regularly patterns ka use kar rahe hote Hain.

Reversal Chart Pattern.
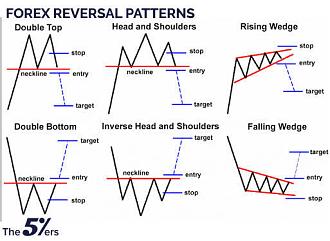
Reversal chart patterns are technical analysis patterns that signal a trend reversal. These patterns are formed when the price of an asset changes direction and begins to move in the opposite direction of the previous trend. The most common reversal patterns are "head and shoulders," "double bottom," and "triple top."

These patterns are used by traders to identify potential entry and exit points in the market. Patterns ki help se agar trading ko continue kiya jaaye to iske sath risk environment ko bhi acchi Tarah se analyse Karke aur apni trading ko continue karna hota hai is Tarah se loss hone ke chances minimise hote Hain.
Forex Top chart pattern is a technical analysis term that refers to a trend reversal pattern that signals the end of an uptrend. This pattern is formed when the price of an asset rises to a certain level and then starts to decline, forming a peak or top.
The Forex Top pattern is also known as a "double top" when it occurs twice in a row. Pattern ki help se agar trading ko continue kiya jaaye to is Tarah se ki jaane wali trading ke results bahut acche hasil ho jaate Hain.
Continuation Chart Pattern.
Continuation chart patterns are technical analysis patterns that indicate the continuation of the current trend. These patterns are formed when the price of an asset takes a pause or consolidates before continuing in the same direction as the previous trend. The most common continuation patterns are "flags," "pennants," and "wedges."Maximum members Apne trading ko bahut acchi se continue kiye hue hain aur yahi reason hai ki vah apni trading mein regularly patterns ka use kar rahe hote Hain.
Reversal Chart Pattern.
Reversal chart patterns are technical analysis patterns that signal a trend reversal. These patterns are formed when the price of an asset changes direction and begins to move in the opposite direction of the previous trend. The most common reversal patterns are "head and shoulders," "double bottom," and "triple top."
These patterns are used by traders to identify potential entry and exit points in the market. Patterns ki help se agar trading ko continue kiya jaaye to iske sath risk environment ko bhi acchi Tarah se analyse Karke aur apni trading ko continue karna hota hai is Tarah se loss hone ke chances minimise hote Hain.

تبصرہ
Расширенный режим Обычный режим