Ap Yahan pe bataye k support and Resistance kia chez hai aur ye kese work karta hai.
-
BosskingSenior Member
- Feb 2019
- 6940
- 3021
- 9344
- 1 788 USD
-
<a href="https://www.instaforex.org/ru/?x=ruforum">InstaForex</a> -
YashfaSenior Member

- Mar 2024
- 2321
- 742
- 606
- 443 USD
1. Introduction: Forex Trading Ki Dunya Mein Support aur Resistance Forex trading ek azeem dunya hai jahan currencies ko kharidna aur bechna hota hai, taa'aroof ke hisab se. Is dunya mein traders ko mukhtalif tools aur strategies istemal karne padte hain. Support aur resistance un mukhtalif tools mein se ek hai jo traders ke liye ahem hota hai.
Forex trading dunya bhar mein logon ke darmiyan ek popular aur lucrative shobha hai. Is mein currencies ko kharidna aur bechna hota hai taake munafa haasil kiya ja sake. Lekin, is kaam mein kamiyaabi haasil karne ke liye, traders ko market ki understanding aur technical analysis ka istemal karna zaroori hota hai. Support aur resistance levels bhi is technical analysis ka ek ahem hissa hain.
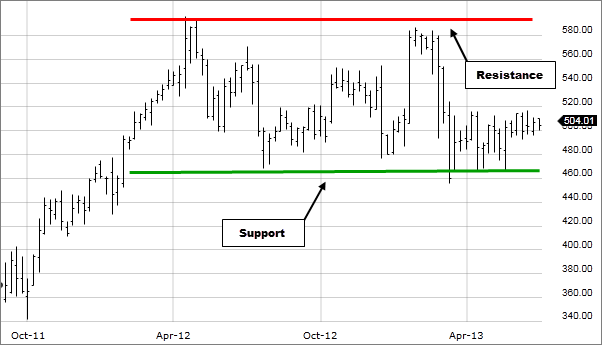
2. Support aur Resistance: Muqaddas Termon Ka Izhaar Support aur resistance asal mein mukhtalif levels hote hain jo price movements ke liye significant hote hain. Support level woh level hai jahan se price girne se pehle rokta hai aur resistance level woh level hai jahan se price barhne se pehle rukta hai.
In dono concepts ka samajhna forex trading mein kaafi ahem hota hai kyunki ye traders ko market ke trend aur future price movements ke baare mein idea dete hain. Support level traders ko ye indication deta hai ke price girne ke baad ruk sakta hai aur phir se upar ja sakta hai, jabke resistance level traders ko ye batata hai ke price barhne ke baad ruk sakta hai aur phir se neeche aa sakta hai.
3. Support: Girawat Ke Khilaf Himayat Support ek tarah ka price level hai jahan se traders ko umeed hoti hai ke price girne ke baad ruk jayega aur phir se barh jayega. Ye level aksar previous low prices ya technical indicators ke zariye identify kiya jata hai.
Support level ka hona traders ke liye ek aham indication hai ke price girne ke baad ek certain point par ruk sakta hai aur phir se upar ja sakta hai. Is level ko samajh kar traders apne trading strategies ko design karte hain taake woh entry aur exit points ko sahi tarah se tay kar sakein.
4. Resistance: Barhavat Ke Khilaf Rok Resistance woh level hai jahan se traders ko umeed hoti hai ke price barhne ke baad ruk jayega aur phir se gir jayega. Ye level aksar previous high prices ya technical indicators ke zariye identify kiya jata hai.
Resistance level ka hona bhi traders ke liye ek important factor hai kyunki ye indicate karta hai ke price barhne ke baad ek certain point par ruk sakta hai aur phir se neeche aa sakta hai. Is level ko samajh kar traders apne trading decisions ko optimize karte hain aur risk ko minimize karte hain.
5. Support aur Resistance Ke Muhim Functions Support aur resistance levels ka maqsad price movements ko analyze karna aur trading decisions ke liye guidance faraham karna hota hai. In levels ko samajhna zaroori hai taake traders apne trades ko sahi waqt par execute kar sakein.
Support aur resistance levels ke istemal se traders market ke trends ko samajh sakte hain aur potential entry aur exit points ko identify kar sakte hain. Ye levels traders ko market ki direction ke baare mein idea dete hain aur unhein trading decisions ke liye confidence faraham karte hain.
6. Importance of Support aur Resistance in Forex Trading Forex trading mein support aur resistance ki ahmiyat bohot ziada hai. Ye levels traders ko market trends samajhne aur entry aur exit points tay karnay mein madadgar sabit hote hain.
Support aur resistance levels ke bina, traders market movements ko samajhne mein mushkilat ka samna karte hain aur unka trading performance bhi suffer hota hai. In levels ko samajh kar traders apne trades ko better manage kar sakte hain aur market volatility ko navigate kar sakte hain.
7. Identifying Support aur Resistance Levels Support aur resistance levels ko identify karna trading mein maharat ka ek hissa hai. Technical analysis ke tools jaise ki price charts, trend lines, aur Fibonacci retracements in levels ko detect karne mein madad karte hain.
Traders ko market mein support aur resistance levels ko identify karne ke liye mukhtalif technical tools aur indicators ka istemal karna padta hai. Price charts par trend lines draw karke aur Fibonacci retracements ke levels ko analyze karke traders ye levels identify kar sakte hain.
8. Trend Lines: Support aur Resistance Ko Shanaakht Karne Ka Aik Tareeqa Trend lines support aur resistance levels ko identify karne ka asan tareeqa hain. In lines ko price chart par draw karke traders market trend ko samajh sakte hain aur potential support aur resistance levels ko dekh sakte hain.
Trend lines draw karke traders market trend ko identify kar sakte hain aur potential support aur resistance levels ko pinpoint kar sakte hain. In lines ko draw karne ka tarika simple hota hai aur ye traders ko market ke direction ka pata lagane mein madad karte hain.
9. Fibonacci Retracements: Price Movements Ke Liye Useful Tool Fibonacci retracements bhi support aur resistance levels ko identify karne ke liye istemal kiye jaate hain. Ye tool price movements ko analyze karke traders ko potential reversal points ke bare mein idea deta hai.
Fibonacci retracements traders ko market ke price movements ko analyze karne mein madad karte hain aur potential support aur resistance levels ko identify karne mein help karte hain. Traders ko Fibonacci retracement levels ko use karke market trends ko samajhna asaan ho jata hai.
10. Trading Strategies Using Support aur Resistance Support aur resistance levels ko istemal karke traders mukhtalif trading strategies develop karte hain jaise ki breakout trading, range trading, aur trend reversal trading.
Traders support aur resistance levels ko istemal karke mukhtalif trading strategies ko design karte hain taake woh market movements ke mutabiq trades ko execute kar sakein. In strategies mein support aur resistance levels ki understanding ek ahem role ada karte hain.
11. Breakout Trading: Trading Mein Aagay Barhne Ki Strategy Breakout trading mein traders support aur resistance levels ko istemal karte hain taake jab price un levels ko cross karta hai, toh unhein trading opportunities mil sakein.
Breakout trading mein traders support aur resistance levels ko dekhte hain taake woh potential breakout points ko identify kar sakein aur unke istemal se trading opportunities haasil kar sakein. Is strategy mein traders ko market ke momentum aur volatility ko bhi dhyaan mein rakhna hota hai.
12. Range Trading: Sideways Markets Mein Kamai Ki Strategy Range trading mein traders support aur resistance levels ke darmiyan trade karte hain, jab market sideways move kar raha hota hai. Is strategy mein traders range boundaries ke andar aur bahar trades karte hain.
Range trading mein traders ko market ke range boundaries ko identify karna hota hai aur unke darmiyan trade karna hota hai. Is strategy mein traders ko market ke consolidation periods mein trading opportunities mil sakti hain.
13. Conclusion: Support aur Resistance Ke Istemal Ki Ahmiyat Forex trading mein support aur resistance levels ke istemal ka maqsad traders ko market trends aur price movements ko samajhna aur trading decisions ke liye guidance faraham karna hai. In levels ko samajh kar traders apne trading strategies ko improve kar sakte hain aur behtar results haasil kar sakte hain.
Support aur resistance levels ka samajhna forex trading mein ek ahem factor hai jo traders ko market dynamics ko samajhne aur trading decisions ko optimize karne mein madad deta hai. In levels ko istemal karke traders apne trading skills ko develop kar sakte hain aur consistent profits haasil kar sakte hain.
Dunya Bhar Mein Forex Trading: Mazid Parhain aur Seekhain Forex trading dunya bhar mein logon ke darmiyan ek popular aur lucrative shobha hai. Agar aap bhi is dunya mein qadam rakhna chahte hain toh support aur resistance levels ke istemal ka tarika seekhna zaroori hai. Is tarah ke technical concepts ko samajhna aur unka istemal karke aap apne trading skills ko improve kar sakte hain aur behtar trading results haasil kar sakte hain.
-
Hareem55Senior Member
- Mar 2024
- 2589
- 737
- 783
- 355 USD
InstaSpot: کسی بھی EPS اور بینک سے منافع واپس لیں، اور EPS اور cryptocurrencies کے تبادلے پر 7% تک کمائیں۔
1. Support aur Resistance Ki Ahmiyat:
Forex trading mein support aur resistance levels ka ilm hona bohot zaroori hai, kyun ke ye market ke dynamics ko samajhne mein madad karte hain. Support aur resistance levels market mein price movements ko control karne wale factors hote hain. In levels ko samajhna traders ke liye zaroori hai takay wo market ke trend aur price behavior ko samajh sakein. Support aur resistance levels market mein price ke stability ko darust rakhte hain aur traders ko market ke direction ka andaza dete hain.
2. Support Kya Hai?:
Support level woh price point hota hai jahan traders expect karte hain ke market ka price neeche girne ke baad rukay ga aur phir se upar uthay ga. Support level market mein buyers ka area hota hai jahan se market mein demand hoti hai aur price ko upar le jati hai. Jab price support level tak pohanchta hai, traders ko ummed hoti hai ke wahaan se price ko neeche girne se roka jayega aur phir se upar jane ka trend shuru hoga.
Support level ko identify karne ke liye traders previous price movements ko analyze karte hain aur woh level jahan se price ko girne se roka jata hai ko support level kehte hain. Ye level market ke momentum ko slow down karta hai aur price ko stable rakhta hai.
3. Resistance Kya Hai?:
Resistance level woh price point hota hai jahan traders expect karte hain ke market ka price ooper jata hai lekin phir wahaan se neeche aa jata hai. Resistance level market mein sellers ka area hota hai jahan se market mein supply hoti hai aur price ko neeche le jati hai. Jab price resistance level tak pohanchta hai, traders ko ummed hoti hai ke wahaan se price ko ooper jane se roka jayega aur phir se neeche jane ka trend shuru hoga.
Resistance level ko identify karne ke liye traders previous price movements ko analyze karte hain aur woh level jahan se price ko ooper jane se roka jata hai ko resistance level kehte hain. Ye level market ke momentum ko slow down karta hai aur price ko neeche rakhta hai.
4. Support aur Resistance ke Types:
Support aur resistance levels do types ke hote hain: psychological levels aur technical levels. Psychological levels traders ke mindset aur sentiments ko reflect karte hain, jabke technical levels market ke previous highs aur lows se related hote hain.
Psychological levels usually round numbers hote hain, jaise ke 1.1000, 1.2000, etc. In levels ko traders bohot ahmiyat dete hain kyun ke ye market ke participants ka sentiment reflect karte hain. Agar kisi currency pair ka price 1.1000 level ko break karta hai to traders ka mindset usually change ho jata hai aur woh expect karte hain ke price neeche jaayega.
Technical levels market ke previous highs aur lows se related hote hain. Ye levels price charts par easily identify kiye ja sakte hain aur traders in levels ko analyze kar ke apne trading strategies banate hain. Jab price kisi previous high ya low ko touch karta hai, toh wahaan se price ka direction change ho sakta hai.
5. Kaise Identify Karein Support aur Resistance Levels:
Support aur resistance levels ko identify karne ke liye traders price charts ka istemal karte hain aur previous highs aur lows par focus karte hain. Traders price charts par trend lines, horizontal lines, aur Fibonacci retracement ka istemal karte hain takay wo support aur resistance levels ko identify kar sakein.
Trend lines ko draw kar ke traders current trend ko analyze karte hain aur support aur resistance levels ko identify karte hain. Horizontal lines traders ko previous highs aur lows ko mark karne mein madad deti hain aur Fibonacci retracement traders ko potential support aur resistance levels ko determine karne mein madadgar hota hai.
6. Fibonacci Retracement Ka Istemal:
Fibonacci retracement bhi support aur resistance levels ko identify karne mein madadgar hota hai. Ye technique market ke important turning points ko mark karta hai. Fibonacci retracement levels market ke previous high aur low points ko use karte hain aur traders ko ye levels provide karte hain jahan se price ko expect kiya ja sakta hai ke woh bounce ya reverse ho sakta hai.
Fibonacci retracement levels ko draw karne ke liye traders high aur low points ko select karte hain aur phir Fibonacci retracement tool ka istemal karte hain. Ye tool traders ko different retracement levels provide karta hai jaise 0.382, 0.500, 0.618, etc. Ye levels support aur resistance levels ko identify karne mein madadgar hote hain.
7. Moving Averages Aur Support/Resistance:
Moving averages bhi support aur resistance levels ko identify karne mein madadgar hote hain. Traders moving averages ke cross points par support aur resistance levels ko samajhte hain. Moving averages traders ko market ke trend ko analyze karne mein madad karte hain aur jab moving averages ek dusre ko cross karte hain, toh wahaan support aur resistance levels ban jate hain.
Moving averages ke alag alag types hote hain jaise ke simple moving average (SMA), exponential moving average (EMA), aur weighted moving average (WMA). Har moving average ke alag characteristics hote hain aur traders inka istemal kar ke market ke behavior ko analyze karte hain.
8. Support aur Resistance Ka Istemal Trading Mein:
Support aur resistance levels trading mein ahem role ada karte hain. Traders in levels ko istemal kar ke entry aur exit points ka faisla karte hain. Jab price support level tak pohanchta hai, toh traders expect karte hain ke price wahaan se bounce karega aur wo long position le sakte hain. Jab price resistance level tak pohanchta hai, toh traders expect karte hain ke price wahaan se reverse ho kar neeche jaayega aur wo short position le sakte hain.
Support aur resistance levels ko istemal kar ke traders apni trading strategies ko develop karte hain aur market ke price movements ko analyze karte hain. Ye levels traders ko market ke direction ka andaza lagane mein madad karte hain aur unhein trading mein confidence dete hain.
9. Breakouts aur Bounces:
Breakout jab hota hai jab price support ya resistance level ko cross karta hai, jabke bounce hota hai jab price support ya resistance level se takra kar wapas mudamad hoti hai. Breakout aur bounce dono hi market ke turning points ko represent karte hain aur traders in points ko analyze kar ke trading decisions lete hain.
Breakout hone par traders market ke new direction ka andaza lagate hain aur unhein naye trading opportunities mil sakti hain. Jab price support ya resistance level se bounce karta hai, toh traders expect karte hain ke price wapas opposite direction mein jaayega aur unhein trading opportunities mil sakti hain.
10. Support aur Resistance Levels Ki Tawaqquf:
Support aur resistance levels ke qareeb traders apni positions ko tawaqquf karte hain, kyun ke ye levels market ka turning point represent karte hain. Jab price support ya resistance level ke qareeb pohanchta hai, toh traders cautious ho jaate hain aur wo apni positions ko monitor karte hain. Agar price support ya resistance level ko break karta hai, toh traders apni positions ko adjust karte hain takay wo market ke new direction ka faida utha sakein.
Support aur resistance levels ke qareeb tawaqquf karne se traders apni positions ko protect karte hain aur nuksan se bachne ka moqa milta hai. Ye levels traders ko market ke dynamics ko samajhne mein madad karte hain aur unhein trading mein confidence dete hain.
11. Stop Loss Aur Take Profit Ke Liye Support Aur Resistance:
Traders stop loss aur take profit levels ko support aur resistance levels ke qareeb rakhte hain, taake agar market opposite direction mein chali jaye, toh nuksan kam ho. Stop loss level ko traders woh price point select karte hain jahan par wo apni position ko close karna chahte hain agar price unke favor mein nahi jaati. Take profit level ko traders woh price point select karte hain jahan par wo apni position ko close karna chahte hain agar price unke favor mein jaati hai.
Support aur resistance levels traders ko stop loss aur take profit levels ko determine karne mein madadgar hote hain. Jab price support ya resistance level ko approach karta hai, toh traders apne stop loss aur take profit levels ko adjust karte hain takay wo market ke movements ko samajh sakein aur apni positions ko protect kar sakein.
12. Price Action Trading aur Support/Resistance:
Price action traders support aur resistance levels par focus karte hain aur market ke price action se trading karte hain. Price action trading mein traders price charts ko analyze karte hain aur market ke price movements ko samajhte hain. Jab price support ya resistance level ko approach karta hai, toh traders market ke price action ko dekhte hain aur unhein trading opportunities mil sakti hain.
Price action trading mein traders ko technical indicators ka istemal karne ki zaroorat nahi hoti kyun ke wo market ke price action ko directly analyze karte hain. Support aur resistance levels price action traders ke liye ahem hote hain kyun ke ye levels market ke turning points ko represent karte hain aur unhein trading opportunities provide karte hain.
13. Support aur Resistance Ka Istemal Trend Ki Tafteesh Mein:
Trend ki tafteesh mein support aur resistance levels ahem hote hain, kyun ke ye levels market ke trend ke direction ko samajhne mein madad karte hain. Jab price support level ko break karta hai aur neeche jaata hai, toh ye indicate karta hai ke market downtrend mein ja sakti hai. Jab price resistance level ko break karta hai aur ooper jaata hai, toh ye indicate karta hai ke market uptrend mein ja sakti hai.
Support aur resistance levels ko trend ki tafteesh mein istemal kar ke traders market ke direction ka andaza lagate hain aur unhein trading opportunities mil sakti hain. Jab price support ya resistance level ko approach karta hai, toh traders market ke trend ko analyze karte hain aur unhein apne trading strategies ko adjust karne ka moqa milta hai.
14. Conclusion:
In conclusion, support aur resistance levels forex trading mein bohot ahem hotay hain. Ye levels traders ko market ke dynamics ko samajhne mein madad faraham karte hain aur unhein trading strategies banane mein madadgar sabit hote hain. Traders ko zaroori hai ke wo support aur resistance levels ko identify karne aur samajhne ki koshish karein takay wo market ke trend ko analyze kar sakein aur apne trading decisions ko improve kar sakein. Support aur resistance levels trading mein bohot ahem role ada karte hain aur traders in levels ka istemal kar ke apne trading performance ko improve kar sakte hain.
-
MIrfan512Senior Member
- Nov 2023
- 160
- 124
- 201
- 61 USD
Forex trading mein Support aur Resistance levels ka buhat bara ahmiyat hai. Ye levels traders ko market trends samajhne aur trading decisions lene mein madad karte hain. Yahan kuch ahmiyat wali points hain:
Price Predictions:
Support aur Resistance levels traders ko price ke future movements ka idea dete hain. Support level se traders expect karte hain ke price neeche ja kar rukay gi, jabke Resistance level se traders expect karte hain ke price oopar jaa kar rukay gi. In levels ko samajh kar, traders apni predictions banate hain ke kis direction mein market move ho sakta hai.
Entry aur Exit Points:
Support aur Resistance levels traders ko entry aur exit points provide karte hain. Traders Support level par buy orders place kar sakte hain jab wo expect karte hain ke price neeche ja kar rukay gi. Similarly, Resistance level par sell orders place kiye ja sakte hain jab traders expect karte hain ke price oopar jaa kar rukay gi.
Risk Management:
Support aur Resistance levels traders ko apne risk ko manage karne mein madad karte hain. Agar ek trader Support level ke neeche buy order place karta hai, toh wo apni stop-loss order ko just neeche Support level ke paas rakh sakta hai. Is tarah se, agar price Support level ke neeche jaati hai, toh trader ka loss minimize ho sakta hai.
Market Psychology:
Support aur Resistance levels market psychology ko reflect karte hain. Jab price Support level tak jaati hai, toh traders mein buying interest increase hoti hai kyunki wo expect karte hain ke price wahan se bounce back karegi. Isi tarah, jab price Resistance level tak jaati hai, toh selling pressure increase hoti hai kyunki traders expect karte hain ke price wahan se reverse hoga. Overall, Support aur Resistance levels forex trading mein ek important tool hain jo traders ko market analysis aur trading decisions lene mein madad karta hai.
-
Muhammad512Senior Member
- Mar 2023
- 406
- 369
- 408
- 983 USD
Support and resistance are fundamental concepts in technical analysis used to identify key levels on a price chart where the price of an asset is likely to encounter obstacles in its movement. These levels play a crucial role in making trading decisions and understanding market dynamics.
Support:
Support is a price level at which the demand for an asset is strong enough to prevent the price from declining further. It acts as a floor beneath the price, where buying interest tends to outweigh selling pressure, causing the price to bounce higher. Traders often view support levels as potential buying opportunities.
Key characteristics of support levels include:- Price Bounces: When the price approaches a support level, it tends to bounce higher as buying interest increases.
- Role Reversal: Once a resistance level is breached, it often becomes a new support level as previous resistance turns into support.
- Volume Increase: Support levels may be accompanied by an increase in trading volume, indicating strong buying interest.
Resistance is a price level at which the supply of an asset is strong enough to prevent the price from rising further. It acts as a ceiling above the price, where selling interest tends to outweigh buying pressure, causing the price to retreat lower. Traders often view resistance levels as potential selling opportunities.
Key characteristics of resistance levels include:- Price Rejections: When the price approaches a resistance level, it tends to face selling pressure and retreat lower.
- Role Reversal: Once a support level is breached, it often becomes a new resistance level as previous support turns into resistance.
- Volume Increase: Resistance levels may be accompanied by an increase in trading volume, indicating strong selling interest.
- Price Prediction: Support and resistance levels help traders anticipate future price movements and identify potential areas of price reversal or continuation.
- Entry and Exit Points: Traders use support and resistance levels to determine optimal entry and exit points for their trades. For example, buying near support levels and selling near resistance levels.
- Risk Management: Support and resistance levels also play a crucial role in risk management, as traders often place stop-loss orders below support levels for long positions and above resistance levels for short positions.
- Market Psychology: Support and resistance levels reflect the collective psychology of market participants. They represent areas where traders are willing to buy or sell, making them significant reference points on a price chart.
Overall, support and resistance are essential concepts in technical analysis that help traders interpret price action and make informed trading decisions in various financial markets, including stocks, forex, commodities, and cryptocurrencies.
-
SkydiversSenior Member
- Mar 2023
- 1265
- 239
- 367
- 497 USD
InstaSpot: کسی بھی EPS اور بینک سے منافع واپس لیں، اور EPS اور cryptocurrencies کے تبادلے پر 7% تک کمائیں۔
Trading ke duniya mein support aur resistance do bohot hi ahem concepts hain. Yeh do concepts technical analysis ka hissa hain, jo ke traders aur investors ko madad karte hain taake woh market ke trends ko samajh sakein aur behtar trading decisions le sakein.
Support Kya Hai?
Support ek price level hota hai jahan pe demand itni strong hoti hai ke price ko aur girne se rok deti hai. Matlab, jab price support level pe reach karti hai, zyadatar traders yeh samajhte hain ke yeh buying ka acha mauka hai aur woh assets ko kharidna shuru kar dete hain. Is wajah se, price phir se upar jaane lagti hai. Support level ko identify karna trading ke liye bohot zaruri hai kyunki yeh aapko signal deta hai ke kab buy karna chahiye.
Support Levels Kaise Identify Hote Hain?
Support levels ko identify karne ke liye traders technical analysis tools use karte hain. Kuch aam tools aur methods yeh hain:- Historical Price Levels: Pehle ka price data dekha jata hai taake identify kiya ja sake ke pichle kuch arsey mein kin levels pe price ne support liya tha.
- Moving Averages: Moving averages, jaise ke 50-day ya 200-day moving averages, ko support levels ke taur pe use kiya jata hai. Jab price in moving averages ke paas aata hai, yeh levels support ke taur pe kaam karte hain.
- Trend Lines: Ek straight line jo ke price ke neeche draw ki jati hai aur multiple points pe touch karti hai, usko support trend line kehte hain. Yeh line bhi support ke taur pe kaam karti hai.
Resistance support ka ulta hota hai. Yeh woh price level hota hai jahan pe supply itni strong hoti hai ke price ko aur barhne se rok deti hai. Matlab, jab price resistance level pe reach karti hai, zyadatar traders yeh samajhte hain ke yeh selling ka acha mauka hai aur woh assets ko bechna shuru kar dete hain. Is wajah se, price phir se neeche aane lagti hai. Resistance level ko identify karna bhi trading ke liye bohot zaruri hai kyunki yeh aapko signal deta hai ke kab sell karna chahiye.
Resistance Levels Kaise Identify Hote Hain?
Resistance levels ko identify karne ke liye bhi traders technical analysis tools use karte hain. Kuch aam tools aur methods yeh hain:- Historical Price Levels: Pehle ka price data dekha jata hai taake identify kiya ja sake ke pichle kuch arsey mein kin levels pe price ne resistance face kiya tha.
- Moving Averages: Moving averages, jaise ke 50-day ya 200-day moving averages, ko resistance levels ke taur pe use kiya jata hai. Jab price in moving averages ke paas aata hai, yeh levels resistance ke taur pe kaam karte hain.
- Trend Lines: Ek straight line jo ke price ke upar draw ki jati hai aur multiple points pe touch karti hai, usko resistance trend line kehte hain. Yeh line bhi resistance ke taur pe kaam karti hai.
Support aur resistance ke concepts ke peeche psychology bhi kaam kar rahi hoti hai. Jab traders dekhtay hain ke kisi specific price level pe price baar baar ruk rahi hai (support) ya baar baar wapas ja rahi hai (resistance), toh woh in levels ko mentally mark kar lete hain aur trading decisions us hisaab se lete hain.- Support Psychology: Jab price support level pe hoti hai, buyers ko lagta hai ke yeh ek achi buying opportunity hai kyunki price shayad yahan se rebound karay. Is wajah se buying pressure barhta hai aur price wapas upar jaati hai.
- Resistance Psychology: Jab price resistance level pe hoti hai, sellers ko lagta hai ke yeh ek achi selling opportunity hai kyunki price shayad yahan se neeche aaye. Is wajah se selling pressure barhta hai aur price wapas neeche jaati hai.
Aksar hota yeh hai ke support aur resistance levels intact nahi rehte aur break ho jate hain. Jab support level break hota hai, price neeche gir sakti hai aur ek naya support level dhondh sakti hai. Isi tarah, jab resistance level break hota hai, price upar ja sakti hai aur ek naya resistance level dhondh sakti hai. Is process ko breakout kehte hain.
Breakout Strategies
Breakout strategies mein traders yeh anticipate karte hain ke agar support ya resistance level break hota hai, toh price us direction mein move karegi.- Support Breakout: Jab price support level ke neeche close hoti hai, traders isko bearish signal samajh kar selling position le sakte hain.
- Resistance Breakout: Jab price resistance level ke upar close hoti hai, traders isko bullish signal samajh kar buying position le sakte hain.
False breakouts bhi aksar dekhe jate hain. Matlab, price temporarily support ya resistance level ko break karti hai lekin phir wapas aa jati hai. Yeh traders ke liye misleading ho sakta hai. False breakouts ko avoid karne ke liye confirmation signals ka wait karna zaruri hota hai, jaise ke high volume pe breakout hona ya multiple candles ka us level ke upar/neeche close hona.
Combining Support aur Resistance with Other Indicators
Support aur resistance ko other technical indicators ke saath combine karke aur bhi strong trading strategies banayi ja sakti hain. Kuch common indicators hain:- Relative Strength Index (RSI): RSI ek momentum oscillator hai jo ke price ki speed aur change ko measure karta hai. Agar RSI overbought ya oversold zones mein ho aur price support ya resistance level pe ho, toh yeh strong signal ho sakta hai.
- Moving Average Convergence Divergence (MACD): MACD trend-following momentum indicator hai jo ke moving averages ke beech ke relationship ko show karta hai. Agar MACD bullish ya bearish crossover show kare aur price support ya resistance level pe ho, toh yeh trading decision ko support kar sakta hai.
- Fibonacci Retracement Levels: Fibonacci retracement levels bhi support aur resistance levels ko identify karne mein madadgar hote hain. Yeh levels price movements ke natural retracement levels ko show karte hain aur aksar accurate support aur resistance points provide karte hain.
Example 1: Support Level
Ek stock XYZ Corporation ka price $50 pe hai. Pehle bhi $50 ke level pe price baar baar ruki hai aur wahan se rebound ki hai. Yeh level support level kehlaayega. Agar price $50 pe wapas aaye, traders isko buying opportunity ke taur pe dekhenge aur kharidna shuru karenge, jis se price wapas upar jayegi.
Example 2: Resistance Level
Ek stock ABC Limited ka price $100 pe hai. Pehle bhi $100 ke level pe price baar baar ruki hai aur wahan se neeche aayi hai. Yeh level resistance level kehlaayega. Agar price $100 pe wapas aaye, traders isko selling opportunity ke taur pe dekhenge aur bechna shuru karenge, jis se price wapas neeche aayegi.
Example 3: Support Breakout
Ek stock LMN Inc ka price $75 pe hai aur $75 ek strong support level hai. Agar price $75 ke neeche close hoti hai, traders isko bearish signal samajh kar selling position le sakte hain aur price aur neeche ja sakti hai.
Example 4: Resistance Breakout
Ek stock PQR Enterprises ka price $120 pe hai aur $120 ek strong resistance level hai. Agar price $120 ke upar close hoti hai, traders isko bullish signal samajh kar buying position le sakte hain aur price aur upar ja sakti hai.
Support aur resistance trading ke do fundamental concepts hain jo ke traders ko market movements ko samajhne aur behtar trading decisions lene mein madad karte hain. Yeh levels market psychology ko reflect karte hain aur aksar important price points pe bante hain. Inhe identify karne ke liye historical price data, technical indicators aur trend lines use ki jati hain. Breakouts aur false breakouts bhi in levels ke saath hotay hain, aur inhe identify karne ke liye additional confirmation signals ka wait karna zaruri hota hai. Support aur resistance levels ko other technical indicators ke saath combine karke aur bhi effective trading strategies banayi ja sakti hain.
Yeh understanding aur application trading mein consistent success ke liye bohot zaruri hain. Har trader ko chahiye ke woh in concepts ko achi tarah se samjhe aur apni trading strategies mein inhe effectively use kare.
Believe in yourself and your abilities. When you fight for your dreams, you can achieve anything.
-
Ibrahim khanSenior Member
- Jun 2024
- 177
- 44
- 13
Assalamu alaikum
What Is Support and Resistance? TAARUF
Support aur resistance trading aur technical analysis (TA) ke fundamental concepts hain jo stock aur forex markets me price movement ko samajhne me madad karte hain.
Support:- Support wo level hota hai jahan price girti hai to usse rok diya jata hai aur price wahan se upar ki taraf badhti hai.
- Yeh level market me buyers ke zyada hone ki wajah se banta hai jo price ko neeche girne se rok dete hain.
Resistance:- Resistance wo level hota hai jahan price badhti hai to usse roka jata hai aur price wahan se neeche aati hai.
- Yeh level market me sellers ke zyada hone ki wajah se banta hai jo price ko upar badhne se rok dete hain.
In levels ko traders aur investors technical analysis me istemal karte hain taake wo market ki trend ko samajh saken aur apne trading decisions ko behtar bana saken
Support aur Resistance financial markets mein price movements ko samajhne aur trading decisions lene ke liye ahem concepts hain. Inki mukammal wazahat yeh hai:
Support- Definition: Support wo price level hai jahan par stock ya asset ki price girti hai lekin wahan se ruk jati hai aur phir se upar ki taraf badhti hai. Yeh level price ke neeche girne se rokne ki koshish karta hai.
- Mechanism: Jab price support level ke nazdeek hoti hai, to buyers zyada active hote hain aur zyada quantity mein kharidari karte hain. Isse price ko neeche girne se roka jata hai.
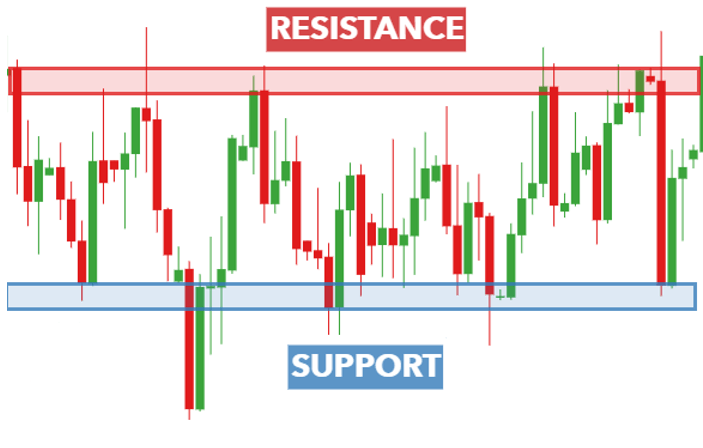
- Identification: Support ko charts par horizontal line ke zariye identify kiya jata hai, jahan par price pehle bhi girti thi aur phir wahan se upar aayi thi.
- Significance: Agar support level bar-bar test hota hai aur break nahi hota, to yeh market ke liye ek strong support signal hota hai. Lekin agar support level break ho jata hai, to yeh bearish signal ho sakta hai.
- Definition: Resistance wo price level hai jahan par stock ya asset ki price badhti hai lekin wahan se ruk jati hai aur phir se neeche aati hai. Yeh level price ke upar badhne se rokne ki koshish karta hai.
- Mechanism: Jab price resistance level ke nazdeek hoti hai, to sellers zyada active hote hain aur zyada quantity mein bechne lagte hain. Isse price ko upar badhne se roka jata hai.
- Identification: Resistance ko charts par horizontal line ke zariye identify kiya jata hai, jahan par price pehle bhi badh rahi thi aur phir wahan se neeche aayi thi.
- Significance: Agar resistance level bar-bar test hota hai aur break nahi hota, to yeh market ke liye ek strong resistance signal hota hai. Lekin agar resistance level break ho jata hai, to yeh bullish signal ho sakta hai.
- Support aur Resistance Levels Dynamic Hote Hain: Yeh levels market conditions ke mutabiq change ho sakte hain.
- Role Reversal: Jab support level break hota hai, to yeh resistance ban sakta hai aur vice versa.
- Volume Analysis: High trading volume at support or resistance levels often confirms the strength of these levels.
In levels ko samajhna aur track karna traders ko market trends aur potential reversals predict karne me madad karta hai.
Support aur resistance ki kuch mukhtalif aqsam hain jo traders aur analysts market trends ko samajhne aur predict karne ke liye istemal karte hain. In aqsam ko samajhna aapki trading strategies ko behtar bana sakta hai:
1. Horizontal Support and Resistance- Horizontal Support: Ek specific price level jahan price ne pehle multiple baar girne ke bawajood wahan se support liya ho.
- Horizontal Resistance: Ek specific price level jahan price ne pehle multiple baar badhne ke bawajood wahan se resist kiya ho.
- Trendline Support: Trendline jo ek upward price trend ko support karti hai. Yeh line low points ko connect karti hai aur price ko neeche girne se rokti hai.
- Trendline Resistance: Trendline jo ek downward price trend ko resist karti hai. Yeh line high points ko connect karti hai aur price ko upar badhne se rokti hai.
- Moving Averages: Moving averages (e.g., 50-day or 200-day moving averages) dynamic support aur resistance levels provide karte hain. Jab price moving average ke aas-paas hoti hai, yeh level support ya resistance ka kaam kar sakta hai.
- Round Numbers: Round numbers (e.g., 100, 1000) psychological support aur resistance levels ban sakte hain, jahan traders ki buying ya selling activity zyada hoti hai.
- Pivot Point Support and Resistance: Daily, weekly, ya monthly pivot points calculate kiye jate hain jo future support aur resistance levels identify karne me madad karte hain. Pivot point ek central level hota hai aur iske around multiple support aur resistance levels calculate kiye jate hain.
- Fibonacci Support and Resistance: Fibonacci retracement levels (e.g., 23.6%, 38.2%, 61.8%) technical analysis me support aur resistance levels identify karne ke liye use kiye jate hain, jo price retracement ke potential levels ko indicate karte hain.
- Volume Profile: Volume profile chart par price levels par trading volume ko plot karta hai, jo support aur resistance levels identify karne me madad karta hai. High volume nodes support aur resistance ke strong levels indicate karte hain.
In aqsam ko samajhkar aur unhe trading decisions me shamil karke, traders market trends ko behtar predict kar sakte hain aur apni strategies ko optimize kar sakte hain.
-
FerhanjuttSenior Member
- Oct 2022
- 269
- 4
- 85
- 60 USD
What Is Support and Resistance?
Support
Support ek level hota hai jahan par price ko niche jaane mein mushkil hoti hai. Yeh level par buyers active hote hain aur price ko niche jaane se rokne ki koshish karte hain. Support levels ko identify karne ke liye traders ne chart patterns, technical indicators, aur market sentiment ka use karte hain.
Resistance
Resistance ek level hota hai jahan par price ko upar jaane mein mushkil hoti hai. Yeh level par sellers active hote hain aur price ko upar jaane se rokne ki koshish karte hain. Resistance levels ko identify karne ke liye traders ne chart patterns, technical indicators, aur market sentiment ka use karte hain.
Trading support
Traders Support aur Resistance levels ka use karke apne trading strategies ko develop karte hain. Yeh levels traders ko pata lagane mein madad karte hain ki kahan par price ko buy ya sell karna chahiye.
Identifying
Support aur Resistance levels ko identify karne ke liye traders ne neeche diye gaye tareeke ka use karte hain:
- Chart patterns: Traders chart patterns ko analyze karte hain, jaise ki trend lines, channels, aur support/resistance levels.
- Technical indicators: Traders technical indicators ko use karte hain, jaise ki moving averages, Bollinger Bands, aur RSI.
- Market sentiment: Traders market sentiment ko analyze karte hain, jaise ki traders ki psychology aur market ki expectations.
Conclusion
Support aur Resistance levels traders ke liye ek powerful tool hain, lekin yeh zaroori hai ki traders iske saath-saath other technical aur fundamental analysis tools ka use karein. -
<a href="https://www.instaforex.org/ru/?x=ruforum">InstaForex</a> -
Rehan50Senior Member
- Mar 2024
- 1565
- 148
- 439
- 335 USD
InstaSpot: کسی بھی EPS اور بینک سے منافع واپس لیں، اور EPS اور cryptocurrencies کے تبادلے پر 7% تک کمائیں۔
What Is Support and Resistance?
1. Muqadma
Forex trading, jo ke foreign exchange market ka hissa hai, aik aisi market hai jahan currencies ka tabadla hota hai. Yeh duniya ki sab se bari aur sab se zyada liquidity wali market hai. Is market mein trading karte waqt kai aise factors hain jo price movements ko asar andaz karte hain. In factors mein se support aur resistance ka concept bohot hi ahem hai. Ye concepts traders ke liye raah numai karte hain aur unhein trading decisions mein madad dete hain. Support aur resistance samajhne ke liye aapko price action aur market psychology ka ek asar gosha banana zaroori hai.
2. Support Aur Resistance Ka Taruf
Support aur resistance aise price levels hote hain jahan se price ka movement rok jata hai ya phir ulta hota hai. Ye levels market ke andar existing demand aur supply ki buniyad par bante hain. Support wo level hai jahan demand barh jati hai, aur price neeche girna band kar deti hai. Iske baraks, resistance wo level hai jahan supply zyada ho jati hai, aur price upar jana band kar deti hai. In levels ka pata lagana bohot zaroori hai kyun ke ye market ke future movements ko predict karne mein madadgar hote hain.
3. Support Kya Hai?
Support aik aisa price level hai jahan buyers market mein interested hotay hain aur wo is level par buying shuru kar dete hain. Yeh level traders ke liye bohot important hota hai kyun ke yeh indicate karta hai ke price is level se neeche nahi jayegi, aur yahan se bounce back karegi. Iska matlab yeh hai ke agar price support level par aati hai to ye market ke liye ek bullish signal hota hai, kyun ke yahan se buying pressure barh jata hai. Support level ko aksar pechle lows ke sath link kiya jata hai, ya un points par jahan price pehle halt hui hoti hai.
Support levels ko identify karna asan hota hai agar aap past data ko dekhain. Pechle time frames par dekha gaya ke jab price aik specific level par pohonchti hai to wo neeche girna band kar deti hai. Yeh level phir se future mein support ke tor par kaam kar sakta hai. Aksar, yeh level multiple times test hota hai, aur har dafa buyers yahan se price ko upar le jate hain.
4. Resistance Kya Hai?
Resistance support ka ulat hota hai. Yeh wo level hai jahan sellers zyada active hotay hain aur wo price ko aur upar janay se rok dete hain. Is level par market mein selling pressure barh jata hai, jo price ko neeche le aata hai. Resistance level ko traders ke liye bearish signal mana jata hai, kyun ke yeh indicate karta hai ke price upar janay se ruk gai hai aur wapas neeche aasakti hai.
Resistance levels ko identify karna bhi pechle highs ko dekh kar asan hota hai. Jaise ke support levels, resistance levels bhi past data ke zariye identify kiye jate hain. Agar price aik specific level par multiple times ruki hai, to yeh level future mein resistance ke tor par kaam karega.
5. Support Aur Resistance Ki Ahmiyat
Support aur resistance levels trading mein bohot important hote hain kyun ke yeh levels traders ke liye decision making mein madad karte hain. In levels par trade karne se aap apne risk ko achi tarah manage kar sakte hain. Jab price support level ke qareeb hoti hai, to yeh buying ka acha mauqa hota hai. Aise hi, jab price resistance level ke qareeb hoti hai, to yeh selling ka acha time hota hai.
Iske ilawa, support aur resistance levels market ke trend ko samajhne mein bhi madadgar hote hain. Agar price support level ko tod deti hai, to yeh bearish trend ka signal hota hai. Aur agar price resistance level ko tod deti hai, to yeh bullish trend ka signal hota hai. Yeh levels market ke sentiments aur trader psychology ka bhi izhar karte hain.
6. Support Aur Resistance Ko Kaise Identify Karein?
Support aur resistance levels ko identify karne ke kai tareeqay hain. Sab se aam tareeqa price charts ka analysis karna hai. Aap historical data ka istimaal karke un points ko identify kar sakte hain jahan se price ne pehle reverse kiya tha. Iske ilawa, kai indicators bhi hain jo support aur resistance levels ko identify karne mein madad karte hain.
Moving Averages
aik ahem indicator hai jo support aur resistance ko identify karne mein madadgar hota hai. Jab price moving average ke neeche hoti hai to yeh resistance ka kaam karta hai, aur jab price moving average ke upar hoti hai to yeh support ka kaam karta hai.
Fibonacci Retracement
bhi aik mashhoor tool hai jo support aur resistance levels ko identify karne ke liye use hota hai. Yeh tool past price movements ko dekh kar different levels draw karta hai jo future mein support aur resistance ke tor par kaam karte hain. Fibonacci levels jaise 38.2%, 50%, aur 61.8% bohot ahem hote hain kyun ke yeh points aksar price retracements ke liye hotay hain.
7. Price Action Aur Support/Resistance
Price action trading mein support aur resistance ko samajhna bohot zaroori hota hai. Price action trading ka matlab hai ke aap indicators ka istimaal kam karte hain aur sirf price ke movements ko dekh kar apne trading decisions lete hain. Support aur resistance levels price action trading mein ahem role ada karte hain kyun ke yeh aapko market ke aane wale movements ke bare mein andaza dete hain.
Price action traders aksar candlestick patterns ka istimaal karte hain support aur resistance ko confirm karne ke liye. Jaise ke Doji, Hammer, aur Engulfing Patterns bohot aam hain jo support ya resistance levels par bante hain. In patterns ka istimaal karke aap apne trading decisions ko aur mazboot bana sakte hain.
8. Historical Data Ka Role
Historical data ka forex trading mein bohot bara role hota hai, khaaskar support aur resistance levels ko identify karne mein. Past price movements ko dekh kar aap aasan se un levels ko identify kar sakte hain jahan se price ne pehle reverse kiya tha. Yeh data aapko future mein bhi madad dega ke jab price wapas in levels par aayegi to uska reaction kya hoga.
Aksar traders historical data ka analysis karte hain taake wo aane wale trends aur price movements ka andaza laga saken. Aap daily, weekly, aur monthly charts ko dekh kar support aur resistance levels ko samajh sakte hain. Yeh levels jitni bar test hote hain, utni hi inki importance barh jati hai.
9. Round Numbers Ka Asar
Forex market mein round numbers ka asar support aur resistance levels par bohot ziada hota hai. Round numbers, jaise 1.2000 ya 1.3000, market participants ke zehan mein psychological levels ke tor par set hote hain. In levels par aksar price ruk jati hai ya phir reverse hoti hai.
Traders aksar round numbers ka istimaal trading decisions lete waqt karte hain kyun ke yeh levels psychological barriers ke tor par kaam karte hain. Iska matlab yeh hai ke jab price in numbers ke qareeb hoti hai to market mein buying ya selling pressure barh jata hai, jo price movement ko effect karta hai. Round numbers ko istimaal karte hue aap apne stop-loss aur take-profit levels ko behtar tor par set kar sakte hain.
10. Breakout Strategy
Breakout strategy forex trading mein aik bohot popular strategy hai, jo us waqt use hoti hai jab price support ya resistance level ko tod deti hai. Jab price aik resistance level ko tod kar upar chali jati hai, to yeh bullish breakout kehlata hai. Iska matlab hai ke price ab upar jana shuru karegi. Isi tarah, agar price support level ko tod kar neeche chali jati hai, to yeh bearish breakout hota hai.
Breakout trading mein aapko bohot ehtiyat se kaam lena padta hai. Kyun ke jab price breakout karti hai, to market mein bohot ziada volatility hoti hai. Is waqt aapko apna risk management bohot behtar karna padta hai. Breakout strategy mein aksar traders stop-loss orders ko tight rakhte hain taake wo kisi bhi unexpected movement se bach saken.
11. False Breakouts
Forex trading mein false breakouts bohot aam hote hain. False breakout us waqt hota hai jab price support ya resistance level ko tod kar wapas usi level par aa jati hai. Yeh bohot dangerous hote hain kyun ke yeh traders ko ghalat signal dete hain, jis ki wajah se wo galat direction mein trades open kar lete hain.
False breakouts se bachne ke liye aapko multiple confirmations ka intezar karna chahiye. Jaise ke volume ka analysis karna, candlestick patterns ka istimaal karna, aur different time frames ka analysis karna. Iske ilawa, aap false breakouts se bachne ke liye wait and see approach bhi rakh sakte hain. Matlab yeh ke aap breakout ke baad kuch waqt intezar karein aur dekhein ke price us level ko kitni dair tak maintain kar rahi hai.
12. Trendlines Aur Support/Resistance
Trendlines bhi support aur resistance ka kaam karti hain. Uptrend mein trendline support ka kaam karti hai, aur downtrend mein resistance ka. Trendlines ko draw karne ka tareeqa yeh hai ke aap past price points ko connect karte hain taake aapko market ka overall trend samajh aa sake.
Uptrend mein trendline ko aap support ke tor par samajh sakte hain. Jab tak price is trendline ke upar hoti hai, tab tak market bullish hoti hai. Lekin agar price is trendline ko tod deti hai, to yeh bearish trend ka signal hota hai. Isi tarah, downtrend mein trendline resistance ka kaam karti hai. Jab tak price is trendline ke neeche hoti hai, tab tak market bearish hoti hai. Lekin agar price is trendline ko tod deti hai, to yeh bullish trend ka signal hota hai.
13. Support/Resistance Flip
Support aur resistance flip ek ahem concept hai forex trading mein. Iska matlab yeh hai ke jab support level tod diya jata hai, to wo resistance ban jata hai. Aur jab resistance level tod diya jata hai, to wo support ban jata hai. Yeh flip tab hota hai jab market mein strong price movements hoti hain.
Is concept ko samajhna aapki trading strategy mein bohot madadgar sabit ho sakta hai. Agar aap dekhein ke support level tod kar wapas test ho raha hai, to yeh level ab resistance ban chuka hai. Is waqt selling opportunities ko dhoondna behtar hai. Isi tarah, agar resistance level tod kar wapas test ho raha hai, to yeh ab support ban chuka hai, aur aapko buying opportunities par focus karna chahiye.
14. Indicators Ka Iste'mal
Forex trading mein kai indicators support aur resistance levels ko identify karne mein madadgar hote hain. In indicators ka sahi istimaal aapko trading mein bohot faida de sakta hai.
RSI (Relative Strength Index)
aik mashhoor indicator hai jo support aur resistance ko identify karne mein madadgar hota hai. Jab RSI oversold hota hai (30 ke neeche), to yeh support level ka signal hota hai. Aur jab RSI overbought hota hai (70 ke upar), to yeh resistance level ka signal hota hai.
MACD (Moving Average Convergence Divergence)
bhi aik bohot useful indicator hai jo price momentum ko measure karta hai. Jab MACD lines cross karti hain, to yeh support ya resistance ke asar ko dikhata hai.
Bollinger Bands
bhi aik popular indicator hai jo price volatility ko measure karta hai. Jab price Bollinger Bands ke upper band ko touch karti hai, to yeh resistance ka signal hota hai. Aur jab price lower band ko touch karti hai, to yeh support ka signal hota hai.
15. Support Aur Resistance Ka Time Frame
Different time frames par support aur resistance levels different hote hain. Agar aap long-term trader hain, to aapko weekly ya monthly charts par focus karna chahiye. Long-term charts par jo support aur resistance levels bante hain, wo bohot strong hote hain aur inka todna mushkil hota hai.
Lekin agar aap short-term trader hain, to aapko hourly ya daily charts par focus karna chahiye. Short-term charts par support aur resistance levels weak hotay hain, lekin ye aapko quick trades lene mein madadgar hotay hain. Time frame ka selection aapki trading strategy par mabni hona chahiye. Agar aap scalper hain, to minute charts ka istimaal karna chahiye, jabke swing traders ke liye daily ya weekly charts best hote hain.
16. Supply Aur Demand Ka Taluq
Support aur resistance levels ko samajhne ke liye supply aur demand ka samajhna bohot zaroori hai. Jab market mein demand zyada hoti hai, to support levels strong hotay hain. Jab demand high hoti hai, buyers zyada hotay hain, aur price neeche girne se rok jati hai.
Isi tarah, jab market mein supply zyada hoti hai, to resistance levels strong hotay hain. Supply ke barh jane se sellers market mein dominant hotay hain, aur price upar janay se ruk jati hai.
Supply aur demand ke concept ko samajh kar aap support aur resistance levels ko behtar tor par identify kar sakte hain. Market ki dynamics ko samajhne se aap apni trading strategy ko mazid behtar bana sakte hain.
17. Support Aur Resistance Ki Weakness
Har support aur resistance level mazboot nahi hota. Kisi bhi level ka bar bar test hona uski weakness ko show karta hai. Agar price baar baar aik specific support ya resistance level ko test kar rahi hai, to iska matlab hai ke ye level ab tootne wala hai.
Aise weak levels par aapko trading decisions lete waqt ehtiyat se kaam lena chahiye. Aksar, jab aik level multiple times test hota hai, to market participants ke confidence mein kami aati hai, aur ye level eventually break ho jata hai.
Aapko apne trades ko adjust karna chahiye agar aapko lagta hai ke support ya resistance level weak ho raha hai. Is waqt aapko tight stop-loss rakhna chahiye aur breakout strategies par focus karna chahiye.
18. Trading Plan Mein Support Aur Resistance
Aapke trading plan mein support aur resistance ko shamil karna zaroori hai. Ye levels aapko trade entry aur exit points decide karne mein madad karte hain.
Jab aap apne trading plan ko banate hain, to aapko support aur resistance levels ko madde nazar rakh kar apne stop-loss aur take-profit levels ko set karna chahiye. Isse aapka risk management mazid behtar ho jata hai, aur aap apne losses ko minimize kar sakte hain.
Support aur resistance levels ko trading plan mein shamil karne se aapko trading confidence milta hai, kyun ke aap market ki dynamics ko samajh kar apni trades place karte hain.
19. Nateejah
Support aur resistance levels ka samajh forex trading mein bohot zaroori hai. In levels ko samajh kar aap apne trading decisions ko behtar bana sakte hain. Ye levels aapko market ke trends ko samajhne mein madadgar hote hain, aur aapko trading confidence dete hain.
Is article ne aapko support aur resistance ke different aspects ke bare mein tafseel se bataya hai, jisme inko identify karne ke tareeqay, inki ahmiyat, aur in par trading strategies shamil hain. Agar aap in concepts ko achi tarah samajh kar apni trading strategy mein implement karte hain, to aapke munafa ke chances barh jate hain. Forex trading mein success ka daromadar sirf market movements par nahi, balki in movements ko samajhne aur in par sahi waqt par sahi decisions lene par hai.
اب آن لائن
Working...
تبصرہ
Расширенный режим Обычный режим