support or resistance in forex trading
X
  • وقت
  • دکھائیں
Clear All
new posts
  • #1 Collapse

    support or resistance in forex trading
    Introduction

    forex market mein support or resistance aik technical analysis ka chart pattern hota hey jes ko trader market kay trend ko reversal janay ko he identify kar sakta hey or forex market ke mumkana tabdele ka andaza laganay kay ley estamal keya ja sakta hey or forex market mein support or resistance ka estamal price ke important level hote hey
    support or resistance ka estamal forex trading mein he allow kar deya jata hey jes mein forex market kay mumkana reversal trend ko he jare rakh deya jata hey identification support or resistance kay sath he mel sakte hey

    what is support forex market

    orex market mein support say morad price kewoh level hote hey jes par demand itni strong hote hey jes ke wajah say price nechay ke taraf gerna start ho jate hey or jab stock ke price support say nechay ke taraf gerna start kar dayte hey
    or forex market mein imdad kay area ko identify karnay kay kame ke price ko he talash karna chihay forex market min support aik nafseyat ke level ko he indicate kr sakta hey technical trader mumkana imdad ko indicate karnay mumkana tabdele ko he indicate kar sakta hey strong support ke level fresh ke he level hote hey

    what is resistance in forex market

    forex market mein resistance price ke woh level hote hey jo keh forex market kay kese stock mein price ke he supply ke jate hey takehkese up trend ko stop keya ja sakta hey jaisay jaisay stock ke price resistance ke level tak chale jate hey or seller stock mein step he rakh saktay hein or forex market mein resistance ke level es bat he identify kar sakte hey keh investor ko stock ke zyada say zyada prices ko daikha ja sakta hey price kay chart ka analysis kar kay price ke level ko he daikha ja sakta hey stock kai chance say wapes nechay ke taraf ger jata hey

    Understanding support or resistance

    forex market mein support or resistance ko samjhnay kay bad trader ko mumkana trade ko identify karnay ke zaroorat hote hey entry or exit kay raston ko he tay kar deya jata hey stop loss or take profit ke level mein entry or exit kay raston ko he indicate kar deya jata hey or forex market mein trend mein tabdele ke taraf khas pata chalta hey
    support or resistance es area ko he indicates keya ja sakta hey keh forex market mein buyer ke taraf say price mazeed nechay ke taraf he ger jate hey or forex market ke kafe demand honay ko he indicate keya ja sakta hey resistance ke level seller kund gan ko sahi frahme ke ja sakte hey price kay es kesam kay sahi point ko operke janab stop keya ja sakta hey

    Pehchan support or resistance
    Click image for larger version

Name:	How-to-identify-support-resistance-levels-1024x640.jpg
Views:	47
Size:	106.7 کلوبائٹ
ID:	12916025

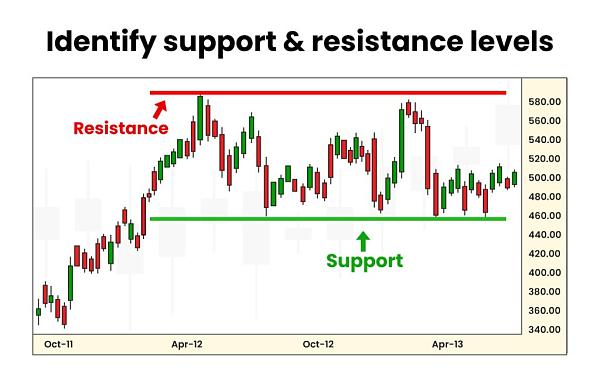
    support or resistance ke pehchan ap ope walay chart ko daikh karhe kar saktay ho jahan par tock ke price oper walay chart ko ochal choke hote hey or forex market mein jen area kay aik say zyada touch ko daikha ja sakta hey support k level woh area hote hey jen say price ko stop keya ja sakta hey resistance ka area woh area hota hey jaha par price ko stop keya jata hey or mazeed stop karnay kay demand mein ezafa ho jata heyor forex market mein price ko stop karnay kay ley limit kay torpar kam kar sakte hey
    forex market mei technically tor par support or resistance ko he identify keya ja sakta hey jes ko higher lower level ya lower high kay sath jora jata hey jes ko moving average ya trend line he forex chart par draw keya ja sakta hey aik bar forex chart par identify honay kay bad en level ko identify keya ja sakta hey ya phir break keya jata hey or market kay sath tabdele ko support or resistance ko he identify keya ja sakta hey

    support or resistance draw karna
    Click image for larger version

Name:	How-to-draw-support-resistance-levels-1024x640.jpg
Views:	43
Size:	115.4 کلوبائٹ
ID:	12916026
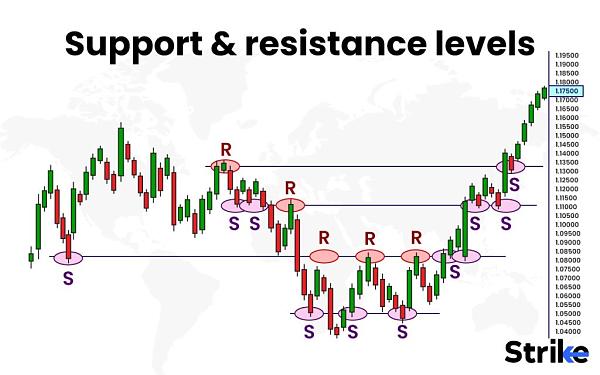
    oper ap forex market kay chart ko he daikh saktay hein keh yeh forex market mein kes tarah say pehchan hota hey or draw kar deya jata hey aik period kay doran forex market mein stock ke price ko daikha ja sakta hey forex market ke price ko barhta or gerta daikh saktay hein or forex market mein support ya resistance ke janch k ja sakte hey en points par strong support bante hey jahan par price zyada imit kay tor par kam kar sakte hey jahan par stock ke demand ko mazeed gernay say stop kar deya jata hey
    trader support level ko talash karnay kay ley en area ko talash karnay ke zaroorat hote hey ya phir resistace ke lvel ko talash karna chihay
    khatot ko otwar kar deya jata hey jen area mein prices kay kai touch ka estaal kar deya jata hey en ko strong level he samjha jata hey
    bhali kay badlay bhali
  • <a href="https://www.instaforex.org/ru/?x=ruforum">InstaForex</a>
  • #2 Collapse

    Forex trading ek dynamic aur volatile market hai jahan price movements ki har waqt changing dynamics hoti hain. Ismein trading karte waqt, support aur resistance levels ka concept samajhna aur unka istemal karna traders ke liye behad zaroori hai. Ye levels market ke trends ko identify karne aur trading decisions ko validate karne mein madad karte hain.Support aur resistance levels market mein price action ko interpret karne ka ek asan tareeqa provide karte hain. Support level woh price point hota hai jahan se price ki downward movement ko roka jata hai, jabke resistance level woh price point hota hai jahan se price ki upward movement ko roka jata hai. In levels ko identify kar ke traders market ke future direction ka estimate kar sakte hain.
    Market mein price ka movement ek wave-like pattern follow karta hai, jahan price ek particular direction mein move karta hai phir uski direction change hoti hai. Jab price ek particular level tak pahunchta hai, jaise ki support ya resistance level, to traders ko market ke potential reversals ka pata lag jata hai. Agar price support level tak pahunchta hai aur waha se bounce back karta hai, to ye ek bullish signal hai. Isi tarah, agar price resistance level tak pahunchta hai aur waha se reversal hota hai, to ye ek bearish signal hai. In signals ko samajh kar, traders apni trading strategies ko adjust kar sakte hain.

    Support aur Resistance Ka Importance

    Support aur resistance levels ka importance trading mein behad ahmiyat rakhta hai. Ye levels traders ko market ke trends aur reversals ke bare mein insights dete hain. Inka istemal kar ke traders apni trading strategies ko refine kar sakte hain aur better entry aur exit points tay kar sakte hain.
    Support aur resistance levels ke importance ko samajhna trading ke mukhya hisson mein se ek hai. Ye levels market ke psychological dynamics ko reflect karte hain aur traders ko market sentiment ka ek idea dete hain. Jab price ek support level tak pahunchta hai, to waha ke traders mein buying pressure create hoti hai jisse price ko upar ki taraf push kiya jata hai. Jab price ek resistance level tak pahunchta hai, to selling pressure create hoti hai jisse price ko niche ki taraf push kiya jata hai. In dynamics ko samajh kar, traders apne trading decisions ko support aur resistance levels ke hisab se adjust kar sakte hain.

    Support aur Resistance Ki Identifying

    Support aur resistance levels ko identify karne ke liye traders different tools aur techniques ka istemal karte hain. Kuch common methods mein include hain trend lines, Fibonacci retracements, aur pivot points. In techniques ka combination kar ke traders accurate support aur resistance levels tay kar sakte hain.Trend lines ek popular technique hai support aur resistance levels ko identify karne ke liye. Traders trend lines draw karte hain jo price ke key points ko connect karte hain, jaise ki lows ko connect karne wali trend line support level create karti hai aur highs ko connect karne wali trend line resistance level create karti hai. Fibonacci retracements bhi ek powerful tool hai support aur resistance levels ko identify karne ke liye. Fibonacci retracements ko use kar ke traders price ke recent swing highs aur lows ko measure karte hain aur fir Fibonacci ratios ko apply kar ke potential support aur resistance levels tay karte hain. Pivot points bhi support aur resistance levels ko determine karne mein madadgar hote hain. Pivot points ek mathematical formula based technique hai jo traders ko potential support aur resistance levels provide karta hai based on previous day’s high, low, aur close prices.

    Support aur Resistance Ka Istemal

    Support aur resistance levels ka istemal kar ke traders apni trading decisions ko validate aur confirm kar sakte hain. Agar price support level se bounce back karta hai, to ye ek bullish signal hai aur traders long positions le sakte hain. Similarly, agar price resistance level ko break karta hai, to ye ek bearish signal hai aur traders short positions le sakte hain.Support aur resistance levels ka istemal karne ke liye traders ko market ke overall context ko bhi consider karna zaroori hai. Agar market strong uptrend mein hai aur price ek support level tak pahunchta hai, to waha se bounce back ki probability zyada hoti hai. Isi tarah, agar market strong downtrend mein hai aur price ek resistance level tak pahunchta hai, to waha se reversal ki probability zyada hoti hai. Traders ko confirmatory signals aur other technical indicators ka bhi istemal karna chahiye support aur resistance levels ke sath saath.

    Support aur Resistance Ke Challenges

    Support aur resistance levels ka istemal karne mein kuch challenges bhi hote hain. Sometimes, market mein false breakouts hoti hain jahan price support ya resistance level ko temporarily break karta hai, magar phir se wapas aa jata hai. Isliye, traders ko confirmatory signals aur other technical indicators ka bhi istemal karna zaroori hai.False breakouts se bachne ke liye, traders ko ek confirmatory signal ka wait karna chahiye support aur resistance levels ke pass entry aur exit points tay karte waqt. Confirmatory signals mein include hote hain candlestick patterns, price action setups, aur other technical indicators jaise ki RSI (Relative Strength Index) ya MACD (Moving Average Convergence Divergence). Ye signals traders ko false breakouts se bachane mein madad karte hain aur unhein accurate trading decisions lene mein help karte hain.

    Risk aur Reward Ka Consideration

    Support aur resistance levels ka istemal kar ke traders apne trades ke liye risk aur reward ka balance maintain kar sakte hain. Agar price kareeb support level aa gaya hai, to traders apne stop loss orders ko thoda sa neeche set kar sakte hain, jisse unka risk minimize ho jayega. Isi tarah, agar price resistance level ke paas pahunchta hai, to traders apne take profit orders ko waha set kar sakte hain, jisse unka reward maximize ho jayega.Risk aur reward ka consideration karna trading ke ek critical aspect hai. Agar traders apne trades ke liye sahi risk aur reward ratio maintain nahi karte hain, to unka trading performance suffer kar sakta hai. Support aur resistance levels ka istemal kar ke, traders apne stop loss aur take profit levels ko strategically set kar sakte hain jisse unka risk aur reward balance maintain ho.

    Conclusion: Support aur Resistance Ka Istemal

    Support aur resistance levels forex trading mein ek powerful tool hain jo traders ko market ke movements ko samajhne mein madad karta hai. In levels ko effectively identify aur istemal kar ke traders apni trading strategies ko improve kar sakte hain aur consistent profits earn kar sakte hain. Magar, support aur resistance levels ke saath saath aur bhi factors ko consider karna important hai, jaise ki market sentiment, fundamental analysis, aur risk management. Overall, support aur resistance levels ek integral part hain har trader ke trading arsenal ka. Traders ko in levels ka sahi tarah se istemal karna seekhna chahiye taake wo successful aur profitable trading kar sakein.


    • #3 Collapse

      Support or resistance in forex trading

      Forex trading, ek shauq hai ya ek serious business, kisi bhi trader ke liye, price movement ka ek essential part hota hai. Price ka trend analysis karna, future ke movements ko predict karne ke liye crucial hota hai. Yeh analysis karne ke liye traders support aur resistance levels ka istemal karte hain.

      Support aur resistance levels, ek particular currency pair ke price movements ke significant points hote hain. In points ko identify karke, traders market trends ka pata lagate hain aur apne trading strategies ko uss ke mutabiq adjust karte hain.

      Support aur Resistance:
      1. Support (Sahara): Support level, woh price point hota hai jahan se currency pair ka price gir kar phir se upar aane ki possibility hoti hai. Yeh level aksar traders ke liye ek safety net ki tarah kaam karta hai. Agar price support level tak gir jata hai, toh wahan se price ka rebound hone ka chance hota hai.
      2. Resistance (Rokawat): Resistance level, woh price point hota hai jahan se currency pair ka price upar ja kar girne ki possibility hoti hai. Yeh level traders ke liye ek point of caution hota hai. Agar price resistance level tak pahunch jata hai, toh wahan se price ka downward movement hone ka chance hota hai.

      Support aur Resistance ka Importance:
      1. Trend Analysis: Support aur resistance levels ko dekh kar, traders market ke trend ka analysis karte hain. Agar price support level ke pass hai aur wahan se rebound kar raha hai, toh yeh bullish trend ka indication ho sakta hai. Wahi agar price resistance level ke pass hai aur wahan se gir raha hai, toh yeh bearish trend ka indication ho sakta hai.
      2. Entry aur Exit Points: Support aur resistance levels ko dekh kar, traders apne entry aur exit points decide karte hain. Agar price support level ke pass hai aur wahan se rebound hone ka indication hai, toh traders buy kar sakte hain. Aur agar price resistance level ke pass hai aur wahan se downward movement hone ka indication hai, toh traders sell kar sakte hain.
      3. Stop Loss aur Take Profit Levels: Support aur resistance levels ko dekh kar, traders apne stop loss aur take profit levels decide karte hain. Agar price support level ke pass hai, toh traders apna stop loss support level ke thode neeche rakh sakte hain. Aur agar price resistance level ke pass hai, toh traders apna take profit level resistance level ke paas rakh sakte hain.

      Conclusion: Forex trading mein support aur resistance levels ka istemal karna, ek trader ke liye bahut zaroori hai. Yeh levels market trends ko samajhne aur trading strategies ko design karne mein madad karte hain. Lekin yaad rahe, support aur resistance levels ke alawa bhi market mein aur factors hote hain jo price movements ko influence karte hain, isliye ek holistic approach ke saath in levels ko consider karna important hai.
      • #4 Collapse

        Forex Trading Mein Support aur Resistance: Ek Tafsili Jaiza

        Forex trading mein, support aur resistance levels ka istemal karke traders apni trading strategies ko taqwiyat dete hain. Yeh levels market ke movements ko samajhne aur trade karne mein madadgar sabit hote hain. Is article mein, hum support aur resistance ke mukhtalif pehluon par ghaur karenge.

        1. Support aur Resistance: Bunyadi Tareeqay

        Forex trading mein support aur resistance levels ko samajhna zaroori hai. Support level, jahan price girne se rokta hai, aur resistance level, jahan price barhne se rukta hai, ko darust taur par pehchanna zaroori hai.

        Support aur resistance levels ko identify karne ke liye traders chart analysis ka istemal karte hain. Price action, chart patterns, Fibonacci retracement aur moving averages jaise tools ka istemal kiya jata hai taake levels ko mark kiya ja sake. Yeh levels market ke key turning points hote hain, jo traders ke liye entry aur exit points ke tor par kaam karte hain.

        2. Fibonacci Retracement ki Ahmiyat

        Fibonacci retracement levels ka istemal karke traders market mein support aur resistance levels ko mark karte hain. Fibonacci retracement ek mathematical concept hai jo price ke natural retracements ko identify karta hai.

        Fibonacci retracement levels ko calculate karne ke liye, traders high aur low points ko reference points ke tor par lete hain aur phir Fibonacci ratios (jaise ki 23.6%, 38.2%, 50%, 61.8%, aur 100%) ko istemal karke retracement levels ko draw karte hain. In levels ko mark karne se traders ko potential reversal zones ka pata chalta hai, jahan price ka trend change ho sakta hai.

        3. Chart Patterns aur Support/Resistance

        Chart patterns, jaise ki head and shoulders, triangles, aur rectangles, bhi support aur resistance levels ko confirm karne mein madadgar sabit hote hain. In patterns mein price ka behavior specific shapes mein hota hai, jo traders ko future price movements ke liye hint dete hain.

        Head and shoulders pattern mein, for example, ek price peak (head) ke do sides mein ek se zyada lower peaks (shoulders) hote hain. Neckline ke break ke baad, price usually downward direction mein move karta hai, indicating a potential trend reversal. Traders in patterns ko dekh kar support aur resistance levels ko identify karte hain aur un par trading decisions lete hain.

        4. Pivot Points aur Unki Ahmiyat

        Pivot points bhi support aur resistance levels ko calculate karne ka aik aham tareeqa hain. Pivot points market ke previous day's high, low, aur close prices se calculate kiye jate hain aur unke around multiple support aur resistance levels ko mark kiya jata hai.

        Pivot points ke levels ko calculate karne ke liye, traders pivot point formula ka istemal karte hain. In levels ko samajh kar traders ko market ka overall sentiment aur potential turning points ka pata chalta hai. Traders pivot points ko daily, weekly, aur monthly charts par istemal karte hain taake short-term aur long-term trends ko analyze kar sakein.

        5. Moving Averages ke Istemal

        Moving averages bhi support aur resistance levels ko identify karne mein madadgar sabit ho sakte hain. Moving averages market ke average price ko calculate karte hain aur is tarah ke indicators ko istemal karke traders price ke trends aur reversals ko identify kar sakte hain.

        Traders moving averages ko different time periods par set karte hain, jaise ki 50-day, 100-day, aur 200-day moving averages. Jab price moving average ke upar ya neeche se cross karti hai, yeh ek potential buy ya sell signal provide karta hai. Moving averages ke cross points ko support aur resistance levels ke roop mein dekha jata hai, jo traders ke liye entry aur exit points ke roop mein kaam karte hain.

        6. Psychological Levels

        Psychological levels, jaise ki round numbers (jaise ki 1.2000, 1.2500, 1.3000, etc.), bhi support aur resistance ke tor par kaam karte hain. In levels ko traders often observe karte hain kyun ke traders kaafi baar round numbers par orders place karte hain.

        Round numbers ka istemal karke traders price movements ko samajhte hain aur unke around support aur resistance levels ko identify karte hain. Jab price round number par approach karta hai, traders ki demand aur supply mein changes hoti hai, jo price ke movements ko influence karta hai.

        7. Breakouts aur Fakeouts

        Breakouts aur fakeouts, jab price support ya resistance level ko cross karta hai, traders ke liye important signals hote hain. Breakout hota hai jab price support ya resistance level ko cross karta hai aur new trend shuru hota hai.

        Traders breakout ko confirm karne ke liye volume analysis aur price action ka istemal karte hain. Fakeout hota hai jab price briefly support ya resistance level ko cross karta hai lekin phir wapas us level ke andar reverts ho jata hai. Traders ko fakeouts se bachne ke liye stop loss orders ka istemal karte hain aur price ke movements ko closely monitor karte hain.

        8. Multiple Time Frame Analysis

        Multiple time frame analysis ka istemal karke traders support aur resistance levels ko confirm kar sakte hain. Is tareeqe mein, traders different time frames par charts ko analyze karte hain taake overall trend aur support/resistance levels ko identify kar sakein.

        Traders typically short-term aur long-term time frames dono par analysis karte hain. Short-term time frames par entry aur exit points ko confirm karne ke liye aur long-term time frames par overall trend ko samajhne ke liye istemal kiya jata hai. Multiple time frame analysis karke traders ko zyada behtareen trading decisions lene mein madad milti hai.

        9. Volume Analysis ki Ahmiyat

        Volume analysis bhi support aur resistance levels ko confirm karne mein madadgar hota hai. Volume market mein trading activity ko measure karta hai aur high volume levels usually indicate stronger support or resistance.

        Jab price support level ke neeche ya resistance level ke upar move karta hai aur volume bhi us direction mein increase hota hai, yeh ek confirmation signal provide karta hai. Traders volume ke saath support aur resistance levels ko dekhte hain taake market sentiment aur price movements ko samajh sakein.

        10. Price Action aur Support/Resistance

        Price action analysis support aur resistance levels ko samajhne ka aham tareeqa hai. Price action traders ko market ke current aur historical price movements ko analyze karne ki ijazat deta hai.

        Price action mein, traders price ke movements ko dekhte hain aur patterns, candlestick formations, aur price movements ke based par trading decisions lete hain. Support aur resistance levels ko mark karne ke liye, traders price ke reactions ko samajhte hain jab price levels ko touch karta hai ya cross karta hai.

        11. News Events aur Support/Resistance

        News events, jaise ki economic reports ya geopolitical developments, bhi support aur resistance levels ko influence kar sakte hain. Jab important news announcements hoti hain, market mein volatility barh jati hai aur support/resistance levels ko break karne ka zyada chance hota hai.

        Traders ko in events par nazar rakhni chahiye aur unke impact ko samajhne ke liye fundamental analysis ka istemal karna chahiye. News events ke waqt, support aur resistance levels par zyada careful trading ki zaroorat hoti hai taake losses ko minimize kiya ja sake.

        12. Trendlines aur Unka Istemal

        Trendlines support aur resistance levels ko identify karne mein madadgar hote hain. Trendlines ko draw karke traders price ke trend ko analyze karte hain aur potential support aur resistance levels ko mark karte hain.

        Upar ki taraf sloping trendlines ko resistance ke tor par dekha jata hai, jabke neeche ki taraf sloping trendlines ko support ke tor par dekha jata hai. Jab price trendline ko cross karta hai, yeh ek potential trend reversal signal provide karta hai. Traders trendlines ko istemal karke future price movements ko anticipate karte hain.

        13. Time of Day ka Impact

        Time of day bhi support aur resistance levels par asar daal sakta hai. Different trading sessions mein levels ka behaviour alag hota hai aur traders ko is baat ka khayal rakhna chahiye.

        Jab market open hota hai, volatility usually zyada hoti hai aur support aur resistance levels ko break karne ka zyada chance hota hai. Jab market close hota hai, volume kam ho jata hai aur price movements bhi stabilize ho jate hain. Traders ko market ke different times par levels ka behavior observe karna chahiye taake unko behtar trading decisions lene mein madad milti hai.

        14. Risk Management aur Support/Resistance

        Risk management ke liye support aur resistance levels ka istemal karna zaroori hai. Stop loss aur take profit levels ko set karte waqt in levels ka khayal rakhna chahiye taake traders apne trades ko effectively manage kar sakein.

        Stop loss levels ko set karte waqt, traders usually support aur resistance levels ko consider karte hain taake losses ko minimize kiya ja sake. Take profit levels ko set karte waqt bhi traders support aur resistance levels ka istemal karte hain taake profits ko maximize kiya ja sake.

        15. Sabar aur Istiqamat

        Forex trading mein successful honay ke liye sabar aur istiqamat zaroori hai. Support aur resistance levels ko samajhne aur unka sahi istemal karne ke liye patience ki zaroorat hoti hai.

        Traders ko hamesha market ko carefully observe karna chahiye aur trading decisions ko carefully analyze karna chahiye. Sabar aur istiqamat ke saath support aur resistance levels ka istemal karke traders apni trading performance ko behtar banate hain aur consistent profits earn karte hain.

        In mukhtalif tajziyat se saabit hota hai ke support aur resistance levels forex trading mein mukhtalif strategies ke liye ahem hote hain. Traders ko in levels ko samajh kar unka sahi istemal karna chahiye taake unki trading performance behtar ho sake.
        • #5 Collapse

          Forex trading mein support aur resistance levels price action analysis ka ek important concept hai. Ye levels market mein price movement ke dynamics ko samajhne aur trading decisions ke liye crucial hote hain.
          1. Support (Samarthan):
            • Support level ek price point ya area hai jahan se price neeche girta hai aur fir se rise shuru karta hai.
            • Ye level typically traders ka interest hota hai kyunki is level par buying pressure zyada hoti hai aur sellers ki activity kam hoti hai.
            • Support level ko jab price touch karta hai, toh traders expect karte hain ki price wapas upar jaayegi, aur is level par buying ya long positions enter karte hain.
          2. Resistance (Pratirodh):
            • Resistance level ek price point ya area hai jahan se price upar jaakar ruk jaati hai ya gir jaati hai.
            • Ye level typically traders ka interest hota hai kyunki is level par selling pressure zyada hoti hai aur buyers ki activity kam hoti hai.
            • Resistance level ko jab price touch karta hai, toh traders expect karte hain ki price neeche jaayegi, aur is level par selling ya short positions enter karte hain.
          Support aur resistance levels ko identify karne ke liye traders previous price action ko analyze karte hain, jaise ki previous swing highs aur lows, price bounces, aur price consolidation areas. Technical indicators jaise ki trend lines, moving averages, Fibonacci retracements bhi support aur resistance levels ko identify karne mein madadgar ho sakte hain. Support aur resistance levels market mein psychological levels bhi hote hain, jahan traders ka zyada focus hota hai. In levels ko samajhkar aur unko sahi tareeke se istemal karke traders apne trading decisions ko improve kar sakte hain.
          • #6 Collapse

            Support and Resistance Purpose.
            Forex trading mein support aur resistance ki baat aati hai to yeh trading ke liye bohot ahem hota hai. Yeh dono concepts traders ko market movements ko samajhne mein madad karte hain strategy ko smaj ker hi trading kerni chahiye or is ko ignore nahi krna chahiye.

            Click image for larger version

Name:	images (19).jpeg
Views:	46
Size:	17.7 کلوبائٹ
ID:	12916080
            Support.

            Support market mein aik level hota hai jahan se price girne ke baad phir se upar uthta hai. Yeh level traders ke liye bohot important hota hai kyunki yeh level market ka bottom hota hai aur is se price ka upar jane ka trend shuru hota hai.

            Resistance.

            Resistance market mein aik level hota hai jahan se price upar jane ke baad phir se neeche ata hai. Yeh level traders ke liye bohot important hota hai kyunki yeh level market ka top hota hai aur is se price ka neeche jane ka trend shuru hota hai.

            Click image for larger version

Name:	images (15).png
Views:	48
Size:	9.4 کلوبائٹ
ID:	12916081
            Support and Resistance Role.

            Support aur resistance levels traders ko market trends ke bare mein information dete hai. Agar price support level se neeche jata hai to market bearish trend mein hai aur agar price resistance level se upar jata hai to market bullish trend mein hai.

            Click image for larger version

Name:	images (16).png
Views:	49
Size:	10.3 کلوبائٹ
ID:	12916082
            Traders support aur resistance levels ko price action aur technical analysis ke zariye determine karte hai. Support aur resistance levels ka use traders ko market mein trades ko enter aur exit karne mein madad karta hai.

            More Important.

            Support aur resistance levels forex trading mein bohot important hai kyunki yeh traders ko market trends ke bare mein information dete hai. Traders in levels ko use kar ke trading strategies banate hai aur market movements ko samajhte hai.


            • #7 Collapse

              Support or resistance in forex trading

              Forex trading mein "support" aur "resistance" do ahem concepts hain jo ke traders ke liye bohot zaroori hote hain. Ye concepts market analysis mein istemal hotay hain aur traders ko market trends ko samajhne mein madad karte hain. Chaliye in dono concepts ko detail se samjhte hain.
              1. Support (Sath):

              Support wo price level hota hai jahan par traders expect karte hain ke market ki price girne ke baad ruk jaye gi aur phir se upar ki taraf chali jaye gi. Ye aksar aik psychological level hota hai jahan par traders khareedne ka faida samajhte hain. Support level ko aam tor par previous lows, price patterns, aur moving averages ki madad se determine kiya jata hai.

              Jab market ki price support level tak gir jati hai, toh wahan se traders expect karte hain ke price upar jaayegi, is liye woh wahan se buy orders place karte hain. Agar price support level se neeche jaati hai, toh yeh indicate karta hai ke market mein downward trend shuru ho sakta hai.
              1. Resistance (Rukawat):

              Resistance wo price level hota hai jahan par traders expect karte hain ke market ki price upar jane ke baad ruk jaye gi aur phir se neeche ki taraf mud jaye gi. Ye bhi aksar aik psychological level hota hai jahan par traders bechna munasib samajhte hain. Resistance level ko aam tor par previous highs, price patterns, aur moving averages ki madad se determine kiya jata hai.

              Jab market ki price resistance level tak pohanchti hai, toh wahan se traders expect karte hain ke price neeche jaayegi, is liye woh wahan se sell orders place karte hain. Agar price resistance level ko paar kar leti hai, toh yeh indicate karta hai ke market mein upward trend shuru ho sakta hai.

              In dono concepts ka istemal karke, traders market trends ko samajhne aur trading decisions banane mein madad lete hain. Support aur resistance levels ko samajh kar, traders apni entry aur exit points tay kar sakte hain aur risk ko minimize kar sakte hain.

              Akhri alfaaz mein, support aur resistance forex trading mein bohot ahem hain aur inka istemal traders ke liye zaroori hai. Lekin, yeh sirf ek tool hain aur traders ko mazeed analysis aur research ki zarurat hoti hai trading decisions banane ke liye.
              • #8 Collapse

                Support & Resistance in Forex Trading

                Forex trading mein "support" aur "resistance" terms buhat ahem hote hain. Yeh dono concepts market analysis mein istemal hote hain aur traders ko market movements ko samajhne mein madad karte hain. Chaliye, hum in concepts ko Roman Urdu mein samjhte hain.

                **Support (سپورٹ):**
                Support ek level hai jahan traders expect karte hain keh asset ka price neeche nae jaaye. Yeh level aksar aise points par hota hai jahan traders ko lagta hai keh asset ka price neeche gir chuka hai aur ab wo price ko support kar raha hai. Jab market mein asset ka price support level tak girta hai aur phir wapas ooper chala jata hai, toh isay support level kehlaya jata hai.

                Support level ko samajhne ke liye, traders previous price movements aur trading volumes ka analysis karte hain. Agar price ek specific level tak aksar gir kar wapas ooper chali jati hai, toh wo level support level kehlata hai.

                Support level ka istemal traders price ko analyze karne mein karte hain. Agar price support level tak gir chuki hai aur wahan se wapas ooper chal rahi hai, toh traders support level par buy positions lete hain, ummeed rakhte hain ke price wapas ooper chalegi.

                **Resistance (رزسٹنس):**
                Resistance level woh point hota hai jahan traders ko lagta hai keh asset ka price neeche jaane se rokta hai. Yeh level aksar aise points par hota hai jahan traders ko lagta hai keh asset ka price ooper ja chuka hai aur ab wo price ko resist kar raha hai. Jab market mein asset ka price resistance level tak pahunchta hai aur phir wahan se neeche aata hai, toh isay resistance level kehlata hai.

                Resistance level ko samajhne ke liye, traders previous price movements aur trading volumes ka analysis karte hain. Agar price ek specific level tak aksar ja kar wahan se neeche aati hai, toh wo level resistance level kehlata hai.

                Resistance level ka istemal traders price ko analyze karne mein karte hain. Agar price resistance level tak pahunch chuki hai aur wahan se neeche ja rahi hai, toh traders resistance level par sell positions lete hain, ummeed rakhte hain ke price neeche jaayegi.

                **Support aur Resistance ka Role:**
                Support aur resistance levels ka pata lagana traders ke liye market trends aur price movements ko samajhne mein madad karta hai. In levels ko analyze karke traders apne trading strategies banate hain aur decision lete hain ke kab buy ya sell positions leni chahiye. Yeh levels market mein stability aur predictability ko bhi enhance karte hain, jiski wajah se traders apne trades ko manage karne mein asani hoti hai.

                Overall, support aur resistance levels forex trading mein crucial hote hain aur inko samajh kar traders apne trading decisions ko improve kar sakte hain.
                • #9 Collapse

                  1. Introduction (Mutarif):

                    Forex trading ek mukhtalif aur dilchasp duniya hai, jahan traders currencies ko khareedte aur bechte hain. Support aur resistance dono hi ahem mawaad hain jo traders ke liye crucial hote hain. Support aur resistance levels market ke dynamics ko samajhne aur trading decisions ko better banana mein madadgar sabit ho sakte hain. Is article mein, hum support aur resistance ke matalib, types, importance, aur inka istemal forex trading mein tafseel se samjheinge.
                  2. Support aur Resistance Ki Ahmiyat (Importance):

                    Support aur resistance trading mein ek bunyadi hissa hain jo traders ko prices ka trend samajhne mein madad karta hai. Yeh levels market ke behavior aur momentum ko samajhne mein help karte hain. Support aur resistance levels trading decisions ko guide karte hain aur traders ko entry aur exit points ke liye directions dete hain.

                    Jab price support level tak pohanchti hai, traders expect karte hain ke price wahan se upar ja sakti hai, jabke resistance level tak pohanchne par traders price ke neeche jaane ka expectation rakhte hain. Yeh expectations traders ke behavior ko influence karte hain aur market ke psychology ko samajhne mein madad karte hain.
                  3. Support Kya Hai? (What is Support?):

                    Support ek level hai jahan traders ko lagta hai ke price girne ke baad rukawat aa sakti hai. Yeh ek area hai jahan buyers active ho sakte hain aur prices ko upar le ja sakte hain. Support level ko usually price ke neeche define kiya jata hai, aur jab price support level tak pohanchti hai, traders expect karte hain ke price wahan se reverse hoga.

                    Support levels multiple factors se define ho sakte hain, jaise ki historical price levels, moving averages, aur Fibonacci retracement levels. Support level ke neeche ki movement ko dekhte hue traders apni trading strategies ko plan karte hain.
                  4. Resistance Kya Hai? (What is Resistance?):

                    Resistance ek level hai jahan traders ko lagta hai ke price barhne ke baad rukawat aa sakti hai. Yeh ek area hai jahan sellers active ho sakte hain aur prices ko neeche le ja sakte hain. Resistance level ko usually price ke upar define kiya jata hai, aur jab price resistance level tak pohanchti hai, traders expect karte hain ke price wahan se reverse hoga.

                    Resistance levels bhi multiple factors se define ho sakte hain, jaise ki previous price highs, trendlines, aur Fibonacci extension levels. Resistance level ke upar ki movement ko dekhte hue traders apni trading strategies ko design karte hain.
                  5. Support aur Resistance Ke Kaise Kaam Karte Hain? (How do Support and Resistance Work?):

                    Support aur resistance levels market psychology aur supply/demand dynamics ko reflect karte hain. Jab price support ya resistance level tak pohanchti hai, traders expect karte hain ke price wahan se revers karega.

                    Support level par price girne ke baad buyers active ho sakte hain aur price ko upar le ja sakte hain, jabke resistance level par price barhne ke baad sellers active ho sakte hain aur price ko neeche le ja sakte hain. Yeh dynamics market ke participants ke sentiment aur expectations ko reflect karte hain.
                  6. Support aur Resistance Ke Types (Types of Support and Resistance):

                    Support aur resistance levels alag-alag types ke hote hain jaise horizontal, diagonal, aur psychological levels. Har type ki apni importance aur implications hoti hai.

                    Horizontal Support aur Resistance: Horizontal support aur resistance levels price ke horizontal levels hote hain jahan price ne pehle se rukawat ka samna kiya hai. Yeh levels traders ke liye ahem hote hain kyun ke yeh clear aur easy to identify hote hain.

                    Diagonal Support aur Resistance: Diagonal support aur resistance levels trendlines ke form mein hotay hain. Yeh levels price ke trend ko follow karte hain aur trend ke direction ko reflect karte hain. Trendlines ko draw karke traders future price movement ko anticipate kar sakte hain.

                    Psychological Support aur Resistance: Psychological support aur resistance levels round numbers jaise ki 100, 50, ya 10 ki tarah ke levels hote hain jo traders ki psyche ko reflect karte hain. In levels par traders ka zyada activity hota hai aur price in levels ko break karna mushkil ho sakta hai.
                  7. Support aur Resistance Ke Talaash (Finding Support and Resistance):

                    Traders support aur resistance levels ko identify karne ke liye price charts, technical indicators, aur price action analysis ka istemal karte hain. Kuch common methods support aur resistance levels ko talaashne ke liye shamil hain:

                    Price Charts: Traders price charts ko analyze karke support aur resistance levels ko identify karte hain. Horizontal lines, trendlines, aur Fibonacci retracement levels charts par draw kiye jate hain.

                    Technical Indicators: Technical indicators jaise ki moving averages, pivot points, aur Bollinger bands bhi support aur resistance levels ko identify karne mein madadgar ho sakte hain. In indicators ki madad se traders price patterns ko samajh sakte hain aur support/resistance levels ko confirm kar sakte hain.

                    Price Action Analysis: Price action analysis mein traders current price ke movement ko observe karte hain aur support/resistance levels ko identify karte hain. Candlestick patterns aur chart patterns ki madad se traders support/resistance levels ko recognize karte hain.
                  8. Support aur Resistance Ka Istemal (Using Support and Resistance):

                    Traders support aur resistance levels ko trading strategies mein shamil karte hain jaise trend reversal, breakout, aur range trading strategies. In levels ko istemal karke traders apne entries aur exits ko define karte hain aur risk management ko improve karte hain.

                    Trend Reversal Strategies: Trend reversal strategies mein traders support aur resistance levels ko istemal karte hain taake trend ke change ki possibility ko identify kar sakein. Support level ke neeche ya resistance level ke upar ki movement ko dekh kar traders trend reversal ka potential anticipate karte hain.

                    Breakout Strategies: Breakout strategies mein traders support aur resistance levels ko istemal karte hain taake price ke breakout ki possibility ko identify kar sakein. Jab price ek support ya resistance level ko breach karta hai, traders breakout trading opportunities ko explore karte hain.

                    Range Trading Strategies: Range trading strategies mein traders support aur resistance levels ke beech price ke movement ko trade karte hain. Jab price ek support level tak girne ke baad phir se upar jaati hai ya ek resistance level tak barhne ke baad phir se neeche aati hai, traders range trading strategies ka istemal karte hain.
                  9. Support aur Resistance Ke Breakout (Breakouts of Support and Resistance):

                    Jab price ek support ya resistance level ko breach karta hai, yeh ek breakout kehte hain. Breakouts trading opportunities create karte hain lekin false breakouts bhi common hote hain. Traders ko breakouts ko confirm karne aur false breakouts se bachne ke liye kuch techniques istemal karne chahiye:

                    Volume Confirmation: Breakouts ko confirm karne ke liye traders volume analysis ka istemal karte hain. Agar breakout high volume ke saath hota hai, toh yeh confirmatory signal hota hai.

                    Price Confirmation: Breakout ko confirm karne ke liye traders price action ko observe karte hain. Agar breakout ek strong candlestick pattern ke saath hota hai, toh yeh confirmatory signal ho sakta hai.

                    Re-test Confirmation: Breakout ke baad price ka re-test support/resistance level ko confirm kar sakta hai. Agar price breakout ke baad phir se support/resistance level par jaata hai aur wahan se reverse hota hai, toh yeh breakout ko confirm karne ka indication ho sakta hai.
                  10. Support aur Resistance Ka Role Trend Analysis Mein (Role of Support and Resistance in Trend Analysis):

                    Support aur resistance levels trend analysis mein ahem hotay hain. Trend reversal aur continuation patterns ko samajhne mein inka istemal hota hai. Jab price ek trend ke against move karta hai aur ek support ya resistance level ko breach karta hai, toh yeh trend reversal ka indication ho sakta hai.

                    Support aur resistance levels ko trendlines ke sath combine karke traders trend direction ko identify karte hain. Agar price ek uptrend mein hai, toh traders support level par entries le sakte hain aur agar price ek downtrend mein hai, toh traders resistance level par entries le sakte hain.
                  11. Support aur Resistance Ka Risk Management Mein Istemal (Using Support and Resistance in Risk Management):

                    Support aur resistance levels ko risk management mein istemal karke traders apni entries aur exits ko better manage kar sakte hain aur losses ko minimize kar sakte hain. Kuch risk management techniques jo support aur resistance levels ke istemal se judi hui hain:

                    Stop Loss Placement: Traders apne stop loss orders ko support aur resistance levels ke aas paas place karte hain taake agar price un levels ko breach kare, toh unki position automatically close ho jaye aur losses ko minimize kiya ja sake.

                    Profit Target Setting: Traders apne profit targets ko support aur resistance levels ke near place karte hain taake jab price un levels tak pohanchti hai, toh unki positions automatically close ho jaye aur profits secure kiye ja sakein.

                    Position Sizing: Traders apne position sizes ko support aur resistance levels ke according adjust karte hain taake agar price un levels ko breach kare, toh unki losses controlled rahein aur risk minimize ho.
                  12. Psychological Aspect of Support aur Resistance (Support aur Resistance Ka Psyche):

                    Support aur resistance levels market participants ke emotions aur sentiment ko reflect karte hain. In levels ke aas paas hone wale trading activity se traders ki psychology ka pata lagaya ja sakta hai.

                    Jab price ek support ya resistance level tak pohanchta hai, toh traders ke emotions aur sentiment mein changes aate hain. Support level par price ka girna traders ko nervous aur uncertain kar sakta hai, jabke resistance level par price ka barhna traders ko excited aur bullish bana sakta hai.

                    Traders apne trading decisions ko support aur resistance levels ke aas paas hone wale sentiment aur psychology ke hisaab se adjust karte hain. Agar ek support level breach hota hai, toh traders ko bearish sentiment mein ho sakta hai aur agar ek resistance level breach hota hai, toh traders ko bullish sentiment mein ho sakta hai.
                  13. Support aur Resistance Ka Importance in Decision Making (Faisle Mein Support aur Resistance Ki Ahmiyat):

                    Trading decisions lene mein support aur resistance levels ka consideration karna zaroori hai. In levels se traders kaafi sari crucial information hasil karte hain. Support aur resistance levels ko samajh kar traders apne trading strategies ko refine aur improve kar sakte hain.

                    Agar ek support level breach hota hai, toh yeh ek potential trend reversal ka indication ho sakta hai aur traders ko apni positions ko adjust karne ki zaroorat ho sakti hai. Agar ek resistance level breach hota hai, toh yeh ek potential trend continuation ka indication ho sakta hai aur traders ko apne positions ko hold karne ki zaroorat ho sakti hai.

                    Support aur resistance levels ko samajh kar traders apne entry aur exit points ko define karte hain aur apne trading decisions ko optimize karte hain. In levels ke consideration se traders apni risk management ko bhi improve kar sakte hain aur apne trading performance ko enhance kar sakte hain.
                  14. Support aur Resistance Ke Limitations (Limitations of Support and Resistance):

                    Support aur resistance levels kabhi-kabhi unreliable ho sakte hain, khas tor par jab market mein volatility zyada hoti hai ya phir major news events hotay hain. Kuch limitations jo support aur resistance levels ke saath judi hui hain:

                    False Breakouts: Kabhi-kabhi price support ya resistance level ko temporarily breach kar leti hai, lekin phir se reverse ho jati hai. Yeh false breakouts trading strategies ko affect kar sakte hain aur traders ko losses mein daal sakte hain.

                    Whipsaws: Whipsaws market mein sudden aur sharp price movements ko describe karte hain. Kabhi-kabhi support aur resistance levels ko whipsaws se affect kiya ja sakta hai, jisse traders ko confusion hota hai aur unki positions ko stop out karna padta hai.

                    Market Volatility: Jab market mein volatility zyada hoti hai, toh support aur resistance levels ka reliability kam ho jata hai. Volatile market conditions mein price ek support ya resistance level ko breach karne ke baad bhi phir se reverse ho sakta hai.

                    Traders ko support aur resistance levels ke limitations ko samajh kar unki trading strategies ko adjust karna chahiye. In limitations se bachne ke liye traders ko multiple confirmation signals ka istemal karna chahiye aur market conditions ko closely monitor karna chahiye.
                  15. Conclusion (Ikhtitami Guftagu):

                    Support aur resistance forex trading mein ek ahem tool hain jo traders ko market ke dynamics samajhne mein madad karte hain. In levels ka istemal karke traders apni trading strategies ko refine aur improve kar sakte hain. Support aur resistance levels ko samajh kar traders apne entry aur exit points ko define karte hain aur apne trading decisions ko optimize karte hain. Taham, traders ko support aur resistance levels ke limitations ko bhi samajhna zaroori hai taake woh apni trading strategies ko effectively implement kar sakein aur market risks ko minimize kar sakein.

                  • #10 Collapse

                    support or resistance in forex trading
                    Click image for larger version

Name:	download (8).png
Views:	42
Size:	10.1 کلوبائٹ
ID:	12916413
                    Forex trading mein "support" aur "resistance" ahem concepts hain jo traders ke liye market analysis mein istemal hotay hain. Ye levels market mein price movements ke patterns aur trends ko samajhne mein madad dete hain. Neeche support aur resistance ke mukhtasir tafseelat di gayi hain:

                    1. Support (سپورٹ): Support level ek price level hai jahan traders expect karte hain ke market ki downward trend rok jaye aur price mein bounce ho. Jab price support level tak pohanchta hai, to traders expect karte hain ke demand zyada ho jayegi aur selling pressure kam ho jayegi. Support level traders ke liye ek crucial point hota hai kyunke agar price support level ko break kar leta hai, to ye bearish trend ke indication ho sakti hai.

                    2. Resistance (رزسٹنس): Resistance level ek price level hai jahan traders expect karte hain ke market ki upward trend rok jaye aur price mein bounce ho. Jab price resistance level tak pohanchta hai, to traders expect karte hain ke supply zyada ho jayegi aur buying pressure kam ho jayegi. Resistance level bhi traders ke liye ek important point hota hai kyunke agar price resistance level ko break kar leta hai, to ye bullish trend ke indication ho sakti hai.

                    Support aur Resistance ke Istemal:
                    1. Entry aur Exit Points: Traders support aur resistance levels ko entry aur exit points ke taur par istemal karte hain. Support level par long positions lete hain jab price bounce karta hai aur resistance level par short positions lete hain jab price downward trend mein hai.
                    2. Stop Loss Placement: Traders apne positions ke stop loss levels ko support aur resistance levels ke aas paas place karte hain taake in levels ko breach hone par unki positions automatically close ho jayein.
                    3. Trend Analysis: Support aur resistance levels ko dekhte hue traders market ke overall trend ko samajhne ki koshish karte hain. Agar price support level ko repeatedly touch kar rahi hai aur bounce ho rahi hai, to ye indication hai ke market mein bullish trend hai. Agar price resistance level ko repeatedly touch kar rahi hai aur bounce ho rahi hai, to ye indication hai ke market mein bearish trend hai.

                    Support aur resistance levels market ke price movements ko analyze karne aur trading decisions lene mein madadgar hote hain. Ye levels traders ko market ke potential turning points aur trend changes ka pata lagane mein madad dete hain. Isliye, har trader ko in levels ka sahi tareeqay se istemal karna chahiye taake unki trading decisions mein accuracy aaye aur unka risk kam ho.
                     
                    • #11 Collapse

                      Support or resistance in forex trading


                      Click image for larger version

Name:	download - 2024-04-19T095721.314.png
Views:	44
Size:	5.1 کلوبائٹ
ID:	12916436

                      Support aur resistance forex trading mein important concepts hain jo price levels ko describe karte hain jahan market mein price movement ke potential changes ya reversals ka indication hota hai. Yeh levels traders ke liye critical hote hain market analysis aur trading decisions ke liye. Niche diye gaye points support aur resistance ke bare mein hain:
                      1. Support (سپورٹ): Support level ek price level hai jahan traders expect karte hain ke price neeche girne ke baad ruk jayega aur phir se upar jaega. Support level ko aksar previous lows, demand zones, ya technical indicators jaise moving averages se identify kiya jata hai. Support level ko support kaha jata hai kyun ke yeh price ko neeche se sambhalta hai.
                      2. Resistance (رزسٹنس): Resistance level ek price level hai jahan traders expect karte hain ke price upar jaane ke baad ruk jayega aur phir se neeche aayega. Resistance level ko aksar previous highs, supply zones, ya technical indicators jaise Fibonacci levels se identify kiya jata hai. Resistance level ko resistance kaha jata hai kyun ke yeh price ko upar se rokta hai.
                      3. Istemal: Support aur resistance levels ka istemal traders price action analysis mein karte hain aur trading strategies develop karte hain. Support level par traders long positions enter karte hain jabke resistance level par traders short positions enter karte hain. In levels ka istemal bhi stop-loss orders aur profit targets set karne mein kiya jata hai.
                      4. Dynamic Nature: Support aur resistance levels market ke dynamics ke hisaab se change hote rehte hain. Market mein volatility ya price action changes ke sath, support aur resistance levels bhi shift ho sakte hain. Isliye traders ko regular basis par support aur resistance levels ko update karna important hota hai.

                      Support aur resistance levels price action analysis ka critical part hai jiska sahi istemal karke traders market movements ko samajh sakte hain aur trading decisions lene mein confident hote hain. Lekin, iske saath-saath proper risk management aur confirmation indicators ka bhi istemal karna important hai.


                      • <a href="https://www.instaforex.org/ru/?x=ruforum">InstaForex</a>
                      • #12 Collapse

                        Support or resistance in forex trading


                        Click image for larger version

Name:	image_161482.png
Views:	28
Size:	5.1 کلوبائٹ
ID:	12917811


                        Forex trading mein support aur resistance ki baat aati hai to yeh trading ke liye bohot ahem hota hai. Yeh dono concepts traders ko market movements ko samajhne mein madad karte hain strategy ko smaj ker hi trading kerni chahiye or is ko ignore nahi krna chahiye.


                        Support.

                        Support market mein aik level hota hai jahan se price girne ke baad phir se upar uthta hai. Yeh level traders ke liye bohot important hota hai kyunki yeh level market ka bottom hota hai aur is se price ka upar jane ka trend shuru hota hai.

                        Resistance.

                        Resistance market mein aik level hota hai jahan se price upar jane ke baad phir se neeche ata hai. Yeh level traders ke liye bohot important hota hai kyunki yeh level market ka top hota hai aur is se price ka neeche jane ka trend shuru hota hai.


                        Support and Resistance Role.

                        Support aur resistance levels traders ko market trends ke bare mein information dete hai. Agar price support level se neeche jata hai to market bearish trend mein hai aur agar price resistance level se upar jata hai to market bullish trend mein hai.


                        Traders support aur resistance levels ko price action aur technical analysis ke zariye determine karte hai. Support aur resistance levels ka use traders ko market mein trades ko enter aur exit karne mein madad karta hai.

                        More Important.

                        Support aur resistance levels forex trading mein bohot important hai kyunki yeh traders ko market trends ke bare mein information dete hai. Traders in levels ko use kar ke trading strategies banate hai aur market movements ko samajhte hai.

                        اب آن لائن

                        avatar Ayeza
                        avatar Sno
                        avatar Doa84
                        avatar Trigger
                        Working...
                        X