Trend Reversal Patterns: Identifying and Trading Signals.
X
  • وقت
  • دکھائیں
Clear All
new posts
  • #1 Collapse

    Trend Reversal Patterns: Identifying and Trading Signals.
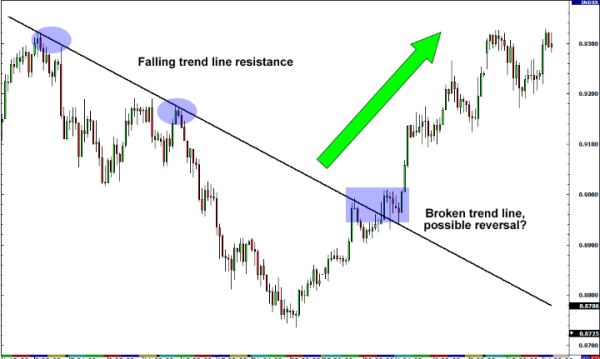
    Trend reversal patterns, yaani ke manzar badalne ki suratein, forex, stocks aur anya markets mein traders ke liye ahem hote hain. Ye patterns market ki current direction ko badalne ka zahir indicator hote hain. Yehan, hum trend reversal patterns ki shanakht aur unse trade signals ko samajhne par ghaur karenge.


    Head and Shoulder pattern:
    Head and Shoulders pattern ek mukhtalif trend reversal pattern hai jise traders frequently dekhte hain. Is pattern mein, ek trend ke baad price ek high banata hai (head) jo ke do pichle highs se ooncha hota hai. Iske baad, price kam hota hai aur ek choti high (shoulder) banata hai, phir doosra head banata hai, lekin pehle wale head se kam high par. Jab price dobara girne lagta hai aur pehli shoulder ki taraf jaata hai, ye trend reversal ka ek potential sign hota hai.


    Double Top aur double Bottom:
    Double top pattern jab dekha jaata hai, to ye ek bullish trend ke indication ke roop mein samjha jaata hai. Ye tab hota hai jab price ek high banata hai, phir gir kar ek support level tak jaata hai, phir dobara upar jaata hai lekin pehle high se neeche reh jaata hai. Double bottom pattern mein, ek similar process hota hai lekin yahan price ek neeche wala level touch karta hai, phir upar jaata hai, phir dobara neeche aata hai lekin pehli low se ooncha reh jaata hai. Ye dono patterns reversal ko suggest karte hain.


    Shooting Star:
    Shooting star aur hammer candles ek single candlestick pattern hote hain jo ke reversal ko indicate karte hain. Shooting star ek uptrend ke baad aata hai aur ye ek small body ke saath ek long upper shadow ke saath hota hai. Ye indicate karta hai ke buyers initially control mein hote hain lekin phir sellers ne control le liya hai. Hammer ek downtrend ke baad aata hai aur ye ek small body ke saath ek long lower shadow ke saath hota hai. Ye indicate karta hai ke sellers initially control mein hote hain lekin phir buyers ne control le liya hai.

    Trend reversal patterns ko identify karne ke baad, traders ko entry aur exit points ko identify karne ke liye aur confirmation signals ke liye wait karna chahiye. Ek mukhtasir stop loss aur target ke saath, ye patterns traders ko profitable trades karne mein madad karte hain. Magar yaad rahe, har pattern 100% perfect nahi hota, isliye risk management hamesha zaroori hai.

    Click image for larger version

Name:	dddd.png
Views:	43
Size:	49.4 کلوبائٹ
ID:	12912783
  • <a href="https://www.instaforex.org/ru/?x=ruforum">InstaForex</a>
  • #2 Collapse

    Trend Reversal Patterns: Identifying and Trading Signals.?


    Click image for larger version

Name:	download (56).png
Views:	32
Size:	6.5 کلوبائٹ
ID:	12912963


    **Trend Reversal Patterns: Identifying and Trading Signals**
    Trend reversal patterns are crucial for traders to recognize as they indicate potential shifts in market direction, offering opportunities for profitable trades. Here's a guide to identifying and trading these signals:

    **1. Understanding Trend Reversals ()**

    Trend reversal patterns occur when the prevailing direction of price movement changes. This shift can signify the end of an uptrend or downtrend, presenting traders with new prospects.

    **2. Common Reversal Patterns **

    a. **Head and Shoulders ** This pattern consists of three peaks, with the middle one being the highest (the head), flanked by two lower peaks (the shoulders). A neckline connects the lows of the two troughs between the peaks. A break below the neckline signals a bearish reversal, while a break above it suggests a bullish reversal.

    b. **Double Top and Bottom ** Double top forms when the price reaches a high, retraces, then revisits the same high before declining. Conversely, double bottom occurs when the price hits a low, rebounds, then returns to the same low before rising. These patterns indicate potential reversals in the current trend.

    c. **Inverse Head and Shoulders :** This mirror image of the head and shoulders pattern appears at the end of a downtrend, suggesting a bullish reversal when the price breaks above the neckline.

    **3. Trading Strategies

    a. **Confirmation:** Wait for confirmation signals before entering a trade based on reversal patterns. This could include a close below the neckline for head and shoulders patterns or a break above the neckline for inverse head and shoulders.

    b. **Risk Management:** Implement proper risk management techniques, such as setting stop-loss orders, to protect capital in case the reversal pattern fails.

    c. **Volume Analysis:** Analyze trading volume accompanying the pattern. A decrease in volume during the formation of reversal patterns may indicate weakening momentum and increase the likelihood of a successful reversal.

    d. **Price Targets:** Set realistic price targets based on the height of the pattern. For example, measure the distance from the head to the neckline in a head and shoulders pattern and project it downwards from the neckline to estimate the potential target.

    **4. Conclusion

    Identifying and trading trend reversal patterns can be profitable, but it requires patience, discipline, and thorough analysis. By understanding common reversal patterns, employing effective trading strategies, and managing risks, traders can capitalize on opportunities presented by market reversals.


    • #3 Collapse

      Trend Reversal Patterns.
      Forex mein, trend reversal patterns market ki direction ko badalte hain aur traders ko market mein aane wali naye trends ki samajh mein madad dete hain.

      Click image for larger version

Name:	images (4).png
Views:	30
Size:	17.2 کلوبائٹ
ID:	12912982

      Yeh patterns traders ko market mein hone wali changes ke baray mein advance mein bata dete hain aur unhe apne trades ko adjust karne mein madad karte hain.

      Head and Shoulders Pattern.

      Head and Shoulders pattern ek aisa pattern hai jis mein market ek uptrend ke baad down trend mein jaata hai. Yeh pattern traders ko bataata hai ki market ka trend change hone wala hai aur ab traders ko sell positions lena chahiye. Is pattern mein, market mein ek high peak hota hai jo "head" kehlata hai aur iske dono taraf ek aur peak hota hai jo "shoulders" kehlata hai.

      Double Top/Bottom Pattern.

      Double Top/Bottom pattern ek aisa pattern hai jahan market ek trend ke baad reverses hota hai aur phir wapas se usi trend mein jaata hai. Is pattern mein market mein do peaks hotay hain jo ek doosre ke level par hote hain. Jab market doosri baar wapas se usi level par aata hai to yeh ek signal hai ki market ka trend change hone wala hai.

      Click image for larger version

Name:	images (3).png
Views:	27
Size:	20.8 کلوبائٹ
ID:	12912983

      Bullish/Bearish Engulfing Pattern.

      Bullish/Bearish Engulfing pattern market mein ek trend reversal ka signal hai. Is pattern mein, bull market mein ek down candle ek up candle ko engulf karta hai aur bear market mein up candle down candle ko engulf karta hai. Yeh pattern traders ko bataata hai ki market ka trend ab badalne wala hai.

      Hammer/Shooting Star Pattern.

      Hammer/Shooting Star pattern market mein reversal ka signal hai. Is pattern mein, market mein ek high ya low point hota hai aur phir ek candle wapas se us point par aata hai. Agar woh candle "hammer" ki tarah dikhta hai to yeh ek bullish signal hai aur "shooting star" ki tarah dikhta hai to yeh ek bearish signal hai.

      Click image for larger version

Name:	images (5).jpeg
Views:	28
Size:	60.6 کلوبائٹ
ID:	12912984

      In sab patterns ka istemaal karke traders market trends aur reversals ko samajh sakte hain aur apne trades ko bhi adjust kar sakte hain.


      • #4 Collapse

        Trend Reversal Patterns: Identifying and Trading Signals.
        Click image for larger version

Name:	download (4).png
Views:	30
Size:	7.5 کلوبائٹ
ID:	12912998


        Trend reversal patterns forex trading mein ahem hote hain kyunki yeh market ke direction ka pata lagane mein madad dete hain. In patterns ka tajziya karke traders market ke reversal points ko identify kar sakte hain aur trading signals generate kar sakte hain. Neeche kuch mukhtalif trend reversal patterns ke baare mein tafseelat di gayi hain:

        1. Double Top/Bottom (دوہری چوٹی/نیچے): Double Top pattern uptrend ke doran dekha jata hai jab market do martaba ek aik level par pahunch kar reverses hota hai. Double Bottom pattern ise downtrend ke doran dekha jata hai jab market do martaba ek aik level par pahunch kar reverses hota hai. Jab price level do martaba test hota hai aur phir uss level se neeche ya ooper move hota hai, to yeh trend reversal ka signal hota hai.

        2. Head and Shoulders (سر اور کندھے): Head and Shoulders pattern bhi trend reversal ko darust karta hai. Is pattern mein ek "head" aur do "shoulders" hote hain jo price action ke tajziya se bana hota hai. Jab market ek uptrend ke baad ek "head" formation banata hai aur phir do "shoulders" banta hai jo lower highs ko darust karta hai, to yeh downtrend ka signal hota hai. Iske ulte, ek downtrend ke baad ek "head" formation ke saath do "shoulders" banta hai jo higher lows ko darust karta hai, to yeh uptrend ka signal hota hai.

        3. Triple Top/Bottom (تین چوٹی/نیچے): Triple Top pattern uptrend ke doran dekha jata hai jab market teen martaba ek aik level par pahunch kar reverses hota hai. Triple Bottom pattern ise downtrend ke doran dekha jata hai jab market teen martaba ek aik level par pahunch kar reverses hota hai. Is pattern mein teen bar price level ek hi level par pahunchta hai aur phir reverses hota hai, yeh trend reversal ka signal hota hai.

        Tajziya aur Trading Signals: Trend reversal patterns ko identify karne ke liye traders ko candlestick charts aur price action ko closely observe karna hota hai. In patterns ke signals ko confirm karne ke liye traders doosre technical indicators aur confirmatory signals ka bhi istemal karte hain. Jab trend reversal ka signal milti hai, traders entry aur exit points ko tay karte hain aur stop-loss orders ka istemal karke apne positions ko manage karte hain.

        Zaroori hai ke traders in patterns ko sahi tareeqay se samajhain aur unke signals ko confirm karein. Market mein false signals bhi hote hain, isliye risk management ka bhi ahem kirdar hota hai. Har pattern ki apni trading strategy hoti hai, lekin zaroori hai ke traders hamesha market ke overall context ko samajh kar decisions lein aur apne trading plan ke mutabiq amal karein.


        • #5 Collapse

          Trend Reversal Patterns Kya Hote Hain?
          Trend reversal patterns forex trading mein ahem hoti hain kyunki ye market ke current trend ka reversal ya change signal deti hain. Ye patterns market ke direction mein umda tabdeeli ya u-turn ko darust karti hain aur traders ko upcoming price movements ka hint deti hain. In patterns ka pehchan karke traders apne trading decisions ko improve kar sakte hain aur profit kamane ke chances ko barha sakte hain.
          Click image for larger version

Name:	13.-parabolic-4.png
Views:	24
Size:	58.1 کلوبائٹ
ID:	12913020


          Trend Reversal Patterns Ki Pechan Kaise Hoti Hai?

          Trend reversal patterns ko pehchanne ke liye traders ko market ke price action ko closely monitor karna hota hai. In patterns mein commonly use kiye jane wale indicators aur tools include hain candlestick patterns, chart patterns, aur technical indicators jaise ke RSI aur MACD. In tools aur indicators ki madad se traders market ke momentum aur trend ke changes ko detect karte hain aur reversal patterns ko identify karte hain.

          Trading Signals Aur Entry Points:

          Trend reversal patterns traders ko potential entry points aur trading signals provide karte hain. Jab traders kisi reversal pattern ko detect karte hain, to wo apne trading strategy ke mutabiq entry aur exit points tay karte hain. Agar trend reversal pattern ko sahi tareeqe se recognize kiya jaye aur confirmatory signals milen, to traders entry points tay karke long ya short positions enter karte hain. In patterns ko samajh kar traders apni risk management strategies ko bhi optimize kar sakte hain.

          Reversal Patterns Ki Importance:

          Trend reversal patterns ka use karna traders ke liye important hai kyunki ye unhein market ke turning points ko identify karne mein madad karte hain. In patterns ke signals ko samajh kar traders apni trading strategies ko adjust kar sakte hain aur better trading opportunities explore kar sakte hain. Agar traders in patterns ko sahi tareeqe se interpret karte hain aur confirmatory factors ke sath entry points decide karte hain, to unka trading performance improve ho sakta hai aur loss se bacha ja sakta hai. Isi tarah, trend reversal patterns ka knowledge hone se traders apni trading skills ko enhance kar sakte hain aur consistent profits generate kar sakte hain.
          Click image for larger version

Name:	3.-retracement.png
Views:	29
Size:	61.5 کلوبائٹ
ID:	12913019


          There is always light. If only we're brave enough to see it. If only we're brave enough to be it.
          • #6 Collapse

            Trend Reversal Patterns: Identifying and Trading Signals


            Click image for larger version

Name:	grade12-reversal-trendline-break.png
Views:	24
Size:	17.6 کلوبائٹ
ID:	12913033

            1. Introduction: Trend reversal patterns forex trading mein ahem hote hain kyunki ye market trend ke change hone ka indication dete hain. Ye patterns traders ko trend reversal ke points ko identify karne aur appropriate trading signals lene mein madad karte hain.

            2. Common Reversal Patterns: Kuch common trend reversal patterns hain jinhe traders regularly identify karte hain. Ye patterns include Head and Shoulders, Double Tops and Bottoms, Triple Tops and Bottoms, aur saath hi Falling Wedge aur Rising Wedge bhi shamil hote hain.

            3. Identifying Reversal Patterns: Reversal patterns ko identify karne ke liye traders price charts aur technical indicators ka istemal karte hain. In patterns ko recognize karne ke liye traders ko price action aur chart patterns ko observe karna hota hai.

            4. Trading Signals: Jab traders trend reversal patterns ko identify karte hain, to unhe trading signals milte hain. For example, jab Head and Shoulders pattern complete hota hai, to traders ko selling signal milta hai. Jab Double Bottom pattern complete hota hai, to buying signal milta hai.

            5. Confirmation : Trend reversal patterns ko trade karne se pehle traders ko confirmation ka istemal karna zaroori hota hai. Iske liye wo dusre technical indicators aur price action ko bhi consider karte hain taake unke signals ko confirm kiya ja sake.

            6. Stop Loss & Take Profit Levels: Trend reversal patterns ko trade karte waqt, traders ko apne stop loss aur take profit levels ko bhi set karna zaroori hota hai. Stop loss levels unhe protect karte hain agar trade unfavorable direction mein move karta hai aur take profit levels unhe profits book karne mein madad karte hain.

            7. Risk Management: Risk management bhi trend reversal patterns ko trade karte waqt crucial hai. Traders ko apne risk ko manage karne ke liye position sizing aur leverage control ka istemal karna chahiye.

            8. Conclusion: Trend reversal patterns forex trading mein important hote hain kyunki ye market trends ke change hone ka indication dete hain. Traders ko in patterns ko identify karne aur appropriate trading signals lene mein madad milti hai. Lekin, confirmation, stop loss levels, take profit levels, aur risk management ka sahi taur par istemal karna bhi zaroori hai trend reversal patterns ko trade karte waqt.
            • #7 Collapse

              Trend Reversal Patterns: Pehchan aur Trading Signals

              Trend reversal patterns, yaani ke trend ka rukh badalne ke aaraa, market analysis mein ek ahem hota hai. In patterns ko pehchanna aur unke signals ko samajhna traders ke liye zaroori hai taake woh sahi waqt par apne trades ko adjust kar sakein aur nuksaan se bach sakein. Is article mein hum trend reversal patterns ki pehchan aur unke trading signals par ghoor karenge.

              **Bab 1: Introduction**

              Market analysis mein trend reversal patterns ka study karna traders ke liye zaroori hai kyunki yeh unhein market ki movement ko samajhne mein madad karta hai. Trend reversal patterns, jaise ke naam se wazeh hai, indicate karte hain jab market ka trend ek direction se doosre direction mein badalne wala hota hai.

              **Bab 2: Kya Hote Hain Trend Reversal Patterns?**

              Trend reversal patterns market ke behavior ko samajhne ka ek tareeqa hai. Ye patterns market ke momentum mein tabdeeli ko darust karte hain. Kuch mashhoor trend reversal patterns mein include hain Head and Shoulders, Double Top, Double Bottom, aur Inverse Head and Shoulders.

              **Bab 3: Head and Shoulders Pattern**

              Head and Shoulders pattern ek classical trend reversal pattern hai. Ismein teen peaks hote hain jinmein se middle peak sabse bada hota hai, aur do side peaks usse chote hote hain. Yeh pattern indicate karta hai ke market ka trend bullish se bearish mein badalne wala hai.

              **Bab 4: Double Top Pattern**

              Double Top pattern ek aur common trend reversal pattern hai. Ismein market do baar ek specific level tak pahunchkar ruk jata hai phir se neeche girne lagta hai. Yeh pattern indicate karta hai ke bullish trend khatam hone wala hai aur bearish trend shuru hone wala hai.

              **Bab 5: Double Bottom Pattern**

              Double Bottom pattern Double Top ka opposite hota hai. Ismein market do baar ek specific level tak gir kar ruk jata hai phir se upar uthne lagta hai. Yeh pattern bearish trend ke khatam hone aur bullish trend ke shuru hone ki indication deta hai.

              **Bab 6: Inverse Head and Shoulders Pattern**

              Inverse Head and Shoulders pattern Head and Shoulders ka ulta hota hai. Ismein teen troughs hote hain jinmein se middle trough sabse nicha hota hai, aur do side troughs usse oopar hote hain. Yeh pattern indicate karta hai ke market ka trend bearish se bullish mein badalne wala hai.

              **Bab 7: Trend Reversal Patterns ke Trading Signals**

              Trend reversal patterns ke trading signals ko samajhna trading mein successful hone ke liye zaroori hai. In patterns ko sahi tarah se pehchan karne aur unke signals ko samajhne se traders apne trades ko better manage kar sakte hain.

              **Bab 8: Technical Analysis aur Trend Reversal Patterns**

              Trend reversal patterns ko samajhne ke liye technical analysis ka istemal hota hai. Technical analysis mein traders market ke historical data aur price movements ko analyze karte hain taake woh trend reversal patterns ko pehchan sakein aur unke signals ko samajh sakein.

              **Bab 9: Trading Strategies for Trend Reversal Patterns**

              Trend reversal patterns ke trading strategies develop karne ke liye traders ko market ka behavior samajhna zaroori hai. Kuch strategies mein include hain pattern recognition, confirmation signals ka istemal, aur risk management.

              **Bab 10: Conclusion**

              Trend reversal patterns market analysis mein ek important tool hote hain jo traders ko market ke direction ko samajhne mein madad karte hain. In patterns ko pehchanna aur unke signals ko samajhna traders ke liye zaroori hai taake woh successful trading decisions le sakein.
              • #8 Collapse


                trained reversal patteren woh farmishnz hain jo maliyati charts mein dekhe jatay hain jo murawaja rujhan ki simt mein mumkina tabdeeli ki tajweez karte hain. tajir market mein mumkina dakhlay aur kharji raastoon ki shanakht ke liye un namonon ka istemaal karte hain. kuch aam rujhan ke ulat patteren mein shaamil hain :


                Head and Shoulders


                yeh namona teen chotyon par mushtamil hai darmiyani chouti ( head ) baqi do ( kaandhon ) se onche hai. yeh oopar ke rujhan se neechay ke rujhan ki taraf muntaqili ki nishandahi karta hai. sir aur kaandhon ke patteren ki tasdeeq is waqt hoti hai jab qeemat gardan se neechay toot jati hai, aik lakeer jo dono kaandhon ke neechay se khenchi jati hai .


                Inverse Head and Shoulders


                yeh sir aur kaandhon ke patteren ke bar aks hai aur neechay ke rujhan se oopar ke rujhan ki taraf muntaqili ki nishandahi karta hai. yeh teen Troughs par mushtamil hai darmiyani he took it ( head) baqi do ( kaandhon ) se neechay hai. tasdeeq is waqt hoti hai jab qeemat gardan se oopar toot jati hai .


                Double Top


                yeh patteren is waqt bantaa hai jab qeemat taqreeban aik hi satah par do martaba urooj par pahonch jati hai, jo ke oopri rujhan ke mumkina ulat jane ka ishara deti hai. tasdeeq is waqt hoti hai jab qeemat do chotyon ke darmiyan he took it se neechay ajati hai .


                Double Bottom


                yeh double taap patteren ka ulta hai aur is waqt bantaa hai jab qeemat taqreeban aik hi satah par do baar he took it tak pahonch jati hai, jo ke neechay ke rujhan ke mumkina ulat jane ka ishara deti hai. tasdeeq is waqt hoti hai jab qeemat do Troughs ke darmiyan chouti se oopar ajati hai .


                Triple Top and Triple Bottom


                yeh patteren double taap aur double nichale patteren se mlitay jaltay hain lekin un mein do ki bajaye teen chotiyan ya giraaten shaamil hoti hain. woh bal tarteeb mazboot muzahmat ya himayat ki satah ki nishandahi karte hain, aur ziyada ahem mumkina ulat jane ki tajweez karte hain .


                Wedge Patterns


                girtay wages aur barhatay hue wages aisay namoonay hain jin ki khasusiyat trained lines ko tabdeel karti hai. girtay hue wages aksar taizi ke ulat jane ka ishara dete hain, jabkay barhatay hue wages aam tor par mandi ke ulat jane ki nishandahi karte hain .


                Reversal Candlestick Patterns:


                candle stuck patteren jaisay Engulfing patteren, shaam ke setaaray, aur subah ke setaaray bhi mumkina rujhan ke ulat jane ki nishandahi kar saktay hain jab woh himayat ya muzahmat ki kaleedi sthon par waqay hotay hain .

                taajiron ke liye yeh zaroori hai ke woh tijarti faislay karne se pehlay dosray takneeki isharay aur tajzia ke tareeqon se un namonon ki tasdeeq karen, kyunkay ghalat signals ho satke hain. mazeed bar-aan, mumkina nuqsanaat ko kam karne ke liye rissk managment ki hikmat amlyon ko istemaal kya jana chahiye .


                Click image for larger version

Name:	download (11).png
Views:	26
Size:	5.3 کلوبائٹ
ID:	12913159
                • #9 Collapse

                  1. Mukhtalif Trends Ki Takhleeq

                  Forex trading mein trend reversal patterns ko pehchan'na aham hota hai. Ye patterns market mein mukhtalif trends ki takhleeq ko darust karte hain. Trend reversal patterns market dynamics ka ek important aspect hain jise traders analyze karte hain. In patterns ke samajhne se traders ko market ke future direction ka andaza lagane mein madad milti hai.
                  Trend reversal patterns ko samajhne ke liye traders ko market ke behavior ko closely observe karna hota hai. Market ke movements ko analyze karke traders ko pata chalta hai ke kis direction mein trend change hone wala hai. Ye patterns traders ko trading opportunities provide karte hain jinhe wo apne favor mein istemal kar sakte hain.
                  1. Kyun Hote Hain Trend Reversal Patterns?

                  Market mein kai factors hote hain jo trend reversal patterns ko mutasir karte hain. Economic indicators, geopolitical events, aur technical factors jese ke price action, volume, aur market sentiment inme se kuch important factors hain.
                  Economic indicators market sentiment aur trend mein tabdeeli ko darust karte hain. Jab economic indicators unexpected yaar negative numbers show karte hain, market sentiment negative ho jata hai aur trend reversal hone ka chance barh jata hai. Isi tarah geopolitical events bhi market mein trend reversal ko influence karte hain. Political instability, wars, aur natural disasters jese events market sentiment ko affect kar sakte hain.
                  Technical factors jese ke support aur resistance levels, moving averages, aur chart patterns bhi trend reversal patterns ko darust karte hain. In factors ko analyze karke traders market ke future direction ka andaza lagate hain aur trading decisions lete hain.
                  1. Double Top Aur Double Bottom

                  Double top aur double bottom patterns price action analysis ka ek important aspect hain. Double top pattern jab market ek high point pe do dafa pohanchti hai aur phir neeche girati hai, jabke double bottom mein market do dafa ek low point tak pohanchti hai aur phir upar uth'ti hai.
                  Double top pattern bearish trend ko darust karte hain aur traders ko selling opportunities provide karte hain. Double bottom pattern bullish trend ko darust karte hain aur traders ko buying opportunities provide karte hain.
                  Traders ko double top aur double bottom patterns ko identify karke market mein trend reversal ka andaza lagana asan ho jata hai. In patterns ko confirm karne ke liye traders ko doosre technical indicators ka bhi istemal karna chahiye.
                  1. Head and Shoulders

                  Head and shoulders pattern ek classical chart pattern hai jo trend reversal ko darust karta hai. Is pattern mein market ek high peak (head) ke saath do chhote peaks (shoulders) banaati hai. Head and shoulders pattern bearish trend ko darust karta hai aur traders ko selling opportunities provide karta hai.
                  Traders ko head and shoulders pattern ko identify karne ke liye market ke price movements ko closely observe karna hota hai. Jab market ek high peak banati hai aur phir do chhote peaks banati hai, to ye ek potential head and shoulders pattern ka indication hota hai.
                  Is pattern ko confirm karne ke liye traders ko volume analysis aur doosre technical indicators ka bhi istemal karna chahiye. Jab ye pattern confirm ho jata hai, to traders selling opportunities ke liye position le sakte hain.
                  1. Inverse Head and Shoulders

                  Inverse head and shoulders pattern head and shoulders pattern ka opposite hota hai. Ye pattern bullish trend ko darust karta hai aur traders ko buying opportunities provide karta hai. Is pattern mein market ek low point (head) ke saath do chhote lows (shoulders) banati hai.
                  Traders ko inverse head and shoulders pattern ko identify karne ke liye market ke price movements ko closely observe karna hota hai. Jab market ek low point banati hai aur phir do chhote lows banati hai, to ye ek potential inverse head and shoulders pattern ka indication hota hai.
                  Is pattern ko confirm karne ke liye traders ko volume analysis aur doosre technical indicators ka bhi istemal karna chahiye. Jab ye pattern confirm ho jata hai, to traders buying opportunities ke liye position le sakte hain.
                  1. Hammer Aur Hanging Man

                  Hammer aur hanging man patterns ek single candlestick pattern hote hain jo trend reversal ko darust karte hain. Hammer pattern bullish trend ko darust karta hai jabke hanging man pattern bearish trend ko darust karta hai.
                  Hammer pattern mein market neeche girti hai aur phir se upar uth'ti hai. Is pattern ko confirm karne ke liye traders ko volume aur doosre technical indicators ka bhi istemal karna chahiye.
                  Hanging man pattern mein market upar jati hai aur phir se neeche girti hai. Is pattern ko confirm karne ke liye traders ko volume aur doosre technical indicators ka bhi istemal karna chahiye.
                  1. Bullish Aur Bearish Engulfing

                  Bullish engulfing pattern aur bearish engulfing pattern bhi trend reversal ko darust karte hain. Bullish engulfing pattern jab ek small bearish candle ko ek bada bullish candle engulf karta hai aur bearish engulfing pattern jab ek small bullish candle ko ek bada bearish candle engulf karta hai.
                  Bullish engulfing pattern mein bullish sentiment ka zyada hona market ke bullish reversal ko indicate karta hai. Is pattern ko confirm karne ke liye traders ko volume analysis aur doosre technical indicators ka bhi istemal karna chahiye.
                  Bearish engulfing pattern mein bearish sentiment ka zyada hona market ke bearish reversal ko indicate karta hai. Is pattern ko confirm karne ke liye traders ko volume analysis aur doosre technical indicators ka bhi istemal karna chahiye.
                  1. Abhi Samay Konsa Hai?

                  Trend reversal patterns ko pehchan'ne se pehle, traders ko market ka current trend samajhna zaroori hai. Market mein trend reversal hone se pehle ek strong trend hota hai jise traders identify karte hain.
                  Market ke current trend ko analyze karne ke liye traders ko technical analysis aur price action ka istemal karna chahiye. Market ke current trend ko samajhne ke baad hi traders trend reversal patterns ko identify kar sakte hain.
                  Market mein trend reversal hone ke baad traders ko apne trading strategy ko adjust karna hota hai. Trend reversal patterns ko samajh kar traders apne trading positions ko modify karte hain aur market ke opposite direction mein positions lete hain.
                  1. Risk Management

                  Trading mein risk management ka hona zaroori hai. Trend reversal patterns ke signals ko follow karte waqt, stop-loss orders ka istemal zaroori hai. Stop-loss orders traders ko loss se bachate hain aur unhe apne trading positions ko manage karne mein madad karte hain.
                  Stop-loss orders ko set karne ke liye traders ko market volatility aur price movements ka dhyaan rakhna chahiye. Traders ko apne risk tolerance ke hisab se stop-loss levels set karna chahiye.
                  Risk management ke alawa traders ko position size ka bhi dhyaan rakhna chahiye. Position size ko manage karke traders apne capital ko protect kar sakte hain aur trading losses ko minimize kar sakte hain.
                  1. Confirmation Signals

                  Trend reversal patterns ko confirm karne ke liye, traders doosri indicators aur tools ka istemal karte hain. Moving averages, RSI, aur MACD jese indicators trend reversal patterns ko confirm karne mein madad karte hain.
                  Moving averages market ke trend ko analyze karne ka ek important tool hain. Jab moving averages ka crossover hota hai, to ye ek trend reversal ka indication hota hai. RSI market ke overbought aur oversold levels ko identify karta hai aur trend reversal ko confirm karta hai. MACD market ke momentum ko analyze karta hai aur trend reversal ko confirm karta hai.
                  Confirmation signals ko analyze karke traders apne trading decisions ko validate karte hain. Traders ko multiple indicators ka istemal karke apne analysis ko strengthen karna chahiye.
                  1. Practice Aur Patience

                  Trend reversal patterns ko pehchan'na aur unke signals ko samajhna practice aur patience ka kaam hai. Traders ko time dena chahiye unhe seekhne mein. Practice ke through traders apne analysis skills ko improve kar sakte hain aur trend reversal patterns ko sahi tarike se identify kar sakte hain.
                  Patience ek successful trader ka ek important quality hai. Market mein trend reversal patterns ko identify karne aur unke signals ko samajhne mein patience ka hona zaroori hai. Traders ko jaldi-baazi nahi karni chahiye aur market ke movements ko patiently observe karna chahiye.
                  1. Psychology of Trading

                  Trading ki psychology bhi aham hoti hai. Trend reversal patterns ke signals ko samajh kar, traders ka confidence barh jata hai. Positive attitude aur discipline trading mein aham role play karte hain.
                  Fear aur greed trading decisions ko affect karte hain. Jab market mein trend reversal hota hai, to traders ko apne emotions ko control karna chahiye. Fear aur greed se bachkar traders apne trading decisions ko rational tarike se le sakte hain.
                  Trading mein confidence hona zaroori hai. Jab traders trend reversal patterns ko identify karte hain aur unke signals ko samajhte hain, to unka confidence barh jata hai. Confidence ke sath traders apne trading positions ko manage karte hain aur profitable trades execute karte hain.
                  1. Conclusion

                  Trend reversal patterns ko pehchan'na aur unke signals ko samajhna forex trading mein aham hota hai. Traders ko hamesha market ka current trend aur risk management ka khayal rakhna chahiye. Trend reversal patterns ke signals ko analyze karke traders apne trading decisions ko validate karte hain aur market mein successful trading karne ka chance barhate hain.
                  • #10 Collapse

                    Trend Reversal Patterns: Shanaakht Aur Tijarat Ki Alamat

                    1. Introduction:

                    Trend reversal patterns, known as "Trend Ulatne Ki Namunaat," are critical in the world of trading. They signify potential shifts in market direction. Understanding these patterns is essential for traders to anticipate and capitalize on market movements effectively. Trend reversal patterns can help traders identify when a prevailing trend is losing strength and may be about to reverse. By recognizing these patterns early, traders can position themselves to enter trades at opportune moments, maximizing their profit potential.

                    2. Importance of Identifying Reversals:

                    Shanaakht Reversals Ki Ahmiyat Samajhna, tijarat mein kamiyabi ka raaz hai. Ye darust intezam aur faislon ko barhawa dete hain. Identifying trend reversals is crucial for successful trading. When traders can accurately identify the beginning of a trend reversal, they can adjust their strategies accordingly to capitalize on new market movements. Without recognizing these reversals, traders may find themselves on the wrong side of the market, leading to missed opportunities and potential losses.

                    3. Understanding Market Trends:

                    Bazaar ke Rujhanat Ko Samajhna, tijarat ke liye zaroori hai. Janiye ke kaise uptrend aur downtrend ko pehchanein. Understanding market trends is fundamental for traders. An uptrend is characterized by higher highs and higher lows, indicating an overall bullish market sentiment. Conversely, a downtrend is marked by lower highs and lower lows, signaling a bearish market sentiment. By recognizing these trends, traders can align their trading strategies with the prevailing market direction, increasing their chances of success.

                    4. Common Reversal Patterns:

                    Aam Reversal Patterns, jaise ke head and shoulders, double tops, aur double bottoms, ko samajhna trading mein madadgar hota hai. Common reversal patterns, such as head and shoulders, double tops, and double bottoms, are instrumental in trading. These patterns often occur after an extended trend and indicate a potential reversal in market direction. By learning to identify these patterns on price charts, traders can anticipate changes in market sentiment and adjust their positions accordingly.

                    5. Head and Shoulders Pattern:

                    Sar aur kandhon ka namuna, aik aham trend reversal pattern hai. Iske shanaakht aur istemal ko samajhna, tijarat mein kamyabi ka rasta hai. The head and shoulders pattern is a significant trend reversal pattern. It consists of three peaks, with the middle peak (the head) being higher than the other two (the shoulders). This pattern indicates a transition from an uptrend to a downtrend and vice versa. Traders often look for confirmation signals, such as a neckline break, to confirm the validity of the pattern and enter trades accordingly.

                    6. Double Tops and Bottoms:

                    Double Tops aur Double Bottoms, doosre aham trend reversal patterns hain. Inhe samajh kar, bazaar ki raah ka andaza lagaya ja sakta hai. Double tops and double bottoms are other important trend reversal patterns. A double top forms when the price reaches a peak, retraces, and then fails to break above the previous peak, signaling a potential reversal to the downside. Conversely, a double bottom forms when the price reaches a trough, bounces, and then fails to break below the previous trough, indicating a potential reversal to the upside. These patterns are valuable tools for traders to identify potential turning points in the market.

                    7. Triple Tops and Bottoms:

                    Teen Tops aur Teen Bottoms bhi aham hote hain. Inhe pehchanna, bazaar ke mukhtalif stages ko samajhne mein madad deta hai. Triple tops and triple bottoms are also significant. Identifying these patterns helps traders understand various stages of the market. Similar to double tops and bottoms, triple tops and bottoms indicate potential reversals in market direction. However, they consist of three peaks or troughs instead of two, adding an additional layer of confirmation to the reversal pattern. Traders often wait for a breakout above or below the pattern's neckline to confirm the validity of the reversal.

                    8. Reversal Candlestick Patterns:

                    Candlestick Patterns ki madad se bhi trend reversals ko pehchana ja sakta hai. Ismein bearish aur bullish signals shamil hote hain. Reversal candlestick patterns are another method for identifying trend reversals. These patterns form on price charts and provide insight into market sentiment. Bearish reversal patterns, such as the evening star and bearish engulfing, signal a potential shift from bullish to bearish momentum. On the other hand, bullish reversal patterns, such as the morning star and bullish engulfing, indicate a potential shift from bearish to bullish momentum. By recognizing these patterns, traders can make informed decisions about entering or exiting trades.

                    9. Fibonacci Retracement Levels:

                    Fibonacci Retracement Levels, trend reversal ki tajveezat mein ahem kirdar ada karte hain. Ye levels, support aur resistance ko samajhne mein madadgar hote hain. Fibonacci retracement levels play a crucial role in suggesting trend reversals. These levels are based on Fibonacci ratios and are used to identify potential support and resistance levels in the market. Traders often use Fibonacci retracement levels in conjunction with other technical indicators to confirm potential reversal points and make trading decisions accordingly.

                    10. Volume Analysis:

                    Volume Tahlil, trend reversal patterns ko samajhne ka aik aur tareeqa hai. Zyada volume, reversal ki sambhavnaon ko barhata hai. Volume analysis is another method for understanding trend reversal patterns. Volume refers to the number of shares or contracts traded in a security or market during a given period. An increase in volume during a potential reversal pattern can signal greater market participation and conviction in the new direction. Traders often look for volume confirmation to validate the strength of a reversal signal and make informed trading decisions.

                    11. Combining Indicators:

                    Indicatoron Ko Milana, trend reversal patterns ko samajhne mein aur bhi asan bana sakta hai. MACD, RSI, aur Stochastic jaise tools ka istemal madadgar sabit hota hai. Combining indicators can simplify the process of understanding trend reversal patterns. Technical indicators, such as the Moving Average Convergence Divergence (MACD), Relative Strength Index (RSI), and Stochastic oscillator, can provide additional insights into market dynamics. By using multiple indicators in conjunction with each other, traders can reduce false signals and increase the accuracy of their trading decisions.

                    12. Risk Management:

                    Khatra Prabandhan, tijarat mein zaroori hai. Trend reversal patterns ko istemal karte waqt, apne karobari risk ko kam karne ke liye maqool strategies ka istemal karna zaroori hai. Risk management is essential in trading. When using trend reversal patterns, it is crucial to employ sensible strategies to mitigate business risks. This may include setting stop-loss orders, diversifying portfolios, and avoiding over-leveraging positions. By managing risk effectively, traders can protect their capital and maximize their long-term profitability.

                    13. Conclusion:

                    Akhri Alfaz, trend reversal patterns ka madda, tijarat mein nakaamio se bachne aur kamiyabi ko barhane mein hota hai. In patterns ko samajhna aur unka istemal karna, ek maharat ka nishaan hai. In conclusion, understanding and utilizing trend reversal patterns is essential for avoiding failures and enhancing success in trading. Mastering these patterns and incorporating them into trading strategies is a hallmark of skill. By continuously learning and adapting to market conditions, traders can stay ahead of the curve and achieve their financial goals.
                    • #11 Collapse

                      1. Introduction

                      Trend reversal patterns ka concept samajhna market analysis ka ek ahem hissa hai. Har trader ko market trends ko samajhne aur unke ulat jaane ki sambhavnaon ko pehchanna zaroori hai. Trend reversal patterns traders ko market ke mukhtalif phases ko samajhne mein madad karte hain aur unhein trading decisions lene mein guide karte hain.

                      Market mein hone wale changes ko pehchanna aur un par trading karna trading ke mukhtalif aspects ko impact karta hai. Yeh article aapko trend reversal patterns ki pehchan aur un par trading signals ka tajziya karne mein madad karega.

                      2. Types of Reversal Patterns

                      Market mein kai tarah ke reversal patterns hote hain, jinmein se kuch pramukh hain:

                      Head and Shoulders Pattern: Head and Shoulders pattern ek classic bearish reversal pattern hai. Isme price ek high banata hai, phir neeche aata hai (left shoulder), phir se ek aur high banata hai (head), aur phir neeche aata hai (right shoulder). Head and Shoulders pattern ka confirmation jab price neckline ko break karta hai.

                      Double Top Pattern: Double Top pattern ek bearish reversal pattern hai. Isme price do baar ek specific level tak pahunch kar girta hai. Yeh pattern ek psychological level ko represent karta hai jahan se price girne ka trend shuru hota hai.

                      Double Bottom Pattern: Double Bottom pattern ek bullish reversal pattern hai. Isme price do baar ek specific level tak gir kar phir se uth jati hai. Yeh pattern ek support level ko represent karta hai jahan se price ka trend change hota hai.

                      Triple Top Pattern: Triple Top pattern mein price teen baar ek specific level tak pahunch kar girta hai. Yeh pattern bhi bearish reversal ka indication deta hai aur ek strong resistance level ko indicate karta hai.

                      Triple Bottom Pattern: Triple Bottom pattern mein price teen baar ek specific level tak gir kar phir se uth jati hai. Yeh pattern bullish reversal ka indication deta hai aur ek strong support level ko indicate karta hai.

                      Inverse Head and Shoulders Pattern: Inverse Head and Shoulders pattern bearish trend ke baad aata hai aur bullish reversal ka indication deta hai. Yeh pattern Head and Shoulders ka ulta hota hai, jisme left shoulder, head, aur right shoulder hote hain.

                      Har ek reversal pattern ka apna significance hota hai aur traders ko in patterns ko pehchan kar un par amal karna seekhna chahiye.

                      3. Head and Shoulders Pattern

                      Head and Shoulders pattern ek mukhtalif phase ka sabab ban sakta hai. Jab price ek high banata hai, phir neeche aata hai, phir se ek aur high banata hai, aur phir neeche aata hai, to yeh pattern banta hai. Head and Shoulders pattern ka confirmation jab price neckline ko break karta hai, jo ki left shoulder, head, aur right shoulder ke lows ko connect karta hai.

                      Traders ko is pattern ko samajhne ke liye price action ko closely monitor karna chahiye aur neckline ke break ka wait karna chahiye. Jab neckline break hota hai, to traders bearish entry ke liye ready ho sakte hain.

                      4. Double Top Pattern

                      Double Top pattern mein price do baar ek specific level tak pahunch kar girta hai. Yeh pattern bearish reversal ka indication deta hai aur ek potential trend change ko represent karta hai. Is pattern mein traders ko pehli girawat ke baad bearish confirmation ka wait karna chahiye, jaise ke price ka support level ko break karna ya phir ek bearish candlestick pattern ka formation.

                      Ek double top pattern ko identify karne ke liye, traders ko price ke upper peaks par dhyan dena chahiye aur jab price do baar wahi level touch karta hai, to yeh ek potential double top pattern ban sakta hai.

                      5. Double Bottom Pattern

                      Double Bottom pattern ek bullish reversal pattern hai, jo ki ek downtrend ke baad aata hai. Isme price do baar ek specific level tak gir kar phir se uth jati hai. Yeh pattern bullish reversal ka indication deta hai aur ek potential trend change ko represent karta hai.

                      Double Bottom pattern ko confirm karne ke liye, traders ko pehli uthan ke baad bullish confirmation ka wait karna chahiye, jaise ke price ka resistance level ko break karna ya phir ek bullish candlestick pattern ka formation.

                      6. Triple Top Pattern

                      Triple Top pattern mein price teen baar ek specific level tak pahunch kar girta hai. Yeh pattern bhi bearish reversal ka indication deta hai aur ek potential trend change ko represent karta hai. Is pattern mein traders ko teesri girawat ke baad bearish confirmation ka wait karna chahiye.

                      Triple Top pattern ko identify karne ke liye, traders ko price ke upper peaks par dhyan dena chahiye aur jab price teen baar wahi level touch karta hai, to yeh ek potential triple top pattern ban sakta hai.

                      7. Triple Bottom Pattern

                      Triple Bottom pattern mein price teen baar ek specific level tak gir kar phir se uth jati hai. Yeh pattern bullish reversal ka indication deta hai aur ek potential trend change ko represent karta hai. Is pattern mein traders ko teesri uthan ke baad bullish confirmation ka wait karna chahiye.

                      Triple Bottom pattern ko identify karne ke liye, traders ko price ke lower lows par dhyan dena chahiye aur jab price teen baar wahi level touch karta hai, to yeh ek potential triple bottom pattern ban sakta hai.

                      8. Inverse Head and Shoulders Pattern

                      Inverse Head and Shoulders pattern bearish trend ke baad aata hai aur bullish reversal ka indication deta hai. Yeh pattern Head and Shoulders ka ulta hota hai, jisme left shoulder, head, aur right shoulder hote hain. Inverse Head and Shoulders pattern ka confirmation jab price neckline ko break karta hai.

                      Traders ko is pattern ko identify karne ke liye price action ko closely monitor karna chahiye aur neckline ke break ka wait karna chahiye. Jab neckline break hota hai, to traders bullish entry ke liye ready ho sakte hain.

                      9. Identifying Reversal Patterns

                      Reversal patterns ko pehchanna trading ke liye zaroori hai. Ismein traders ko price action ko closely monitor karna hota hai aur patterns ko samajhna hota hai. Price action analysis ke through, traders trend reversal patterns ko identify kar sakte hain aur un par trading ke liye prepare ho sakte hain.

                      Traders ko patterns ko identify karne ke liye market ke behavior ko closely observe karna chahiye. Iske alawa, technical indicators ka bhi istemal kiya ja sakta hai patterns ko confirm karne ke liye.

                      10. Trading Signals

                      Jab reversal pattern confirm ho jata hai, traders ko appropriate trading signals ka intezar karna chahiye. Ismein entry aur exit points ka tay karna shamil hai. Entry point par traders ko confirmation ke sath hi entry lena chahiye, jaise ke price ka breakout ya phir ek candlestick pattern ka confirmation.

                      Stop loss aur take profit levels ka bhi tay karna ahem hota hai trading signals ke sath. Stop loss ki madad se traders apne losses ko control kar sakte hain, jabki take profit levels se wo apne profits ko lock kar sakte hain.

                      11. Risk Management

                      Har trading strategy mein risk management ka ek ahem hissa hota hai. Reversal patterns par trading karte waqt bhi risk management ka khyal rakhna zaroori hai. Traders ko apne trades ke liye stop loss levels tay karna chahiye takay wo apne losses ko minimize kar sakein.

                      Risk reward ratio ko bhi dhyan mein rakhna zaroori hai, jisse ke traders apne trades ko analyze kar sakein aur unhein samajh sakein ki kya unke profits unke losses ko cover karne mein kaafi hain ya nahi.

                      12. Practice and Patience

                      Reversal patterns ko samajhna aur un par trading karna practice aur patience ko require karta hai. Naye traders ko in patterns ko samajhne mein waqt lag sakta hai, isliye unhein sabr se kaam lena chahiye. Demo trading accounts ka istemal karke traders apni skills ko improve kar sakte hain aur patterns ko samajhne mein madad le sakte hain.

                      Iske alawa, historical data ka bhi istemal kiya ja sakta hai patterns ko samajhne aur un par trading karne ke liye. Practice aur patience ke saath hi traders ko apni trading strategies ko refine karna chahiye takay wo market mein consistent success achieve kar sakein.

                      13. Conclusion

                      Trend reversal patterns market mein hone wale changes ko pehchanna aur un par trading karna zaroori hai. In patterns ko samajh kar traders apni strategies ko improve kar sakte hain aur better trading decisions le sakte hain. Har ek trader ko apni risk appetite aur trading style ke hisab se suitable reversal patterns ko identify karke un par trading karna chahiye.

                      Yeh article aapko trend reversal patterns ki pehchan aur un par trading signals ka istemal karne ki technique provide karta hai. Ab traders ko in patterns ko samajh kar market mein successful trading karne ke liye ready ho jana chahiye.

                      • <a href="https://www.instaforex.org/ru/?x=ruforum">InstaForex</a>
                      • #12 Collapse


                        Trend Reversal Patterns: Pehchan aur Trading Signals

                        Forex market mein trading karte waqt, trend reversal patterns ko pehchan karne ka mahatva bohot ahem hai. In patterns ko samajh kar traders market ke mizaaj mein tabdiliyon ko pehchan sakte hain aur munasib tareeqe se positions le sakte hain. Is article mein hum trend reversal patterns ki pehchan aur trading signals par baat karenge.

                        Trend Reversal Patterns Ki Pehchan:
                        1. Head and Shoulders Pattern: Head and shoulders pattern ek popular trend reversal pattern hai. Is pattern mein price ek umeedwar top banata hai, phir uska price girne lagta hai aur phir ek aur top banata hai jo pehle se chota hota hai. Ye top do shoulders ko represent karta hai. Jab price ne doosre shoulder ki taraf se niche girne ka rasta ikhtiyar kar leta hai, toh ye trend reversal ka signal samjha jata hai.
                        2. Double Top/Bottom: Double top ya double bottom pattern mein price ek level par do martaba pohanch kar ruk jata hai aur phir uski direction mein tabdili hoti hai. Double top pattern mein price ek level par do baar pohanch kar ruk jata hai aur phir girne lagta hai, jabke double bottom pattern mein price ek level par do baar pohanch kar ruk jata hai aur phir barhne lagta hai.
                        3. Rising/Falling Wedge: Rising wedge aur falling wedge patterns trend reversal ko darsate hain. Rising wedge pattern mein price higher highs aur higher lows banata hai lekin trend ke opposite mein narrow range mein trading hoti hai. Jab price wedge ke neeche se bahar nikalne lagta hai, toh ye trend reversal ka signal hai. Falling wedge pattern mein price lower highs aur lower lows banata hai lekin trend ke opposite mein narrow range mein trading hoti hai. Jab price wedge ke oopar se bahar nikalne lagta hai, toh ye trend reversal ka signal hai.

                        Trading Signals:

                        Trend reversal patterns ko pehchana jane ke baad, traders ko trading signals ke zariye positions leni chahiye. Kuch ahem trading signals shamil hain:
                        1. Confirmatory Indicators: Trend reversal patterns ko confirm karne ke liye doosre technical indicators ka istemal karna zaroori hai. Jaise ke RSI, MACD, aur moving averages.
                        2. Breakout Confirmation: Pattern ke breakout ka wait karein aur jab price pattern ke andar se bahar nikal jaye, tab position lein.
                        3. Risk Management: Har trade mein risk management ka khayal rakhein aur stop loss orders ka istemal karein.

                        Ikhtitami Alfaaz:

                        Trend reversal patterns ko pehchan kar trading karna ek maharat hai jo har trader ko seekhni chahiye. In patterns ko samajh kar aur trading signals ko follow karke, traders market ke mizaaj mein tabdiliyon ko pehchan sakte hain aur munasib tareeqe se positions le sakte hain. Lekin yaad rahe ke sirf trend reversal patterns par bharosa karke trading na karein, balki doosri technical aur fundamental analysis ke saath inka istemal karein taake aapko behtar nateeje mil sakein.

                        اب آن لائن

                        Working...
                        X