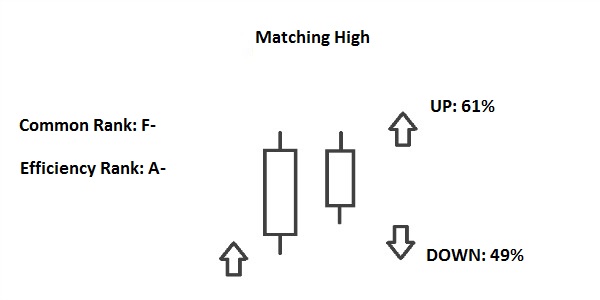
Matching High candlestick pattern ek technical analysis pattern hai jo traders istemal karte hain taake price trends mein potential reversals ko identify karen. Ye ek do-candle pattern hai jo ek uptrend ke doran hota hai aur bullish se bearish ki taraf potential change indicate karta hai. Is pattern ko samajhna traders ko madad karta hai sahi faislay lenay mein trading mein dakhil ho ya nikalne ke baray mein.
Matching High pattern mein do candles hoti hain. Pehli candle ek bullish candle hoti hai jo market mein buying pressure ko darust karti hai. Is candle ko ek dusri candle follow karti hai jo high price mein pehli candle ke high price ke equal ya bohot qareeb hoti hai. Doosri candle bullish ya bearish ho sakti hai, lekin aam tor par ye buyers aur sellers ke darmiyan ek muqablay ka nateeja hai.

Matching High pattern ko pehchannay ke liye traders ye characteristics dekhtay hain:
Traders Matching High pattern ko aur bhi technical analysis tools aur indicators ke saath istemal karte hain takay iski reliability zyada ho. Kuch common strategies shamil hain:
Yaad rakhiye ke koi bhi trading pattern ya signal 100% sahi nahi hota, aur traders ko hamesha apne capital ko protect karne ke liye risk management strategies jaise ke stop-loss orders ka istemal karna chahiye. Matching High pattern, jaise ke doosray candlestick patterns, ek tool hai faislay ke liye madad karne mein, future price movements ka guarantee nahi hai.
Matching High candlestick pattern ek do-candle pattern hai jo uptrend ke doran hota hai aur price direction mein potential reversal ko indicate karta hai. Traders is pattern ko specific criteria ke liye dekhte hain, jaise ke ek bullish first candle ke baad ek doosri candle jo ke high price mein pehli candle ke high price ke barabar ya bohot qareeb hoti hai, sath hi volume aur confirmation signals, takay is pattern ko pehchan sakein aur uspar action le sakein. Matching High pattern ko doosri technical analysis tools ke saath combine karke traders apne trading decisions ko zyada informed bana sakte hain.
Matching High pattern mein do candles hoti hain. Pehli candle ek bullish candle hoti hai jo market mein buying pressure ko darust karti hai. Is candle ko ek dusri candle follow karti hai jo high price mein pehli candle ke high price ke equal ya bohot qareeb hoti hai. Doosri candle bullish ya bearish ho sakti hai, lekin aam tor par ye buyers aur sellers ke darmiyan ek muqablay ka nateeja hai.

Matching High pattern ko pehchannay ke liye traders ye characteristics dekhtay hain:
- Uptrend: Ye pattern ek uptrend ke doran hota hai, jahan price higher highs aur higher lows bana rahi hoti hai.
- Pehli Bullish Candle: Pattern mein pehli candle ek bullish candle hoti hai jo strong upward move ko darust karti hai. Ye bullish sentiment aur buying pressure ko darust karti hai.
- Doosri Candle ki High: Doosri candle ki high price pehli candle ki high price ke barabar ya bohot qareeb hoti hai. Ye dikhata hai ke price pehlay high level tak pohanch gaya hai jaise pehlay high tak pohanch gaya tha.
- Volume: Behtareen halat mein, pehli candle par volume doosri candle se zyada hoti hai. Ye dikhata hai ke initial bullish move ke doran activity zyada thi.
- Tasdeeq: Traders aksar tasdeeq ke liye intezaar kartay hain pehle action lenay se pehlay is pattern par. Tasdeeq ek bearish candle ke form mein aati hai jo doosri candle ke low ke neeche close hoti hai ya ek bearish reversal pattern ke form mein aati hai Matching High pattern ke baad.
Traders Matching High pattern ko aur bhi technical analysis tools aur indicators ke saath istemal karte hain takay iski reliability zyada ho. Kuch common strategies shamil hain:
- Volume ke saath Tasdeeq: Traders high volume ko dekhtay hain pehli candle par, jo ke strong buying interest ko darust karta hai. Doosri candle ke attempt ko dekhte hue higher volume ka na hona weakness ko dikhata hai aur potential reversal ko indicate karta hai.
- Support aur Resistance Levels: Traders strong resistance aur support levels ko consider karte hain pehli candle ki high ke paas. Agar price ek strong resistance level ko break nahi kar pata jo pehli candle ki high se darust hota hai, to ye reversal ke liye strong case banata hai.
- Indicators ke saath Divergence: Traders oscillators jaise ke Relative Strength Index (RSI) ya Moving Average Convergence Divergence (MACD) ka istemal karte hain takay price aur momentum ke darmiyan divergence ko dekh sakein. In indicators par bearish divergence Matching High pattern ke saath ek reversal signal ko enhance karta hai.
- Candlestick Patterns: Traders Matching High pattern ke baad bearish reversal candlestick patterns ko dekhte hain, jaise ke Bearish Engulfing pattern ya Evening Star pattern. Ye patterns ek potential reversal ko further confirm karte hain.
Yaad rakhiye ke koi bhi trading pattern ya signal 100% sahi nahi hota, aur traders ko hamesha apne capital ko protect karne ke liye risk management strategies jaise ke stop-loss orders ka istemal karna chahiye. Matching High pattern, jaise ke doosray candlestick patterns, ek tool hai faislay ke liye madad karne mein, future price movements ka guarantee nahi hai.
Matching High candlestick pattern ek do-candle pattern hai jo uptrend ke doran hota hai aur price direction mein potential reversal ko indicate karta hai. Traders is pattern ko specific criteria ke liye dekhte hain, jaise ke ek bullish first candle ke baad ek doosri candle jo ke high price mein pehli candle ke high price ke barabar ya bohot qareeb hoti hai, sath hi volume aur confirmation signals, takay is pattern ko pehchan sakein aur uspar action le sakein. Matching High pattern ko doosri technical analysis tools ke saath combine karke traders apne trading decisions ko zyada informed bana sakte hain.


تبصرہ
Расширенный режим Обычный режим