How to Detect Down trend in Forex Trading
Forex trading mein downtrend ko detect karna important hai taake traders sahi time pe sell positions le sakein aur market trends ko samajh sakein. Yahan kuch steps hain jinse aap downtrend ko detect kar sakte hain:

What is the best trend indicator for forex
Forex trading mein best trend indicator ko chunna mushkil ho sakta hai kyunki har trader ka trading style aur preference alag hota hai. Lekin kuch popular trend indicators hain jo traders kaafi istemal karte hain:
Down trend in Forex Trading ko kesay calculate kiya jaay
Forex trading mein downtrend ko calculate karne ke liye kuch steps hote hain jo traders istemal karte hain:
Forex trading mein downtrend ko detect karna important hai taake traders sahi time pe sell positions le sakein aur market trends ko samajh sakein. Yahan kuch steps hain jinse aap downtrend ko detect kar sakte hain:
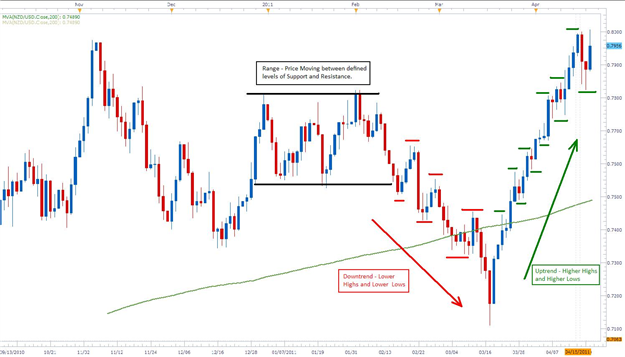
- Price Action Analysis (Keemat ki Karwai Ka Tafteesh): Price action analysis se aap market ke price movements ko samajh sakte hain. Downtrend mein, consecutive lower highs aur lower lows dekhe ja sakte hain. Agar current price previous low se neeche ja raha hai, toh ye downtrend ka indication ho sakta hai.
- Moving Averages (Hilne Wale Averages): Moving averages ka istemal bhi downtrend detect karne mein kiya ja sakta hai. Jaise keh 50-day moving average agar 200-day moving average se neeche ja raha hai aur price bhi moving averages ke neeche hai, toh ye downtrend ka signal ho sakta hai.
- Indicator ki Madad Se: Technical indicators jaise keh MACD, RSI, aur Stochastic Oscillator bhi downtrend ko detect karne mein madadgar ho sakte hain. Agar MACD ka signal line histogram ke neeche ja raha hai ya RSI overbought zone se neeche aa raha hai, toh ye downtrend ka indication ho sakta hai.
- Volume Analysis (Hissa Ki Karwai Ka Tafteesh): Volume analysis bhi downtrend ko detect karne mein helpful ho sakta hai. Agar price ke saath volume bhi neeche ja raha hai, toh ye downtrend ka sign ho sakta hai.
- Support aur Resistance Levels (Sahara aur Rukawat Ke Levels): Market ke support aur resistance levels ko observe karna bhi important hai. Agar price support level ko break kar raha hai aur neeche ja raha hai, toh ye downtrend ka indication ho sakta hai.
- Trend Lines (Trend Rekhaen): Trend lines ka use karke bhi downtrend ko identify kiya ja sakta hai. Agar price trend line ko neeche se break kar raha hai aur uske neeche ja raha hai, toh ye downtrend ka signal ho sakta hai.
What is the best trend indicator for forex
Forex trading mein best trend indicator ko chunna mushkil ho sakta hai kyunki har trader ka trading style aur preference alag hota hai. Lekin kuch popular trend indicators hain jo traders kaafi istemal karte hain:
- Moving Averages (Hilne Wale Averages): Moving averages (like Simple Moving Average, Exponential Moving Average) ek popular trend indicator hai. Ye price ke historical data ka average calculate karta hai aur trend direction ko show karta hai.
- MACD (Moving Average Convergence Divergence): MACD ek powerful trend indicator hai jo price ki momentum aur trend direction ko measure karta hai. Histogram aur signal line ke saath MACD ka use trend confirmation mein kiya ja sakta hai.
- RSI (Relative Strength Index): RSI market mein overbought aur oversold conditions ko detect karta hai. Agar RSI high hai, toh market overbought ho sakti hai aur agar low hai, toh oversold ho sakti hai, jo trend reversal ka signal ho sakta hai.
- ADX (Average Directional Index): ADX market trend ki strength ko measure karta hai. ADX ki high value strong trend ko indicate karti hai aur low value choppy market ko show karti hai.
- Ichimoku Cloud: Ichimoku Cloud ek complex indicator hai jo trend direction, support aur resistance levels, aur entry/exit points ko show karta hai. Ismein Kumo Cloud, Tenkan-sen, Kijun-sen jaise components hote hain.
- Parabolic SAR: Parabolic SAR price aur trend direction ko track karta hai. Agar dots price ke upar hain, toh uptrend indicate karta hai aur agar neeche hain, toh downtrend ko show karta hai.
Down trend in Forex Trading ko kesay calculate kiya jaay
Forex trading mein downtrend ko calculate karne ke liye kuch steps hote hain jo traders istemal karte hain:
- Price Analysis (Keemat ki Karwai Ka Tafteesh): Downtrend ko calculate karne ka pehla step hota hai market ke price movements ko analyze karna. Downtrend mein, consecutive lower highs aur lower lows dekhe ja sakte hain.
- Moving Averages (Hilne Wale Averages): Moving averages ka use karke bhi downtrend ko calculate kiya ja sakta hai. Agar short-term moving average (jaise 50-day) long-term moving average (jaise 200-day) se neeche ja rahi hai, toh ye downtrend ka indication ho sakta hai.
- Trend Lines (Trend Rekhaen): Trend lines ka use karke bhi downtrend ko calculate kiya ja sakta hai. Agar price trend line ko neeche se break kar rahi hai aur trend line ke neeche ja rahi hai, toh ye downtrend ka signal ho sakta hai.
- Volume Analysis (Hissa Ki Karwai Ka Tafteesh): Volume analysis bhi downtrend ko calculate karne mein madadgar ho sakta hai. Agar price ke saath volume bhi neeche ja raha hai, toh ye downtrend ka indication ho sakta hai.
- Indicator ka Istemal: Technical indicators jaise RSI (Relative Strength Index), MACD (Moving Average Convergence Divergence), aur ADX (Average Directional Index) ka use karke bhi downtrend ko calculate kiya ja sakta hai. In indicators ki readings ke saath downtrend ke signals milte hain.
- Support aur Resistance Levels (Sahara aur Rukawat Ke Levels): Market ke support aur resistance levels ko observe karna bhi important hai downtrend ko calculate karne mein. Agar price support level ko break kar rahi hai aur neeche ja rahi hai, toh ye downtrend ka signal ho sakta hai.

تبصرہ
Расширенный режим Обычный режим