Triple Bottom Pattern
No announcement yet.
X
  • وقت
  • دکھائیں
Clear All
new posts
  • #16 Collapse

    Triple Bottom Pattern :

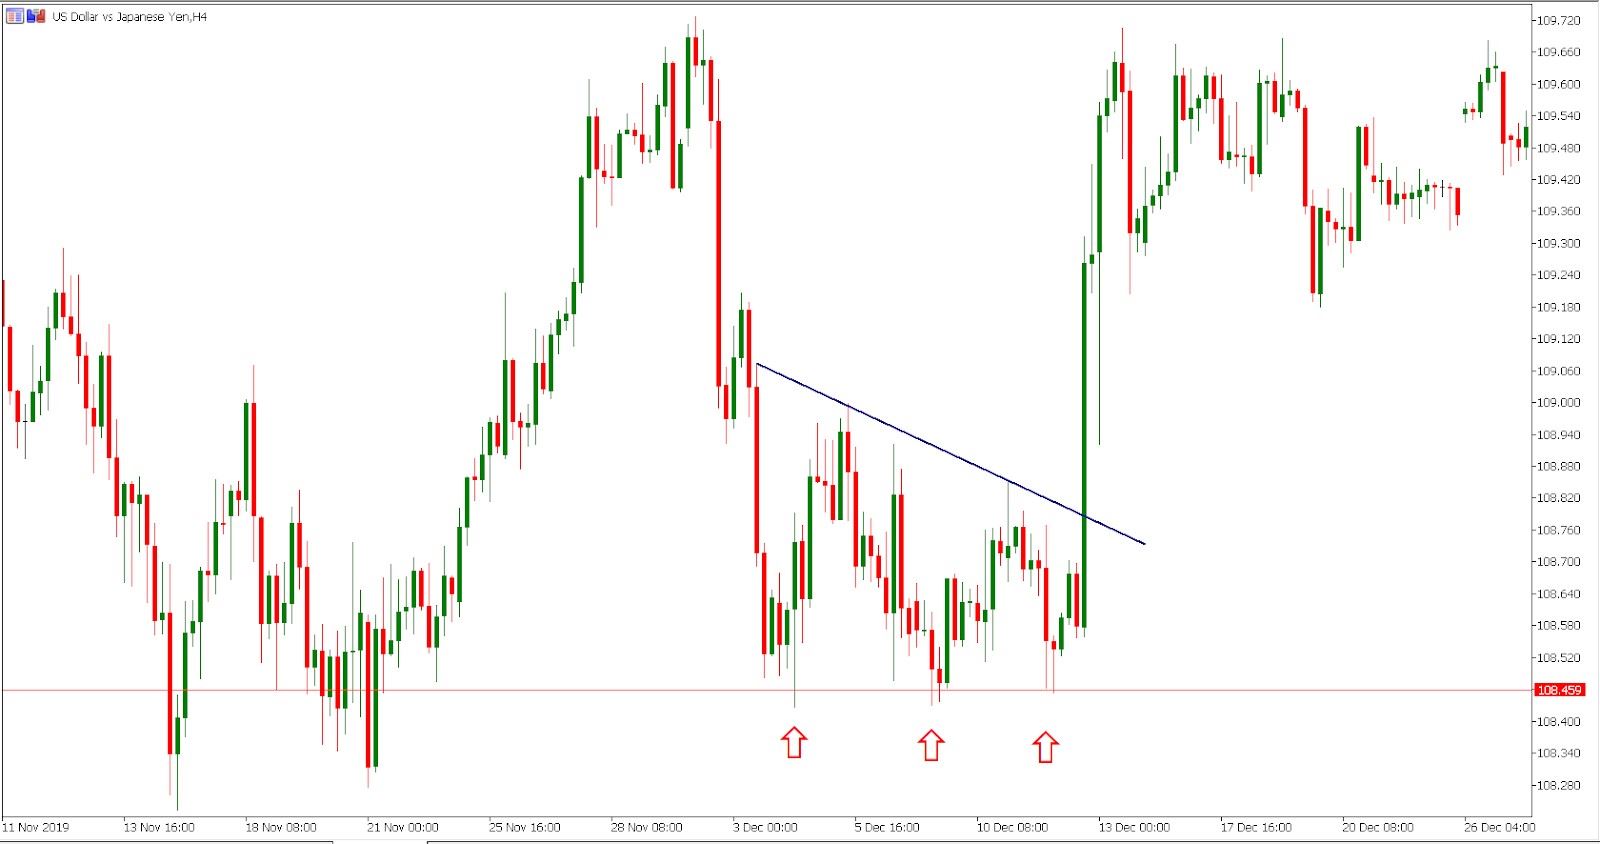
    Triple bottom pattern ek technical analysis pattern hai jo stock market mein dekha jaata hai. Is pattern mein price chart par ek specific formation hoti hai, jismein ek stock ya asset ke price mein teen baar bottoming out ya support level reach hota hai. Har bottoming out ke baad price bounce back karta hai, indicating a potential trend reversal or support level.
    Yeh pattern typically downtrend ke baad dekha jaata hai aur bullish reversal signal provide karta hai. Jab price ek support level tak pahunchta hai aur ussey bounce back karta hai, tab ek bottom formation hoti hai. Jab yeh process teen baar repeat hoti hai, tab triple bottom pattern complete hota hai.

    Identify Triple Bottom Pattern :

    Triple bottom pattern ko traders aur investors use karte hain to identify potential buying opportunities. Jab price third time support level tak pahunchta hai aur ussey bounce back karta hai, tab yeh ek bullish signal samjha jaata hai, indicating ki price ab upar ki taraf move kar sakta hai.

    Yeh pattern market analysis mein use kiya jaata hai, lekin iska success rate aur effectiveness depend karti hai market conditions aur other factors par. Always remember to do thorough research aur analysis before making any trading decisions.

    Trading with Triple Bottom Pattern :

    Triple bottom pattern ke sath trading karne ke liye kuch steps follow kar sakte hain:
    1. Identify the Pattern:

    Sabse pehle, price chart par triple bottom pattern ko identify karein. Yeh pattern teen baar bottoming out ya support level reach karta hai. Isko spot karne ke liye price levels aur chart patterns ko closely observe karein.

    2. Confirm the Pattern:

    Triple bottom pattern ko confirm karne ke liye, volume aur price movement ko bhi analyze karein. Volume ki increase aur price ke consistent bounces pattern ko validate karte hain.

    3. Entry Point Determine karein:

    Entry point ko determine karne ke liye, price breakout ka wait karein. Jab price third time support level se upar jaata hai aur breakout karne lagta hai, tab entry point ko consider karein.

    4. Stop Loss aur Target Set karein:

    Har trade mein stop loss aur target set karna zaroori hai. Stop loss level ko determine karein, jisse aap apni loss ko control kar sakein. Target level ko set karein, jisse aap profit book kar sakein.

    5. Monitor karein aur Adjust karein:

    Trade ko monitor karte rahein aur market conditions ko closely observe karein. Agar price movement aapke expectations ke against ja raha hai, toh adjust karein ya trade ko exit kar dein.

    Yeh steps general guidelines hai, lekin har trader ki strategy aur risk tolerance alag hoti hai. Apne trading plan ko develop karein aur apni research aur analysis par depend karein. Trading mein hamesha cautious aur disciplined rahein.

    • <a href="https://www.instaforex.org/ru/?x=ruforum">InstaForex</a>
    • #17 Collapse

      Triple Bottom Pattern?


      Click image for larger version

Name:	download (2).jpeg
Views:	22
Size:	8.5 کلوبائٹ
ID:	12902290


      **Triple Bottom Pattern**
      **Triple Bottom Pattern Kya Hai?**
      Triple bottom pattern ek bullish reversal pattern hai jo market mein downtrend ke baad dikhai deta hai. Is pattern mein price teen baar ek neeche ki taraf jaata hai phir se upar chala jaata hai. Yeh ek strong buying signal hai jisme traders ko uptrend ki shuruat ka indication milta hai.

      **Formation**
      1. **First Bottom (Pehla Neecha Point):** Pehla bottom jab price downtrend mein neeche girti hai aur ek level tak pohochti hai jise support zone kehte hain.
      2. **Pullback (Upar Ki Taraf Harkat):** Price ka pullback hota hai jisme thoda upar ki taraf move hota hai.
      3. **Second Bottom (Dusra Neecha Point):** Dusra bottom phir se pehle wale support zone ya uske paas hota hai, lekin pehle se kam intensity ke sath.
      4. **Third Bottom (Teesra Neecha Point):** Teesra bottom bhi pehle wale support zone ke paas hota hai, lekin pehle do bottoms se thoda upar hota hai.
      5. **Breakout (Uptrend Shuru Hona):** Jab price teesri baar se support zone tak pohochti hai aur usse upar chali jaati hai, to yeh breakout ka signal hota hai jo uptrend ki shuruaat ka sanket hai.

      **Trading Strategies**
      1. **Entry Point:** Traders is pattern ko confirm hone ke baad enter karte hain jab price teesri baar se support zone ko cross karta hai.
      2. **Stop Loss:** Stop loss neeche pehle bottom ke neeche rakha jaata hai, taaki agar pattern galat prove ho, to loss minimize ho sake.
      3. **Target:** Target price ko calculate kiya jaata hai pehle bottom se teesre bottom tak ka distance dekhte hue.

      **Benefits**
      - Is pattern ka use karke traders trend reversal ko early stage mein identify kar sakte hain.
      - Risk ko minimize karne mein help karta hai stop loss ka placement.
      - High probability of success ke saath profitable trades generate karne mein madad karta hai.

      **Conclusion**
      Triple bottom pattern ek powerful bullish reversal pattern hai jo traders ko uptrend ki shuruaat ka indication deta hai. Isko samajh kar aur sahi tareeke se trade karke traders consistent profits generate kar sakte hain.
      • <a href="https://www.instaforex.org/ru/?x=ruforum">InstaForex</a>
      • #18 Collapse

        Triple Bottom Pattern ek ahem technical analysis pattern hai forex market mein, jo ek downtrend ka potential reversal signal deta hai. Ye pattern tab banta hai jab teeno distinct bottoms(yaani ki troughs ek aas paas ke price level par bante hain, aur phir ek resistance level ke breakout ke baad dikhai deta hai. Traders is pattern ko aksar dhundte hain kyun ke ye bearish se bullish market sentiment mein tabdeeli ki nishaani ho sakti hai.

        Triple Bottom Pattern Ki Formation
        Triple Bottom Pattern aam tor par ek lambi downtrend ke baad banta hai, jo ek consolidation aur selling pressure ka potential exhaustion dikhata hai. Is pattern mein teen bottoms ya troughs hote hain, jinmein har bottom ek similar price level par banta hai, ek horizontal support level ko bana ke. Is pattern ke teen bottoms ke beech ki price action aksar W shape mein hoti hai, jo buyers aur sellers ke darmiyan ek jang ka nishaan hai.
        1. Pehla Bottom: Pattern ek sharp price decline se shuru hota hai, jismein selling pressure kam hone lagta hai. Ye pehla bottom pattern ka shuru ka point hai.
        2. Rally aur Retest: Pehle bottom ke baad, price mein ek chhota sa rally hota hai, jo thoda sa buying interest dikhata hai. Magar ye rally aksar ek retracement ke saath hota hai, jo pehle bottom ke level tak retest karta hai.
        3. Dusra Bottom: Retracement se dusra bottom banta hai, jo pattern ko confirm karne mein ahem hota hai. Ye bottom ideally pehle bottom ke level ya uske nazdeek hota hai, ek strong support zone ko highlight karte hue.
        4. Dusra Rally aur Retest: Dusra bottom ke baad, ek aur rally attempt hoti hai, jo zyada buying momentum ko dikhata hai. Magar jaise pehli rally, ye bhi resistance se guzarta hai aur support level ko retest karta hai.
        5. Teesra Bottom: Retest se teesra aur aakhri bottom banta hai, jo aam tor par pehle do bottoms ke level ke nazdeek hota hai. Ye level ab ek ahem support zone ban jata hai.
        Triple Bottom Pattern Ki Identification
        Traders Triple Bottom Pattern ko sahi taur par identify karne ke liye kuch criteria istemal karte hain:
        1. Price Levels: Bottoms ka price relatively similar hona chahiye, ek horizontal support level banate hue. Thoda sa price variation acceptable hai, magar zyada deviate nahi hona chahiye.
        2. Volume: Volume analysis pattern ko confirm karne mein ahem hota hai. Aam tor par volume pattern ke formation ke dauran decrease hota hai, jo ek selling pressure ki kami aur potential accumulation ko dikhata hai.
        3. Rally aur Retest: Traders ek clear rally ko dekhte hain har bottom ke baad, jiska baad ek support level ka retest hota hai. Ye retests support zone ki strength ko validate karte hain.
        4. Breakout Confirmation: Pattern tab confirm hota hai jab price resistance level ke upar breakout karta hai, jo bottoms ke peaks ke beech mein banta hai. Ye breakout aksar increased volume ke saath hota hai, jo market sentiment mein shift ko dikhata hai.
        Triple Bottom Pattern Ka Significance
        Triple Bottom Pattern traders ke liye ahem implications rakhta hai:
        1. Reversal Signal: Pattern ek potential downtrend reversal signal deta hai, jo selling pressure ka khatma aur buying interest ka aagaz dikhata hai.
        2. Support Zone: Teen bottoms ek strong support zone banate hain, jo ek price level ko highlight karta hai jahan buyers market mein dakhil ho sakte hain, aur prices mein bounce dikh sakti hai.
        3. Breakout Opportunity: Traders aksar breakout ke baad long positions enter karte hain, jo pattern ko confirm karta hai. Wo stop-loss orders support zone ke neeche lagate hain risk management ke liye.
        4. Price Target: Analysts pattern ke height (low aur resistance level ke beech ka distance) ko estimate karte hain, jisse bullish move ke liye ek price target milta hai breakout ke baad.


        Triple Bottom Pattern Ke Saath Trading Strategies
        Traders Triple Bottom Pattern ke saath mukhtalif strategies istemal karte hain:
        1. Breakout par Entry: Kuch traders breakout ke baad long positions enter karte hain, jo pattern ko confirm karta hai. Wo stop-loss orders support zone ke neeche lagate hain risk management ke liye.
        2. Indicators ke Saath Confirmation: Traders technical indicators jaise ki Relative Strength Index (RSI) ya Moving Averages ka istemal karte hain pattern ki validity ko confirm karne aur apne entry decisions ko mazboot karne ke liye.
        3. Volume Confirmation: Pattern ke formation aur breakout ke dauran volume trends ka analysis additional confirmation provide karta hai reversal ke liye.
        4. Targets Ka Measurement: Traders aksar price targets calculate karte hain pattern ke height ko breakout level mein add karke, jo potential profit-taking ke liye ek target provide karta hai.
        Example in forex
        1. Downtrend: EUR/USD pair ek lambi downtrend mein hai, ek low point tak pahunch kar jahan pehla bottom banta hai.
        2. Rally aur Retest: Pehle bottom ke baad, thoda sa rally hota hai, jo thoda sa buying interest dikhata hai. Magar ye rally aksar ek retracement ke saath hota hai, jisse support level ko retest karta hai.
        3. Second Rally aur Retest: Ek aur rally attempt hoti hai, jo teesra bottom banata hai, Triple Bottom Pattern ko confirm karte hue.
        4. Breakout: Jab price bottoms ke peaks ke beech ke resistance level ko paar karta hai, traders long positions enter kar sakte hain, ek pattern ke height ke basis par ek price target set karte hue.
        Triple Bottom Pattern ek taqatwar technical analysis tool hai jo forex traders istemal karte hain potential trend reversals aur entry opportunities ko identify karne ke liye. Iske formation, validation criteria, aur implications market sentiment aur price action mein valuable insights provide karte hain. Triple Bottom Pattern ko identify, confirm, aur trade karne ka samajhna, traders ke trading strategies ko enhance karta hai aur forex market mein trend reversal opportunities ko capitalize karne mein madad karta hai.
        Believe in yourself and your abilities. When you fight for your dreams, you can achieve anything.

        اب آن لائن

        Working...
        X