Takuri candlestick pattern trading mein aik ahem rehnumai hawala hai jo ke technical analysis mein istemal hoti hai. Ye pattern aam tor par jab ek downtrend ka ikhtetam hota hai to nazar aata hai aur ek mukhtalif pesh-e-nazar ko samjhnay ke liye traders ko candlestick charting, technical analysis, aur financial markets mein price action ko tajziya karna aana chahiye.
Takuri Candlestick Pattern
Candlestick charting ek popular method hai jo traders istemal karte hain taake wo financial markets mein price movements ka tajziya kar sakein, jaise ke stocks, forex, commodities, aur cryptocurrencies mein. Har candlestick aik khaas time period ko darust karta hai, jaise ke ek din, ek ghanta, ya ek minute, jo chart ka timeframe hota hai.

Aam tor par ek candlestick ke char mukhtalif hisse hote hain:
Candlesticks ko visually rectangles aur lines ke zariye darust kiya jata hai, jinhe wicks ya shadows kehte hain, jo ke top aur bottom se extend hoti hain. Candlestick ka body rectangle filled hota hai agar closing price opening price se kam hai bearish candle ko indicate karta hai aur empty ya white hota hai agar closing price opening price se zyada hai bullish candle ko indicate karta hai.
Takuri Candlestick Pattern
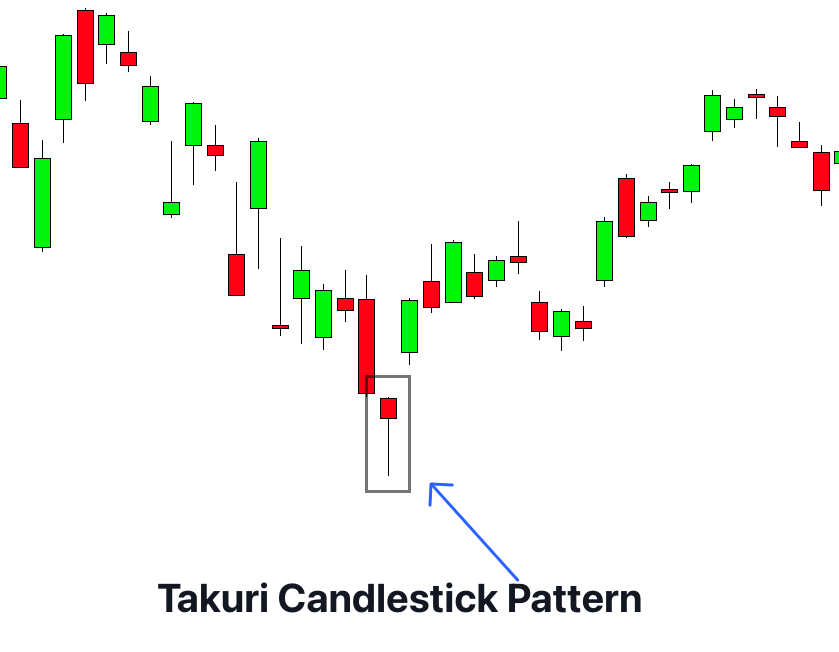
Takuri pattern ek aham pattern hai jo ke technical analysis mein kaafi ahem hai, lekin ye traders ke liye faydemand ho sakta hai jo iske asar ko samajhte hain. Ye pattern aik reversal pattern hai jo ke ek downtrend ke ikhtetam par nazar aata hai aur ek potential reversal ko indicate karta hai. Takuri pattern ko samajhna candlestick charting, technical analysis, aur financial markets mein price action ko samajhne ke zaroori asoolon ko samajhne par mushtamil hai.
Yahan takuri pattern ke kuch ahem characteristics hain:
Traders Takuri pattern ko ek potential buying opportunity ke taur par samajhte hain ek downtrend ke baad. Pehle candlestick ka lamba lower shadow dikhata hai ke sellers ne prices ko bohot giraya, lekin buyers ne period ke ikhtetam par prices ko wapas upar le jaane mein madad ki. Is battle mein buyers aur sellers ke darmiyan near lows of the downtrend ek possible market sentiment change ka indication hota hai.
Pehle candlestick ka chhota real body indecision ya temporary equilibrium ko dikhata hai buyers aur sellers ke darmiyan. Ye dikhata hai ke na to kisi side ka poora control tha us period mein, jo ke aksar ek reversal ke liye prelude ke tor par dekha jata hai.
Follow-up bullish candlesticks jo Takuri pattern ko confirm karte hain, increasing buying interest aur upward momentum ko dikhate hain. Traders aage ki candlesticks mein continued strength ke signs ko dekhte hain, jaise ke higher closes aur bullish patterns jaise ke bullish engulfing ya bullish harami.

Trading Strategies with the Takuri Pattern
Traders Takuri pattern ko apne trading strategies mein mukhtalif tareeqon se istemal kar sakte hain. Yahan kuch aam approaches hain:
Jab Takuri pattern ka istemal karte hain to zaroori hai ke traders isko other technical aur fundamental analysis tools ke sath istemal karein. Traders ko market conditions, news events, aur overall trend direction ko bhi consider karna chahiye trading decisions ko lenay se pehle candlestick patterns par depend na karein.
Additionally, false signals bhi ho sakte hain, jahan Takuri pattern appear hota hai lekin expected reversal nahi hota. Is baat ka zikar hai ke risk management aur confirmation from other indicators ya patterns ka istemal ahem hai. Takuri candlestick pattern ek aham technical analysis tool hai jo traders ko potential reversals ko identify karne mein madad karta hai downtrends ke baad. Is pattern ke characteristics ko samajh kar, price action ko interpret karke, aur doosri trading techniques ke sath istemal karke, traders Takuri pattern ko apne strategies mein incorporate kar sakte hain improved decision-making aur risk management ke liye financial markets mein.
Takuri Candlestick Pattern
Candlestick charting ek popular method hai jo traders istemal karte hain taake wo financial markets mein price movements ka tajziya kar sakein, jaise ke stocks, forex, commodities, aur cryptocurrencies mein. Har candlestick aik khaas time period ko darust karta hai, jaise ke ek din, ek ghanta, ya ek minute, jo chart ka timeframe hota hai.
Aam tor par ek candlestick ke char mukhtalif hisse hote hain:
- Open: Price jis rate par time period ke shuru mein open hota hai.
- High: Sab se zyada price jo time period ke dauran pohnchti hai.
- Low: Sab se kam price jo time period ke dauran pohnchti hai.
- Close: Price jis rate par time period ke ikhtetam par band hota hai.
Candlesticks ko visually rectangles aur lines ke zariye darust kiya jata hai, jinhe wicks ya shadows kehte hain, jo ke top aur bottom se extend hoti hain. Candlestick ka body rectangle filled hota hai agar closing price opening price se kam hai bearish candle ko indicate karta hai aur empty ya white hota hai agar closing price opening price se zyada hai bullish candle ko indicate karta hai.
Takuri Candlestick Pattern
Takuri pattern ek aham pattern hai jo ke technical analysis mein kaafi ahem hai, lekin ye traders ke liye faydemand ho sakta hai jo iske asar ko samajhte hain. Ye pattern aik reversal pattern hai jo ke ek downtrend ke ikhtetam par nazar aata hai aur ek potential reversal ko indicate karta hai. Takuri pattern ko samajhna candlestick charting, technical analysis, aur financial markets mein price action ko samajhne ke zaroori asoolon ko samajhne par mushtamil hai.
Yahan takuri pattern ke kuch ahem characteristics hain:
- Downtrend: Takuri pattern ek lambi downtrend ke baad nazar aata hai, jahan sellers ka control hota hai.
- Lambi Lower Shadow: Takuri pattern ka pehla candlestick ek lambi lower shadow ke sath hota hai, jo ke yeh dikhata hai ke prices ne period ke dauran bohot girawat ki, lekin ikhtetam par prices wapas aagayi aur near opening price par band hui.
- Small Real Body: Pehle candlestick ka body relatively chhota hota hai lower shadow ke comparison mein, jo ke indecision ya buyers aur sellers ke darmiyan ek muqabla ko dikhata hai.
- Follow-up Candlesticks: Takuri pattern ke baad aam tor par ek ya zyada bullish candlesticks aate hain, jo ke reversal signal ko confirm karte hain. Ye candles increasing buying pressure aur higher closing prices ko dikhate hain.
Traders Takuri pattern ko ek potential buying opportunity ke taur par samajhte hain ek downtrend ke baad. Pehle candlestick ka lamba lower shadow dikhata hai ke sellers ne prices ko bohot giraya, lekin buyers ne period ke ikhtetam par prices ko wapas upar le jaane mein madad ki. Is battle mein buyers aur sellers ke darmiyan near lows of the downtrend ek possible market sentiment change ka indication hota hai.
Pehle candlestick ka chhota real body indecision ya temporary equilibrium ko dikhata hai buyers aur sellers ke darmiyan. Ye dikhata hai ke na to kisi side ka poora control tha us period mein, jo ke aksar ek reversal ke liye prelude ke tor par dekha jata hai.
Follow-up bullish candlesticks jo Takuri pattern ko confirm karte hain, increasing buying interest aur upward momentum ko dikhate hain. Traders aage ki candlesticks mein continued strength ke signs ko dekhte hain, jaise ke higher closes aur bullish patterns jaise ke bullish engulfing ya bullish harami.
Trading Strategies with the Takuri Pattern
Traders Takuri pattern ko apne trading strategies mein mukhtalif tareeqon se istemal kar sakte hain. Yahan kuch aam approaches hain:
- Confirmation with Other Indicators: Traders aksar Takuri pattern ko doosre technical indicators ya chart patterns ke sath istemal karte hain takay potential reversal ko confirm kiya ja sake. Ye indicators trendlines, moving averages, aur oscillators jaise ke Relative Strength Index (RSI) ya Moving Average Convergence Divergence (MACD) shamil ho sakte hain.
- Entry and Exit Points: Traders Takuri pattern ke appearance par long positions (buy trades) enter karte hain, khaaskar agar ye subsequent bullish candlesticks aur doosre technical signals se confirm hota hai. Stop-loss orders ko Takuri candlestick ka low ya recent swing low ke neeche place kiya jata hai takay risk ko manage kiya ja sake. Profit targets technical levels par set kiye ja sakte hain, jaise ke key resistance levels ya Fibonacci extensions ke basis par.
- Risk Management: Jaise ke koi bhi trading strategy, risk management Takuri pattern trading mein bhi ahem hai. Traders ko sahi position sizing ka istemal karna chahiye, stop-loss orders ko potential losses ko limit karne ke liye place karna chahiye, aur ek consistent risk-reward ratio ko follow karna chahiye.
- Timeframe Considerations: Takuri pattern ke effectiveness timeframe ke mutabiq alag ho sakti hai. Kuch traders short timeframes, jaise ke intraday charts, ko prefer karte hain quick trades ke liye, jabke doosre longer timeframes ko significant reversals ke liye dekhte hain.
- Downtrend Confirmation: Shuru mein, ek stock ka price clear downtrend mein hota hai, jahan lower lows aur lower highs chart par visible hote hain.
- Takuri Pattern Formation: Jab downtrend continue hota hai, ek candlestick lamba lower shadow ke sath hoti hai, jo ke ek Takuri pattern ko form karta hai, aur iske baad ek ya zyada bullish candles aati hain jo ke pehle din ke close se zyada close karte hain.
- Confirmation Indicators: Traders doosre indicators ko bhi dekhte hain, jaise ke increasing volume bullish candles ke dauran ya RSI mein bullish divergence, takay reversal ki case ko strengthen kiya ja sake.
- Entry aur Stop-loss: Traders jo Takuri pattern ko spot karte hain wo long positions ko enter karte hain next candlestick ke open par Takuri pattern ke baad, ek stop-loss ko place karte hain Takuri candlestick ka low ya recent swing low ke neeche risk ko manage karne ke liye.
- Profit Target aur Exit: Profit targets technical levels ke basis par set kiye ja sakte hain, jaise ke previous highs ya Fibonacci retracement levels. Traders trailing stop-loss orders bhi use kar sakte hain takay further upside ko capture kiya ja sake agar trend continue hota hai.
Jab Takuri pattern ka istemal karte hain to zaroori hai ke traders isko other technical aur fundamental analysis tools ke sath istemal karein. Traders ko market conditions, news events, aur overall trend direction ko bhi consider karna chahiye trading decisions ko lenay se pehle candlestick patterns par depend na karein.
Additionally, false signals bhi ho sakte hain, jahan Takuri pattern appear hota hai lekin expected reversal nahi hota. Is baat ka zikar hai ke risk management aur confirmation from other indicators ya patterns ka istemal ahem hai. Takuri candlestick pattern ek aham technical analysis tool hai jo traders ko potential reversals ko identify karne mein madad karta hai downtrends ke baad. Is pattern ke characteristics ko samajh kar, price action ko interpret karke, aur doosri trading techniques ke sath istemal karke, traders Takuri pattern ko apne strategies mein incorporate kar sakte hain improved decision-making aur risk management ke liye financial markets mein.


تبصرہ
Расширенный режим Обычный режим