Trade with flag chart pattern

Flag chart pattern ek technical analysis ka concept hai jo market mein price trends ko identify karne ke liye istemal hota hai. Flag pattern ek short-term continuation pattern hota hai, jo ek uptrend ya downtrend ke doran develop hota hai.
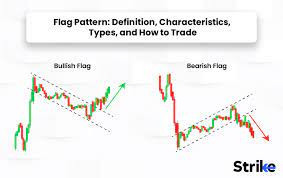
Flag pattern ka naam uski appearance se liya gaya hai, jismein price action ko ek flag ki tarah dekha jata hai. Agar trend upar ki taraf hai, to flag pattern ko "bullish flag" kehte hain, jabke trend niche ki taraf hai to usay "bearish flag" kehte hain.
Bullish Flag:
Bearish Flag:
Traders flag pattern ko identify karke future price movements ko anticipate karte hain, jisse unhe trading opportunities milte hain. Is pattern ko confirm karne ke liye traders typically volume aur other technical indicators ka bhi istemal karte hain.
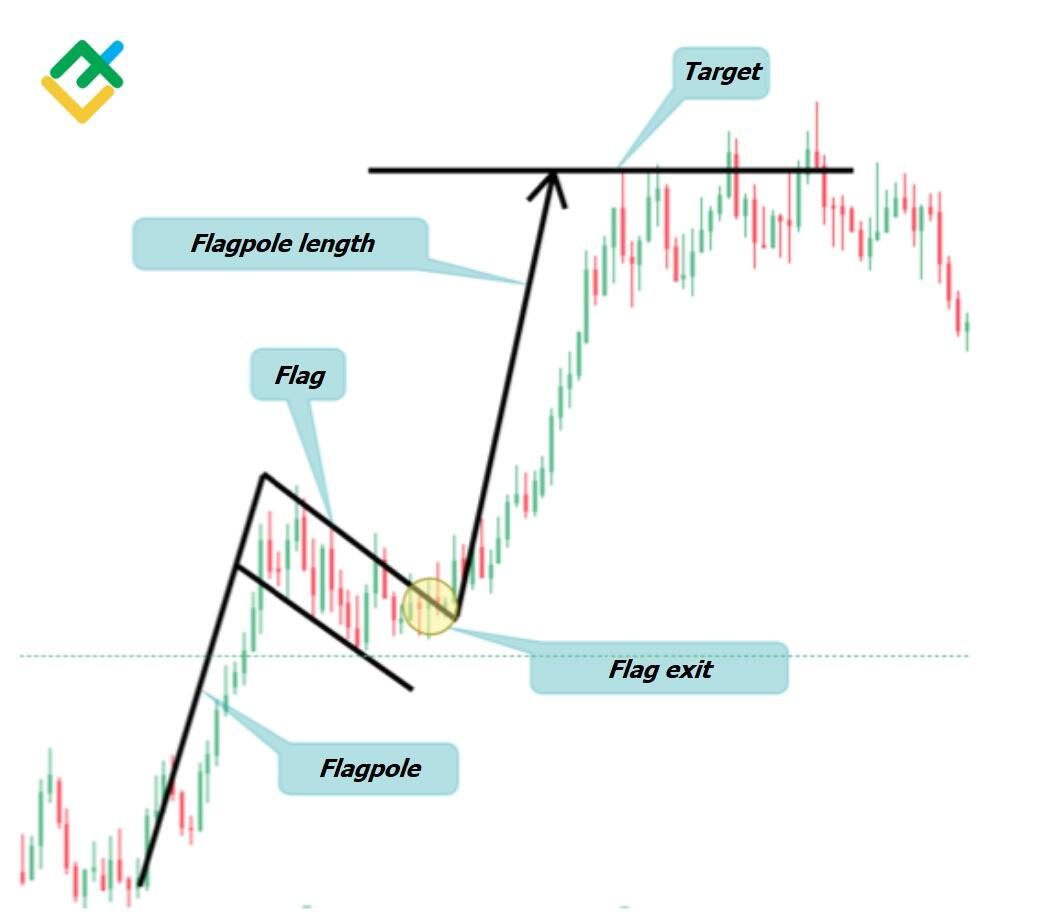
Flag pattern ki trading mein, traders usually flagpole ke breakout ke baad entry karte hain, aur ek stop-loss order rakhte hain just below the low (for bullish flags) ya just above the high (for bearish flags) of the flag pattern, taake in case price moves against the expected direction, loss minimize kiya ja sake. Target price ko flagpole ki height se calculate kiya ja sakta hai.
Flag pattern ek common aur effective technical analysis tool hai jo ke traders ko potential trading opportunities identify karne mein madad karta hai.
Flag chart pattern ek technical analysis ka concept hai jo market mein price trends ko identify karne ke liye istemal hota hai. Flag pattern ek short-term continuation pattern hota hai, jo ek uptrend ya downtrend ke doran develop hota hai.
Flag pattern ka naam uski appearance se liya gaya hai, jismein price action ko ek flag ki tarah dekha jata hai. Agar trend upar ki taraf hai, to flag pattern ko "bullish flag" kehte hain, jabke trend niche ki taraf hai to usay "bearish flag" kehte hain.
Bullish Flag:
- Bullish flag pattern ek upward price trend ke doran hota hai.
- Is pattern mein ek horizontal consolidation phase hota hai, jise flag kehte hain, jise typically kuch days ya weeks tak rehne ki tendency hoti hai.
- Flag formation ke baad, price usually phir se upar ki taraf move karta hai, jo original trend ko continue karta hai.
Bearish Flag:
- Bearish flag pattern ek downward price trend ke doran hota hai.
- Is pattern mein bhi ek horizontal consolidation phase hota hai, jise flag kehte hain, jo kuch days ya weeks tak reh sakta hai.
- Flag formation ke baad, price typically phir se niche ki taraf move karta hai, jo original trend ko continue karta hai.
Traders flag pattern ko identify karke future price movements ko anticipate karte hain, jisse unhe trading opportunities milte hain. Is pattern ko confirm karne ke liye traders typically volume aur other technical indicators ka bhi istemal karte hain.
Flag pattern ki trading mein, traders usually flagpole ke breakout ke baad entry karte hain, aur ek stop-loss order rakhte hain just below the low (for bullish flags) ya just above the high (for bearish flags) of the flag pattern, taake in case price moves against the expected direction, loss minimize kiya ja sake. Target price ko flagpole ki height se calculate kiya ja sakta hai.
Flag pattern ek common aur effective technical analysis tool hai jo ke traders ko potential trading opportunities identify karne mein madad karta hai.


تبصرہ
Расширенный режим Обычный режим