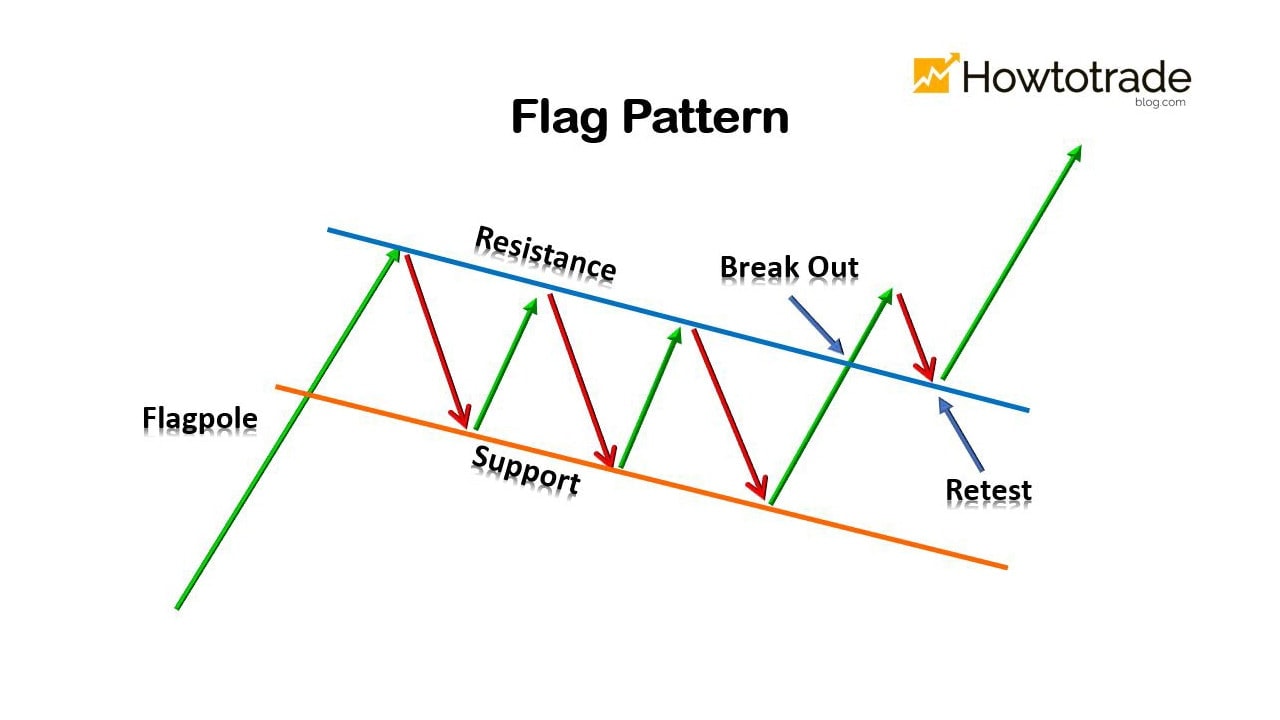
Flag chart patterns, ya technical analysis ke aham tools hain jo traders ko financial markets mein potential trends aur trading opportunities ka pata lagane mein madadgar hoti hain. Ye patterns ek jhanda ki tarah hoti hain, jinhein flagpole aur flag kehte hain. Flagpole initial sharp price move ko darust karta hai, jabke flag ek consolidation period ko darust karta hai jo ke sideways movement ya price swings mein hota hai. Flag chart patterns ke sath trading kaise ki jati hai, ye samajhna traders ke liye faida mand ho sakta hai jo ke price movements ko capitalize karke inform kiye gaye trading decisions lena chahte hain.
Understanding Flag Chart Patterns
Flag chart patterns continuation patterns hote hain jo ke ek strong price move ke baad aate hain, ya toh upward bullish flag ya downward bearish flag direction mein. Flagpole initial sharp price move ko represent karta hai, jabke flag ek opposite direction mein price swings ki series se bana hota hai jo ke consolidation pattern banata hai. Ye consolidation decreasing trading volume ke sath hota hai aur various forms mein ho sakta hai, jaise ke horizontal channel, symmetrical triangle, ya pennant.

- Identifying Bullish and Bearish Flags:
- Bullish Flag: Ek bullish flag pattern mein, flagpole ek upward price surge ko darust karta hai, aur uske baad flag ek trend ke against downward slope karta hai. Ye temporary pause ya correction uptrend mein indicate karta hai, phir potential continuation of the uptrend ke liye.
- Bearish Flag: Ulta, ek bearish flag pattern ek downward price movement flagpole ke baad form hota hai, aur uske baad flag ek trend ke against upward slope karta hai. Ye temporary pause ya correction downtrend mein indicate karta hai, phir potential continuation of the downtrend ke liye.
- Entry and Exit Strategies: Traders typically entry aur exit points ko dhundte hain jab flag chart patterns ke sath trading karte hain:
- Entry: Traders ek trade mein enter kar sakte hain jab price flag pattern se bahar breakout karta hai prevailing trend ke direction mein. Maslan, bullish flag mein, ek entry point upper trendline ke above ho sakta hai flag pattern ke, jo ke uptrend ke potential continuation ko indicate karta hai.
- Exit: Traders aksar technical indicators ya price targets ka istemal exit strategy tay karte hain. Misal ke taur par, ek trader height of the flagpole ke base pe ek profit target set kar sakta hai ya phir ek trailing stop-loss ka istemal karke profits ko lock kar sakta hai jab price unki favor mein move karta hai.
- Risk Management: Risk management flag patterns ya kisi bhi technical analysis pattern ke sath trading karte waqt zaroori hai. Traders ko ye consider karna chahiye:
- Stop-loss: Ek stop-loss lagana flag pattern ke low ke neeche bullish flags ke liye ya flag pattern ke high ke above bearish flags ke liye potential losses ko limit karne mein madad karta hai agar trade expectations ke against jaye.
- Position Size: Position size ko risk tolerance aur account size ke base pe calculate karna zaroori hai taake har trade ka exposure effectively manage kiya ja sake.
- Trading Strategies with Flag Patterns:
- Breakout Trading: Ek common strategy ye hai ke flag pattern se breakout ka wait karna aur phir breakout ke direction mein trade mein enter karna.
- Pullback Trading: Kuch traders prefer karte hain ke flag pattern ke support ya resistance level ka wait karein jab tak ek pullback na ho aur phir trade mein enter karein, flag pattern ko aur technical indicators ke sath combine karke confirmation ke liye.
- Volume Analysis: Flag pattern ke formation aur breakout ke doran trading volume ko monitor karna additional confirmation provide kar sakta hai trade ki validity ke liye.
- Example Trade Scenario: Chaliye ek example consider karte hain trading ka ek bullish flag pattern ke sath stock mein:
- Pattern Ko Identify Karein: Ek strong uptrend ke baad flagpole, stock ek downward-sloping flag pattern form karta hai.
- Entry Point: Traders trade mein enter kar sakte hain jab stock flag pattern ke upper trendline se breakout karta hai increased volume ke sath, jo ke uptrend ke potential continuation ko indicate karta hai.
- Exit Strategy: Traders ek profit target set kar sakte hain flagpole ke height ke base pe ya phir ek trailing stop-loss ka istemal karke profits ko protect kar sakte hain jab stock price upward move karta hai.


تبصرہ
Расширенный режим Обычный режим