Falling Three Methods ek candlestick pattern hai jo ke technical analysis mein istemal hota hai, khaaskar stock trading, forex (foreign exchange) markets, aur doosre trading environments mein jahan candlestick charts ka istemal hota hai. Ye pattern ek bearish continuation pattern hai, jo ke ek potential downward movement ko indicate karta hai prices mein ek chhoti si consolidation ya pause ke baad. Falling Three Methods pattern ko samajhna traders ke liye ahem hai kyunki ye market sentiment aur future price movements ke bare mein insights provide kar sakta hai.
Overview of Candlestick Patterns
Falling Three Methods pattern ke bare mein gehra samajhne se pehle, candlestick patterns ki bunyadi maloomat ko samajhna faida mand hai. Candlestick charts ek mukhtalif time period mein, jaise ke minutes, hours, days, ya weeks mein price movements ko dikhate hain. Har candlestick ek specific time period ki open, high, low, aur close prices ko represent karta hai. Candlestick patterns candlesticks ke arrangement ke basis par bante hain, jo bullish ya bearish market sentiment ko signal kar sakte hain.
Components of the Falling Three Methods Pattern
Falling Three Methods pattern ko charhaktar karte hain aath candlesticks, jo ke aam tor par ek downtrend ke dauran dekha jata hai. Yahan is pattern ke key components hain:
Falling Three Methods pattern ka tabeer market sentiment aur buyers aur sellers ke darmiyan ladhayi ke concept par mabni hai. Yahan traders is pattern ko kaise analyze karte hain:
Interpretation of the Falling Three Methods Pattern
Traders Falling Three Methods pattern ko apne trading decisions mein incorporate karne ke liye various strategies ka istemal karte hain. Yahan kuch common approaches hain:
Jab bhi Falling Three Methods pattern ya koi bhi technical pattern ko use kiya jaata hai, to limitations aur other factors ko bhi consider karna zaroori hai:
Overview of Candlestick Patterns
Falling Three Methods pattern ke bare mein gehra samajhne se pehle, candlestick patterns ki bunyadi maloomat ko samajhna faida mand hai. Candlestick charts ek mukhtalif time period mein, jaise ke minutes, hours, days, ya weeks mein price movements ko dikhate hain. Har candlestick ek specific time period ki open, high, low, aur close prices ko represent karta hai. Candlestick patterns candlesticks ke arrangement ke basis par bante hain, jo bullish ya bearish market sentiment ko signal kar sakte hain.
Components of the Falling Three Methods Pattern
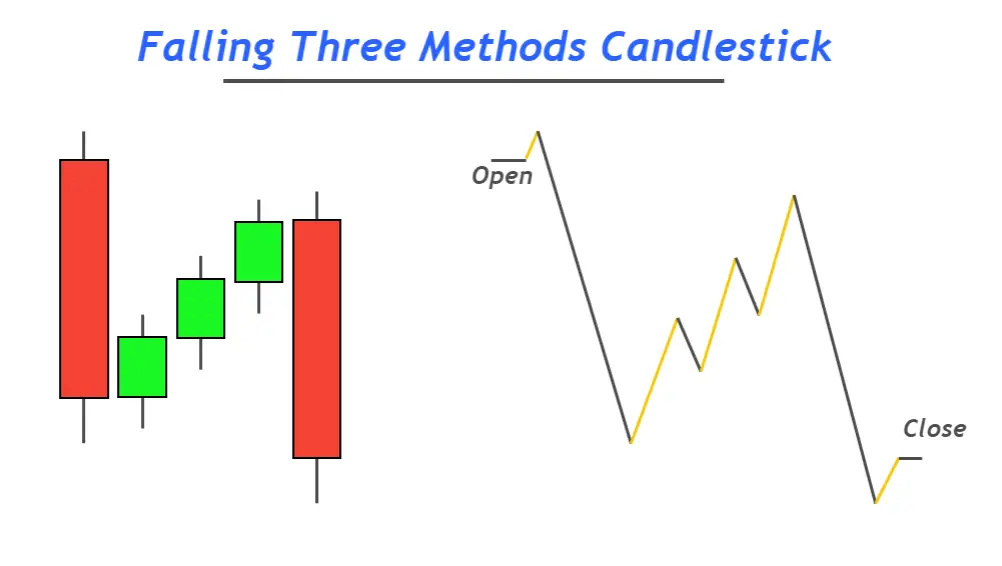
Falling Three Methods pattern ko charhaktar karte hain aath candlesticks, jo ke aam tor par ek downtrend ke dauran dekha jata hai. Yahan is pattern ke key components hain:
- Pehli Candlestick Bearish: Pattern ek lambi bearish red ya black candlestick se shuru hota hai, jo ke strong selling pressure aur prices mein ek significant downward movement ko indicate karta hai.
- Doosri Candlestick Bullish: Pehli bearish candlestick ke baad, ek chhoti bullish green ya white)candlestick hoti hai. Ye candlestick temporary pause ya consolidation ko represent kar sakti hai downtrend mein, jahan buyers aate hain lekin trend ko kisi significant level par reverse nahi kar paate.
- Third, Fourth, and Fifth Candlesticks Bearish: Chhoti bullish candlestick ke baad, pattern teen mufeed bearish candlesticks ke saath jaari rehta hai. Ye candlesticks pehli candlestick ke muqable mein chhoti hoti hain lekin phir bhi bearish sentiment ko show karte hain jab tak sellers market mein control maintain karte hain.
Falling Three Methods pattern ka tabeer market sentiment aur buyers aur sellers ke darmiyan ladhayi ke concept par mabni hai. Yahan traders is pattern ko kaise analyze karte hain:
- Bearish Continuation Signal: Falling Three Methods pattern primarily bearish continuation signal ke roop mein dekha jata hai. Ye indicate karta hai ke ek chhoti si pause ya consolidation ke baad, downtrend ko dubara shuru hone ka imkaan hai. Traders is pattern ko use karte hain further declines in prices ko anticipate karne ke liye aur short-selling ya long positions ko exit karne ke liye.
- Confirmation: Traders often confirmation ka intezaar karte hain Falling Three Methods pattern se pehle action lene se pehle. Confirmation next candlestick(s) se aati hai jo downward movement ko continue karte hain, pattern ke bearish bias ko validate karte hue.
- Volume Analysis: Trading volume ka analysis karna additional insights provide kar sakta hai jab Falling Three Methods pattern ko interpret kiya jaata hai. Volume decrease chhoti bullish candlestick aur baad ki bearish candlesticks ke dauran ek weakening buying interest ko indicate kar sakta hai aur bearish outlook ko strengthen kar sakta hai.
- Support and Resistance Levels: Traders Falling Three Methods pattern ko interpret karte hue support aur resistance levels ko bhi consider karte hain. Agar pattern kisi significant resistance level ke paas hota hai, to ye bearish bias ko reinforce karta hai aur potential price declines ko indicate karta hai.
Interpretation of the Falling Three Methods Pattern
Traders Falling Three Methods pattern ko apne trading decisions mein incorporate karne ke liye various strategies ka istemal karte hain. Yahan kuch common approaches hain:
- Short Selling: Falling Three Methods pattern ke saath associated ek primary strategy short selling hai. Traders pattern ko confirm karne ke baad short positions initiate karte hain, expecting further declines in prices based on bearish continuation signal.
- Risk Management: Sahi risk management zaroori hai jab Falling Three Methods jaise candlestick patterns par trading ki jaati hai. Traders stop-loss orders set karte hain taake potential losses ko limit kar sake agar market positions ke against move karti hai.
- Confirmation from Indicators: Traders often technical indicators jaise moving averages, RSI (Relative Strength Index), ya MACD(Moving Average Convergence Divergence ka istemal karte hain Falling Three Methods pattern ke signals ko confirm karne ke liye. Multiple indicators se signals ka confluence trading decision ko strengthen karta hai.
- Timeframe Consideration: Traders Falling Three Methods pattern ko use karte hue timeframe ka bhi consideration karte hain. Pattern ka significance short-term intraday chart par ya longer-term daily ya weekly chart par hone par vary ho sakta hai.
Jab bhi Falling Three Methods pattern ya koi bhi technical pattern ko use kiya jaata hai, to limitations aur other factors ko bhi consider karna zaroori hai:
- False Signals: Jaise ke koi bhi technical pattern, Falling Three Methods pattern bhi false signals produce kar sakta hai, jahan anticipated price movement as expected nahi hoti. Traders risk management techniques ka istemal karte hain taake potential losses ko mitigate kar sake false signals se.
- Market Conditions: Market conditions, news events, aur macroeconomic factors price movements ko influence kar sakte hain aur candlestick patterns ke signals ko override kar sakte hain. Traders technical analysis ke saath fundamental analysis bhi incorporate karte hain for a comprehensive view of the market.
- Pattern Variations: Falling Three Methods pattern ke variations bhi ho sakte hain, jahan candlesticks ka number ya arrangement standard pattern se thoda alag ho. Traders apni analysis ko adapt karte hain based on these variations aur overall market context ko consider karte hain.

تبصرہ
Расширенный режим Обычный режим