WHAT IS HOLLOW CANDLESTICK CHART PATTERN.
Hollow candlestick charts ke patterns ko samajhna aur interpret karna traders ke liye ahem hy aor who ess leye kay yeh pattern zeyada tar big time frames main banta hai yani daily or weekly chart mai or jidhar yeh banta hai udhar market bohat buri tarha fall karti hai Candlestick charts ka aim market kay difficult data ko visually represent karna hy. Har candlestick eik specific time period ko indicate karti hy, jis ko hum market tradition mein timeframe ka name dete hein. Yeh charts traders ko market ke trends aur price movements ka andaza lagane mein madad karte hain.

IDENTITY.
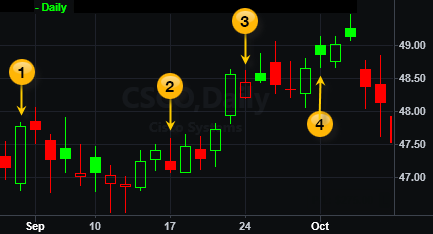
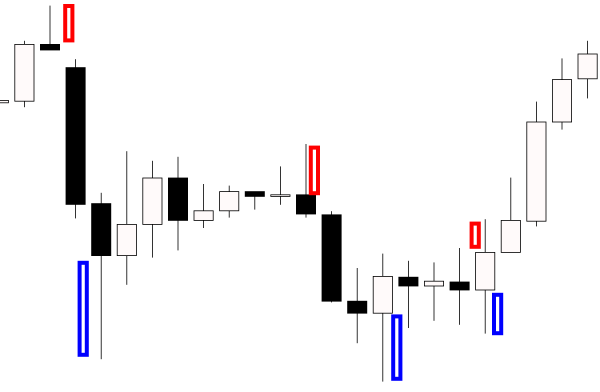
My fellow traders, Hollow candlestick charts mein, each candlestick ka body empty hota hy, jo usually white ya green color ka hota hy. Yeh indicate karta hy ky opening price lower hy aur closing price higher hy. Jiss ka matlab hy ky market mein bullish trend hy. Agar candlestick ka body length mein ziada ho aur upper wick small ho tou yeh indicate karta hay kay buyers control mein hain, aur bullish trend hy. Jab kay agar candlestick ka body small ho aur lower wick length mein ziada ho tou yeh indicate karta hy kay sellers control mein hain. Agar market mein bullish trend hy tou traders apne investments ko enhance kerny kay liye accurate time ka wait karte hain. Aur jaisy hee perfect time aye tou trade place kerny mein hesitation feel nahi kerni chehye. Yeh visual aur perceptive tool hai jo traders ko market trends aur price action ka better prediction mein support dy sakta hy.

ANALYTICAL TRADING.
Champion traders market kay behavior aur trend ki prediction ko quickly adopt ker lety hein. Ye patterns market mein buyers ki dominance ko dikhaate hain aur indicate karte hain ke prices mein tezi se izafa hone ki ummeed hai. Yeh pattern traders ko market ke trend aur sentiment ke baray mein maloomat faraham karta hai. Hollow candlestick charts patterns ess production ka aik important part hai jo different samaiyat aur karobar ki regulations ko darust taur par zahir karta hai. Yeh likhawat traders ko few different facilities sey faida uthane ki permission deti hai. Hollow candlestick patterns ki confirmation ke liye traders ko volume aur doosre technical indicators ka bhi istemal karna chahiye. Stop loss point ki place ment bi trading scenario mein bhout important role play kerti hay.

Hollow candlestick charts ke patterns ko samajhna aur interpret karna traders ke liye ahem hy aor who ess leye kay yeh pattern zeyada tar big time frames main banta hai yani daily or weekly chart mai or jidhar yeh banta hai udhar market bohat buri tarha fall karti hai Candlestick charts ka aim market kay difficult data ko visually represent karna hy. Har candlestick eik specific time period ko indicate karti hy, jis ko hum market tradition mein timeframe ka name dete hein. Yeh charts traders ko market ke trends aur price movements ka andaza lagane mein madad karte hain.
IDENTITY.
My fellow traders, Hollow candlestick charts mein, each candlestick ka body empty hota hy, jo usually white ya green color ka hota hy. Yeh indicate karta hy ky opening price lower hy aur closing price higher hy. Jiss ka matlab hy ky market mein bullish trend hy. Agar candlestick ka body length mein ziada ho aur upper wick small ho tou yeh indicate karta hay kay buyers control mein hain, aur bullish trend hy. Jab kay agar candlestick ka body small ho aur lower wick length mein ziada ho tou yeh indicate karta hy kay sellers control mein hain. Agar market mein bullish trend hy tou traders apne investments ko enhance kerny kay liye accurate time ka wait karte hain. Aur jaisy hee perfect time aye tou trade place kerny mein hesitation feel nahi kerni chehye. Yeh visual aur perceptive tool hai jo traders ko market trends aur price action ka better prediction mein support dy sakta hy.
ANALYTICAL TRADING.
Champion traders market kay behavior aur trend ki prediction ko quickly adopt ker lety hein. Ye patterns market mein buyers ki dominance ko dikhaate hain aur indicate karte hain ke prices mein tezi se izafa hone ki ummeed hai. Yeh pattern traders ko market ke trend aur sentiment ke baray mein maloomat faraham karta hai. Hollow candlestick charts patterns ess production ka aik important part hai jo different samaiyat aur karobar ki regulations ko darust taur par zahir karta hai. Yeh likhawat traders ko few different facilities sey faida uthane ki permission deti hai. Hollow candlestick patterns ki confirmation ke liye traders ko volume aur doosre technical indicators ka bhi istemal karna chahiye. Stop loss point ki place ment bi trading scenario mein bhout important role play kerti hay.

تبصرہ
Расширенный режим Обычный режим