Ascending Triangle Pattern In Trading.
X
  • وقت
  • دکھائیں
Clear All
new posts
  • #16 Collapse

    Ascending Triangle Pattern In Trading.

    Click image for larger version

Name:	download (25).jpeg
Views:	16
Size:	16.5 کلوبائٹ
ID:	12877903


    Ascending Triangle Pattern ek popular technical analysis tool hai jo traders ko market ke potential bullish reversals ya continuations ko identify karne mein madad karta hai. Yeh pattern jab market mein dekha jata hai, toh traders ko ek upward price movement ki sambhavna hoti hai. Neeche Ascending Triangle Pattern ke baare mein tafseelat roman Urdu mein di gayi hai:

    Ascending Triangle Pattern Kya Hai?

    Ascending Triangle Pattern ek continuation pattern hai jo uptrend ke doran dekha jata hai.
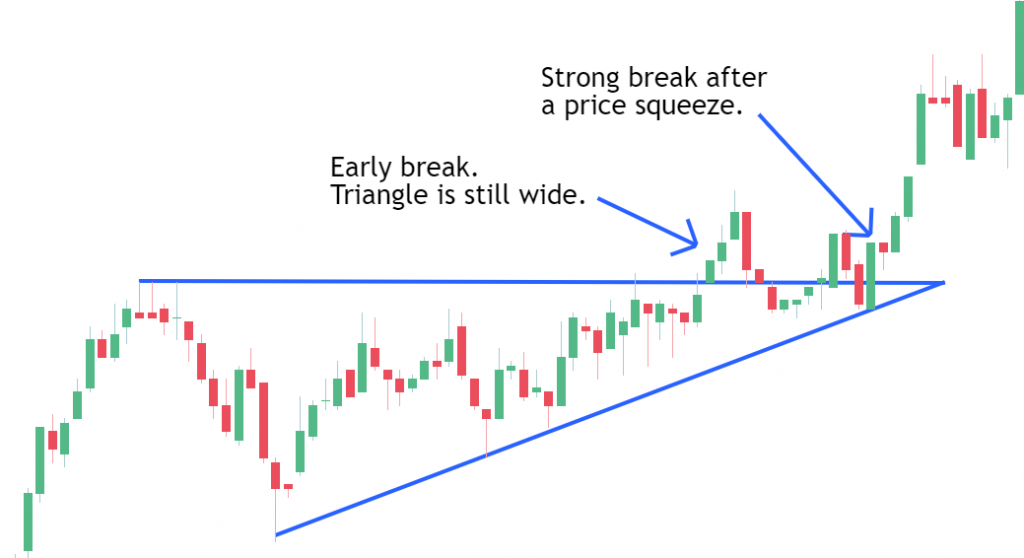
    Is pattern mein ek horizontal resistance line aur ek rising trend line hoti hai jo higher lows ko connect karti hai.
    Resistance line horizontal hoti hai, jabki support line upward sloping hoti hai.
    Ascending Triangle Pattern Ki Tafseel:

    Jab market mein ascending triangle pattern dekha jata hai, toh yeh ek bullish continuation ya reversal ka indication hota hai.
    Is pattern mein price resistance line se baar-baar takra kar wapas jaata hai, lekin higher lows banata hai.
    Is pattern mein volume dheere dheere kam ho jata hai, jo ek breakout ki sambhavna ko darust karta hai.
    Ascending Triangle Pattern Ka Istemal:

    Ascending Triangle Pattern ka istemal traders price breakout ki expectation mein karte hain.
    Breakout ka wait karte waqt, traders ko volume ki bhi nigaah rakhni chahiye. Agar volume breakout ke samay badh jata hai, toh yeh breakout ko confirm karta hai.
    Ascending Triangle Pattern Ke Faide:

    Ascending Triangle Pattern ko samajhne se traders ko market ke potential bullish movements ka pata lagta hai.
    Is pattern ka istemal karke traders sahi waqt par entry aur exit points tay kar sakte hain aur profit earn kar sakte hain.
    Yeh pattern traders ko market ka sentiment samajhne mein madad karta hai aur unhein trading decisions lene mein guide karta hai.
    Udaharan:

    Agar ek stock ka price ek horizontal resistance line ke upar repeatedly takra raha hai aur ek rising trend line ke saath higher lows banata ja raha hai, toh yeh ek ascending triangle pattern ko indicate karta hai.
    Jab price resistance line ko break karke upar chadta hai, toh yeh breakout ka signal hota hai aur traders entry karte hain.
    Ascending Triangle Pattern ek powerful tool hai jo traders ko market ke potential bullish movements ko identify karne mein madad karta hai. Is pattern ko samajh kar traders sahi waqt par entry aur exit points tay kar sakte hain aur profit earn kar sakte hain.
    • <a href="https://www.instaforex.org/ru/?x=ruforum">InstaForex</a>
    • #17 Collapse

      Ascending Triangle Pattern In Trading.

      Click image for larger version

Name:	images (67).jpeg
Views:	18
Size:	18.3 کلوبائٹ
ID:	12878336

      Ascending Triangle Pattern In Trading: Ek Mushahida


      Mukhtasar Mehwar:
      • Introduction
      • Taraqqi Pazeeri Kya Hai?
      • Taraqqi Pazeeri Ka Tareeqa
      • Taraqqi Pazeeri Ke Faidey
      • Mukhtalif Sooraten
      • Misalon Ki Tafseel
      • Mukhtalif Tareeqay

      Introduction: Trading market mein, taraqqi pazeeri ek aham aur mufeed pattern hai jo traders ke liye aik ahem tool hai. Ye pattern ek aam aur popular chart pattern hai jo market analysis mein istemal hota hai.

      Taraqqi Pazeeri Kya Hai? Taraqqi pazeeri ek technical analysis tool hai jo trading charts par dekha ja sakta hai. Ye pattern typically ek uptrend ke doran paya jata hai aur iska matlab hota hai ke prices higher highs aur higher lows bana rahe hain.

      Taraqqi Pazeeri Ka Tareeqa: Taraqqi pazeeri ka pattern typically ek triangle shape mein hota hai, jahan price ek flat resistance level ko touch karta hai, jab ke lows higher lows bana rahe hote hain.

      Taraqqi Pazeeri Ke Faidey:
      • Entry Point Tay Karna: Taraqqi pazeeri ka pattern traders ko entry point tay karne mein madad deta hai.
      • Risk Management: Is pattern ki madad se traders apna risk manage kar sakte hain.
      • Price Targets Tay Karna: Taraqqi pazeeri ke pattern se traders price targets tay kar sakte hain.

      Mukhtalif Sooraten: Taraqqi pazeeri ke mukhtalif sooraten hote hain jinmein:
      • Symmetrical Triangle: Jab price ek flat resistance aur ek sloping support line ke darmiyan trade karta hai.
      • Ascending Triangle: Jab price ek flat resistance level ko touch karta hai aur highs higher highs bana rahi hoti hain.
      • Descending Triangle: Jab price ek flat support level ko touch karta hai aur lows lower lows bana rahi hoti hain.

      Misalon Ki Tafseel: Misalon ki roshni mein, agar ek trader ko taraqqi pazeeri ka pattern nazar aaye, to wo is tarah se amal kar sakta hai:
      • Entry Point: Jab price resistance level ko break karta hai, trader ko entry point tay karna chahiye.
      • Stop Loss: Ek choti si stop loss rakhna zaroori hai taki trader apna nuksan kam kar sake.
      • Price Targets: Traders ko price targets tay karne chahiye jahan wo apne positions ko close kar sakein.

      Mukhtalif Tareeqay: Taraqqi pazeeri ka pattern identify karne ke liye kai mukhtalif tareeqe hote hain, jaise ke:
      • Trend Lines: Price ke highs aur lows ko connect karke trend lines draw karna.
      • Volume Analysis: Volume ko analyze karke taraqqi pazeeri ka pattern confirm karna.
      • Moving Averages: Moving averages ka istemal karke trend ko confirm karna.

      Ikhtitami Guftagu: Taraqqi pazeeri ek aham tool hai jo traders ko market mein achi tarah se navigate karne mein madad karta hai. Is pattern ko samajhna aur istemal karna traders ke liye zaroori hai takay wo sahi waqt par positions le sakein aur faida hasil kar sakein.


      • #18 Collapse

        @@@@Trading Mein Ascending Triangle Pattern@@@@

        Ascending Triangle Pattern ek technical analysis tool hai jo ki stock market ya anya financial markets mein price movements ko analyze karne ke liye istemal kiya jata hai. Yeh ek bullish continuation pattern hai, matlab ki jab market uptrend mein hai aur phir thoda sa consolidate hota hai, toh yeh pattern dikhta hai.

        @@@@Trading Mein Ascending Triangle Pattern Ke Components@@@@

        Ascending Triangle Pattern ko identify karne ke liye, aapko do important components dekhne padte hain:
        1. Upper Trend Line: Yeh line uptrend ke dauran bane price highs ko join karti hai.
        2. Lower Horizontal Line: Yeh line price highs ko connect karti hai jo ek level par stable rehte hain ya phir minor upar neeche ke movements karte hain. Is line ko support level bhi kaha jata hai.


        Jab aap in dono lines ko draw karte hain, toh pattern ka shape ek triangle jaisa ban jata hai, jismein upper trend line slope upwards hoti hai aur lower horizontal line flat rehti hai. Is pattern mein volume ka bhi mahatva hota hai. Usually, volume jab pattern ke shuruwat mein kam hota hai aur pattern ke end mein badh jata hai, tab yeh ek positive sign mana jata hai.

        Ascending Triangle Pattern ka trading strategy yeh hota hai ki jab price upper trend line ko break karta hai, toh traders ko long position lena chahiye. Stop-loss order lower horizontal line ke neeche lagaya jata hai taaki agar price unexpected movement karke niche jaata hai toh loss ko kam kiya ja sake.

        Yeh pattern bullish continuation ke roop mein consider hota hai, matlab ki jab ek uptrend mein market hai aur fir price yeh pattern banata hai, toh iska matlab hota hai ki market mein buying pressure hai aur uptrend continue hone ki sambhavna hai. Lekin is pattern ko confirm karne ke liye, traders ko price break ke confirmation ka bhi dhyan rakhna chahiye.

        Is tarah se, Ascending Triangle Pattern ek powerful technical analysis tool hai jo ki traders ko market mein hone wale price movements ko analyze karne mein madad karta hai.
        • <a href="https://www.instaforex.org/ru/?x=ruforum">InstaForex</a>
        • #19 Collapse


          Ascending Triangle Pattern In Trading.

          Ascending Triangle Pattern in Trading

          Trading patterns are essential tools for technical analysts to forecast price movements in financial markets. One such pattern is the ascending triangle pattern, which is formed when the price of an asset consolidates between a rising support line and a horizontal resistance line. This pattern indicates a potential bullish continuation, and traders often look for specific criteria to confirm its validity before making trading
          decisions.

          Click image for larger version

Name:	A 40.jfif
Views:	14
Size:	7.4 کلوبائٹ
ID:	12878411

          Characteristics of an Ascending Triangle Pattern:
          1. Rising Support Line: The bottom trendline of the triangle is drawn by connecting the higher lows formed during the consolidation phase. This line represents the increasing buying pressure.
          2. Horizontal Resistance Line: The top trendline is drawn by connecting the similar price highs that are not able to break the resistance level. This line signifies the selling pressure.
          3. Volume: During the formation of the ascending triangle, trading volume typically decreases. However, when the price breaks out of the pattern, there is usually a noticeable increase in volume, confirming the breakout.
          4. Duration: Ascending triangles can form over several weeks to several months, depending on the timeframe being analyzed.

          Trading the Ascending Triangle Pattern:
          1. Entry: Traders often enter a long (buy) position when the price breaks above the resistance line with increased volume. This breakout is seen as a signal of bullish continuation.
          2. Stop Loss: A stop-loss order is usually placed just below the rising support line to protect against potential losses in case the pattern fails.
          3. Profit Target: The height of the triangle can be used to estimate the potential price target after the breakout. This is done by measuring the distance between the initial low and the horizontal resistance line and adding it to the breakout point.
          4. Confirmation: Some traders wait for a retest of the breakout level before entering a trade to confirm that the breakout is valid.

          Example of Trading the Ascending Triangle Pattern:

          Let's consider a hypothetical example of an ascending triangle pattern on a stock chart:
          • Stock ABC has been trading in a range between $50 and $60 for several weeks, forming the horizontal resistance line.
          • During this time, the stock has been forming higher lows, creating the rising support line.
          • As the price approaches the apex of the triangle, trading volume decreases.
          • When the price breaks above the $60 resistance level with increased volume, traders interpret this as a bullish signal.
          • A trader enters a long position at $61, with a stop loss at $59 and a profit target of $70, based on the height of the triangle.

          In conclusion, the ascending triangle pattern is a useful tool for traders to identify potential bullish continuation opportunities. By understanding the characteristics of this pattern and using appropriate risk management techniques, traders can improve their chances of success in the financial markets.

          اب آن لائن

          Working...
          X