Hanging man candle stick pattern?

No announcement yet.
`
X
  • وقت
  • دکھائیں
Clear All
new posts
  • #31 Collapse

    Hanging man candle stick pattern kai hy


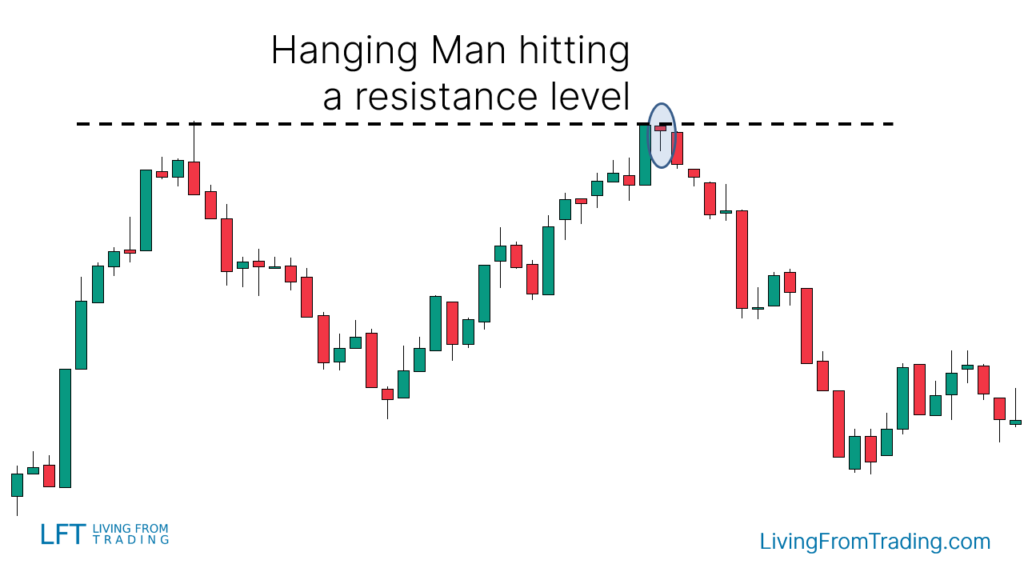
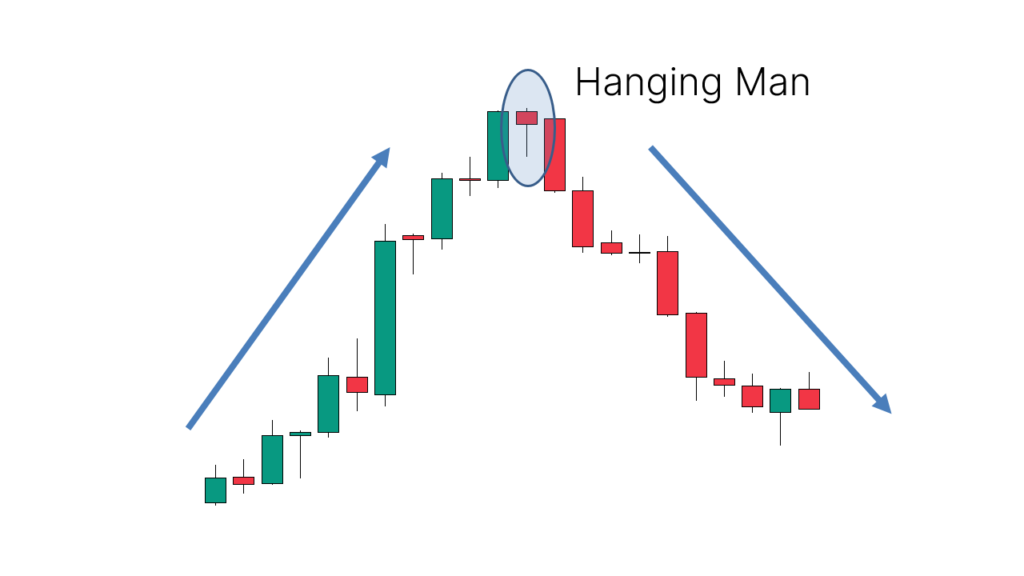
    Hanging Man candlestick pattern ek bearish reversal signal hai jo typically uptrend ke baad develop hota hai. Ye pattern ek single candlestick se banata hai aur traders ke liye important signal hai.

    Hanging Man Candlestick Pattern Key Characteristics:
    1. Appearance:
      • Hanging Man pattern ek single candle hoti hai jo uptrend ke end par dikhai deti hai.
      • Iski body chhoti hoti hai aur upper shadow (ya wick) lambe hoti hai, jabki lower shadow bilkul ya kafi kam hoti hai.
      • Iski appearance ek "T" shape ya "Hanging Man" ki tarah hoti hai, jis se iska naam hai.
    2. Body and Shadows:
      • Hanging Man ki body upper half mein hoti hai aur lower half mein shadow hota hai.
      • Upper shadow lamba hota hai aur body ke upper side se bahar extend hota hai, indicating ke sellers ne price ko neeche push kiya hai.
      • Lower shadow ya wick almost absent hota hai ya phir bohot chota hota hai.
    3. Color:
      • Hanging Man candlestick ki color significance nahi rakhti, matlab ke ye bullish ya bearish candle ho sakti hai. Important hai ke ye uptrend ke baad dikhai de, chahe wo green (bullish) ho ya red (bearish).
    4. Signal:
      • Hanging Man pattern ek bearish reversal signal provide karta hai. Ye indicate karta hai ke uptrend ke end par buyers ki strength kamzor ho rahi hai aur sellers ki dominance increase ho rahi hai.
      • Is pattern ke appearance ke baad, traders bearish reversal ko anticipate karte hain.
    5. Confirmation:
      • Hanging Man pattern ko confirm karne ke liye, traders dusre technical indicators aur price action signals ko bhi dekhte hain jaise ki volume increase, aur doosre candlestick patterns.
    6. Stop Loss Aur Take Profit:
      • Agar Hanging Man pattern ko identify kiya gaya hai aur bearish reversal expected hai, to traders stop loss aur take profit levels set karte hain.
      • Stop loss typically pattern ke high se thodi upar aur take profit levels potential support level ke paas set kiye jaate hain.

    Hanging Man pattern ke identification ke baad, traders typically short positions enter karte hain ya phir existing long positions ko close karte hain, expecting ke price ka downward movement hone wala hai. Lekin, important hai ke traders dusre technical indicators aur market context ko bhi consider karein Hanging Man pattern ko confirm karne se pehle.

     
    • <a href="https://www.instaforex.org/ru/?x=ruforum">InstaForex</a>
    • #32 Collapse

      Hanging man candle stick pattern?


      Click image for larger version

Name:	download (97).png
Views:	53
Size:	3.4 کلوبائٹ
ID:	12868793

      Hanging Man Candlestick Pattern (Latka Hua Admi Candlestick Pattern)

      1. Pattern Kiya Hai?
      • Hanging Man Candlestick Pattern ek single candlestick pattern hai jo bearish reversal ko indicate karta hai. Is pattern mein ek lamba lower shadow aur chhota body hota hai, jahan body upper shadow ke qareeb hoti hai.

      2. Tareeqa Kaam
      • Hanging Man pattern ko identify karne ke liye traders ko ye points dekhne hote hain:
        • Body: Body chhota hota hai aur upper shadow ke qareeb hoti hai. Usually body green (bullish) hoti hai agar ye pattern downtrend ke baad appear hota hai.
        • Lower Shadow: Lower shadow lamba hota hai aur body ke 2-3 times ya usse zyada hota hai. Ye indicate karta hai ke price ne neeche se recover kiya hai.

      3. Pattern Ka Maksad
      • Hanging Man pattern bearish reversal ko suggest karta hai. Is pattern ke appearance ke baad agar price downward move karta hai, to ye ek bearish signal hai.

      4. Trading Strategies
      • Confirmation: Hanging Man pattern ko confirm karne ke liye traders next candlestick ka price action dekhte hain. Agar next candlestick bearish hai aur lower price par close hota hai, to ye Hanging Man pattern ki validity ko confirm karta hai.
      • Entry Point: Hanging Man pattern ke confirm hone ke baad traders short positions le sakte hain. Entry point usually lower shadow ke neeche ke price level par set kiya jata hai.
      • Stop Loss Aur Target: Stop loss ko upper shadow ke upar aur target ko recent support level ya Fibonacci retracement levels ke neeche set kiya jata hai.

      5. Conclusion

      Hanging Man Candlestick Pattern ek bearish reversal signal hai jo traders ko market mein potential trend change ko indicate karta hai. Is pattern ko sahi tareeqe se identify karke aur sahi confirmation ke saath istemal karke traders apne trading strategies ko improve kar sakte hain aur profitable trading decisions le sakte hain. Lekin yaad rahe ke kisi bhi single candlestick pattern ko interpret karne se pehle market context aur other technical indicators ka bhi analysis karna zaroori hai.
      • #33 Collapse

        What is hanging man candlestick pattern.

        As salam o alaikum dosto, Hanging Man ik candlestick pattern hy jo forex market main aksar dekha jata hy. Ye pattern market main trend reversal ki nishani ho sakta hy or traders ky liye ahem hota hy.Hanging Man pattern ik potential reversal signal deta hy. Iska matlab hy ky agar ye pattern uptrend ky baad aata hy, to ye bearish reversal ki taraf ishara kar sakta hy. Lekin isky liye confirmation ki zaroorat hoti hy, jo dusry technical indicators ya patterns sy ati hy.

        Trading strategy with hanging man candlestick pattern.

        Dear trading members, Hanging Man candlestick pattern market chart par dikhe, to iska matlab hy ky market main bullish trend week ho sakta hy or bearish reversal hony ky chances hain. Is pattern ki tafseel sy samjha jaye to, buyers initially strong thy, lekin sellers ny market ko control kr liya hy or price nichy jany ky liye tayar hain. Isy samjha jata hy ky buyers or sellers ky darmiyan conflict hy or bearish trend shuru ho sakta hy. Forex trading main Hanging Man candlestick pattern ko samajhna or istemal karna ahem hy. Jab ap is pattern ko market chart pr dekhty hain, to ap ko samajhna chahiye ky iska kiya matlab hy or kis tarah ky trades is pattern ky sath kiye ja sakty hain. Agar Hanging Man uptrend ky baad ata hy or market strong bearish reversal signal dy raha hy, to traders bearish positions enter kr sakty hain ya existing long positions ko close kr sakty hain. Lekin yaad rahy ky sirf ik candlestick pattern par pura trust na karen. Is pattern ko dusry technical indicators or price action ky sath mil kar istemal karna behtar hota hy. Risk management bhi ahem hy, ta ky nuksan sy bacha ja saky.


        ​​​importance of hanging man candlestick pattern.

        Hello dosto, Hanging man candlestick pattern ik single candlestick pattern hy, jo ky prices ky top ya bullish trend main banti hy. Price chart pattern pr baaz auqat single candlestick bhi dusry candlesticks charts pattern ki tarah k asraat rakhty hain, jab bhi ye candlesticks prices ky top ya bottom par banty hain. Hanging man candlestick ky ik small real body hoti hy, jis ka lower side par ik long shadow banta hy. Ye shadow Hanging man candlestick ki real body ka taqreeban dugna ya ussy ziada hota hy. Hanging man candlestick ki real body ky upper side par koi wick ya shadow nahi banta yani candlestick ki real body ka upside ik "Bozu" candle hoti hy, lekin agar ik small wick ban bhi jaye to bhi acceptable hy, lekin bht zyada lamba na ho jis sy candlestick ki khasusiyat tabdeel ho jaye.
         
        • #34 Collapse


          Hanging man candle stick pattern?


          Click image for larger version

Name:	4.png
Views:	45
Size:	18.1 کلوبائٹ
ID:	12874065


          Hanging Man candlestick pattern ek bearish reversal pattern hai jo forex trading mein use hota hai. Ye pattern typically uptrend ke baad dekha jata hai aur bearish reversal ki sambhavna ko indicate karta hai.

          Hanging Man pattern ke kuch key characteristics hote hain:
          1. Ek single candlestick: Hanging Man pattern ek single candlestick pattern hai jo typically uptrend ke end mein dekha jata hai.
          2. Small body aur long lower shadow: Is pattern mein candlestick ka body chhota hota hai aur lower shadow (ya tail) lamba hota hai. Body bearish ya bullish ho sakti hai, lekin hanging man pattern mein body typically bearish hoti hai. Lower shadow, candlestick ke bottom se neeche tak extend hota hai aur ideally 2/3 se zyada length hota hai compared to the body.
          3. No or very small upper shadow: Hanging Man pattern mein typically upper shadow ki length chhoti hoti hai ya phir uska bilkul na hona preferred hota hai.
          4. Closing near low: Candlestick ka close typically candlestick ke low ke qareeb hota hai. Yeh indicate karta hai ke sellers ne control haasil kiya hai aur price ko neeche le jaane ki koshish kar rahe hain.
          5. Volume ka tawazun: Is pattern ke formation ke waqt volume ka bhi tawazun dekha jata hai. Agar hanging man pattern ke saath volume increase hota hai, to ye bearish reversal ki confirmation hoti hai.

          Hanging Man pattern ko identify karke traders bearish reversal ki sambhavna ko samajh sakte hain aur iska istemal entry points ke liye kiya ja sakta hai. Magar, jaise har technical indicator ya pattern ke saath hota hai, ye bhi kabhi kabhi false signals de sakta hai, isliye dusre technical analysis tools aur risk management ke saath istemal karna zaroori hai.


          • #35 Collapse

            Knowledge about Hanging man candlestick pattern:
            As salam o alaikum dosto, Hanging Man ik candlestick pattern hy jo forex market main aksar dekha jata hy. Ye pattern market main trend reversal ki nishani ho sakta hy or traders ky liye ahem hota hy.Hanging Man pattern ik potential reversal signal deta hy. Iska matlab hy ky agar ye pattern uptrend ky baad aata hy, to ye bearish reversal ki taraf ishara kar sakta hy. Lekin isky liye confirmation ki zaroorat hoti hy, jo dusry technical indicators ya patterns sy ati hy.. Hanging man pattern ek single candlestick hota hai jismein price initially upar chadhta hai, lekin candlestick ka body chhota hota hai aur lower shadow (tail) lamba hota hai. Iska matlab hota hai ke buyers initially control mein hote hain lekin phir sellers ne control le liya hai
            1. Identify the Pattern: Sabse pehle, aapko chart par Hanging man candlestick pattern ko identify karna hoga. Hanging man pattern ek single candlestick hota hai jo uptrend ke end par dikhta hai. Ismein price initially upar chadhta hai lekin phir candlestick ka body chhota hota hai aur lower shadow (tail) lamba hota hai.
            2. Confirm the Pattern: Sirf Hanging man pattern dekh kar trading decision na len. Always ek confirmation ki zarurat hoti hai. Aapko dekhna hoga ke next candlestick kya hai. Agar next candlestick downtrend mein form hota hai aur price kam ho raha hai, toh Hanging man pattern ko confirm kiya ja sakta hai.
            3. Use Additional Indicators: Hanging man pattern ko validate karne ke liye, aap additional technical indicators ka istemal kar sakte hain jaise ki RSI (Relative Strength Index), MACD (Moving Average Convergence Divergence), ya Bollinger Bands. Agar yeh indicators bhi bearish signals show kar rahe hain toh Hanging man pattern ki credibility badh jati hai.
            4. Entry and Exit Points: Hanging man pattern ko dekhte hue entry aur exit points decide karein. Agar aapko bearish reversal ka indication mil raha hai, toh aap short positions le sakte hain ya existing long positions ko close kar sakte hain. Entry aur exit points ka faisla karne se pehle risk aur reward ko bhi consider karein.


            Importance of Hanging man candlestick pattern:
            Hello dosto, Hanging man candlestick pattern ik single candlestick pattern hy, jo ky prices ky top ya bullish trend main banti hy. Price chart pattern pr baaz auqat single candlestick bhi dusry candlesticks charts pattern ki tarah k asraat rakhty hain, jab bhi ye candlesticks prices ky top ya bottom par banty hain. Hanging man candlestick ky ik small real body hoti hy, jis ka lower side par ik long shadow banta hy. Ye shadow Hanging man candlestick ki real body ka taqreeban dugna ya ussy ziada hota hy. Hanging man candlestick ki real body ky upper side par koi wick ya shadow nahi banta yani candlestick ki real body ka upside ik "Bozu" candle hoti hy, lekin agar ik small wick ban bhi jaye to bhi acceptable hy, lekin bht zyada lamba na ho jis sy candlestick ki khasusiyat tabdeel ho jaye.Hanging man pattern ek bearish reversal signal hai. Jab market uptrend mein hota hai aur Hanging man pattern form hota hai, toh ye indicate karta hai ke buyers ki strength kam hoti ja rahi hai aur sellers ka dominance barh raha hai. Is tarah se, ye pattern market direction ka reversal suggest karta hai.Hanging man pattern traders ko entry aur exit points provide karta hai. Agar traders uptrend mein hain aur Hanging man pattern form ho raha hai, toh ye unhe bearish reversal ka indication deta hai. Traders is signal ko dekh kar apne positions ko adjust kar sakte hain ya naye positions le sakte hain.Hanging man pattern ko confirm karne ke liye traders aur investors dusre technical indicators ka istemal karte hain jaise ki volume, RSI, MACD, etc. In indicators ki madad se Hanging man pattern ka reliability aur credibility badhti hai
            1. Reversal Signals: Hanging man pattern bearish reversal signals provide karta hai, jo traders aur investors ko market direction ka potential change batata hai. Isse traders ko early entry aur exit points milte hain.
            2. Technical Analysis Tool: Ye pattern ek important technical analysis tool hai jo market psychology ko reflect karta hai. Iske istemal se traders apne trading strategies ko refine kar sakte hain aur market trends ko samajh sakte hain.
            3. Risk Management: Hanging man pattern ka istemal karke traders apne risk management strategies ko improve kar sakte hain. Stop-loss orders ka istemal karke, losses ko minimize kar sakte hain.
            4. Confirmation with Other Indicators: Is pattern ko confirm karne ke liye traders dusre technical indicators ka istemal karte hain, jo pattern ki credibility ko badhate hain aur sahi trading decisions lene mein madad karte hain.

            Nuqsanat:
            1. False Signals: Kabhi-kabhi Hanging man pattern false signals bhi generate kar sakta hai. Yani ke pattern ki appearance ke baad bhi market direction mein change na ho. Isliye, is pattern ko confirm karne ke liye dusre technical indicators ka istemal zaroori hota hai.
            2. Over-reliance: Kuch traders ko Hanging man pattern ya anya candlestick patterns par zyada bharosa ho sakta hai, jiski wajah se wo dusre important factors ko ignore kar dete hain. Over-reliance se trading decisions galat ho sakte hain.
            3. Market Volatility: Market volatility Hanging man pattern ke interpretation ko mushkil bana sakta hai. Agar market mein zyada volatility hai, toh false signals ka risk badh jata hai.

            Hanging Man Candlestick Pattern Kya Hai? Hanging Man candlestick pattern ek single candlestick formation hai jo aam tor par ek uptrend ke ant mein dikhta hai. Ismein chhota sa body candlestick ke top ke qareeb hota hai sath hi lambi neechli chhao (tail) hoti hai. Ye pattern yeh suggest karta hai ke haalaat mein ghairat paida ho sakta hai jab buyers ka initial control khatam hota hai aur sellers price ko neeche le jaate hain. Lambi neechli chhao bearish reversal ki sambhavna ko darshata hai.

            Hanging Man Pattern Ko Interpret Karna: Hanging Man pattern ko price chart par pehchanne par traders ko in characteristics par dhyan dena chahiye:
            • Candlestick ka body price range ke top ke qareeb hota hai.
            • Lambi neechli chhao hoti hai, jisse darshata hai ke price session ke dauran kafi gir gaya tha.
            • Ye pattern ek lambi uptrend ke baad aata hai, jisse yeh sanket milta hai ke buyers mein thakaan aayi hai.

            Hanging Man Pattern Ko Trading Mein Istemal Karna:Traders Hanging Man pattern ko apne trading strategies mein is tarah istemal kar sakte hain:
            1. Reversal Signal: Hanging Man pattern ko bearish reversal signal ke roop mein dekhein, khaaskar jab yeh ek majboot uptrend ke baad aata hai. Ye pattern yeh darshata hai ke market sentiment bullish se bearish ki taraf badal raha hai.
            2. Confirmation: Hanging Man signal ko verify karne ke liye dusre technical indicators ya candlestick patterns ka sahara lein. Volume, RSI, ya MACD jaise indicators se pattern ki reliability badh sakti hai.
            3. Entry aur Exit Points: Trades ke liye potential entry aur exit points ka pata lagane ke liye Hanging Man pattern ka istemal karein. Jab yeh pattern kisi significant resistance level par aata hai, to traders short positions ya long positions ko bandh sakte hain.

            .
            • #36 Collapse

              Click image for larger version

Name:	images (1) (18).jpeg
Views:	38
Size:	16.3 کلوبائٹ
ID:	12874242 "Hanging man" candlestick pattern ek bearish reversal pattern hai jo typically uptrend ke baad appear hota hai. Is pattern ko ek single candlestick represent karta hai jiska appearance bullish trend ke exhaustion ya reversal ki sambhavna ko indicate karta hai.

              Hanging man candlestick ek long lower shadow ke saath hota hai, jise tail bhi kaha jata hai, aur ek small real body jo upper shadow ya wick ke saath hota hai. Real body usually short hoti hai aur upper shadow ke barabar ya usse choti hoti hai.

              Hanging man pattern ka interpretation ye hota hai ke buyers ne initially control maintain kiya tha, lekin phir se sellers control mein aaye aur price ko neeche le gaye. Is pattern ke appearance ke baad, bearish reversal ki sambhavna hoti hai, especially agar iska confirmation next candlestick ke through milta hai.

              Traders hanging man pattern ko identify karke bearish reversal ki expectations ko consider karte hain aur apni trading strategies ko accordingly adjust karte hain. Agar hanging man pattern uptrend ke baad appear hota hai, toh traders selling opportunities search karte hain ya phir apne long positions ko hedge karte hain.

              Hanging man pattern ka istemal karke traders ko market ke momentum aur possible reversals ko anticipate karne mein madad milti hai. Iske alawa, is pattern ko confirm karne ke liye additional technical analysis aur price action ki zaroorat hoti hai.

              In conclusion, hanging man candlestick pattern ek bearish reversal pattern hai jo uptrend ke baad appear hota hai. Is pattern ko identify karke traders bearish reversal ki expectations ko samajh sakte hain aur apni trading decisions ko improve kar sakte hain.


              Click image for larger version

Name:	images (1) (18).jpeg
Views:	44
Size:	16.3 کلوبائٹ
ID:	12874241 ​​​​​​
              • #37 Collapse

                What is hanging man candlestick pattern in forex trading .

                As salam o alaikum dosto, Hanging Man ik candlestick pattern hy jo forex market main aksar dekha jata hy. Ye pattern market main trend reversal ki nishani ho sakta hy or traders ky liye ahem hota hy.Hanging Man pattern ik potential reversal signal deta hy. Iska matlab hy ky agar ye pattern uptrend ky baad aata hy, to ye bearish reversal ki taraf ishara kar sakta hy. Lekin isky liye confirmation ki zaroorat hoti hy, jo dusry technical indicators ya patterns sy ati hy.

                Trading strategy with hanging man candlestick pattern.

                Dear trading members, Hanging Man candlestick pattern market chart par dikhe, to iska matlab hy ky market main bullish trend week ho sakta hy or bearish reversal hony ky chances hain. Is pattern ki tafseel sy samjha jaye to, buyers initially strong thy, lekin sellers ny market ko control kr liya hy or price nichy jany ky liye tayar hain. Isy samjha jata hy ky buyers or sellers ky darmiyan conflict hy or bearish trend shuru ho sakta hy. Forex trading main Hanging Man candlestick pattern ko samajhna or istemal karna ahem hy. Jab ap is pattern ko market chart pr dekhty hain, to ap ko samajhna chahiye ky iska kiya matlab hy or kis tarah ky trades is pattern ky sath kiye ja sakty hain. Agar Hanging Man uptrend ky baad ata hy or market strong bearish reversal signal dy raha hy, to traders bearish positions enter kr sakty hain ya existing long positions ko close kr sakty hain. Lekin yaad rahy ky sirf ik candlestick pattern par pura trust na karen. Is pattern ko dusry technical indicators or price action ky sath mil kar istemal karna behtar hota hy. Risk management bhi ahem hy, ta ky nuksan sy bacha ja saky.


                ​​​importance of hanging man candlestick pattern.

                Hello dosto, Hanging man candlestick pattern ik single candlestick pattern hy, jo ky prices ky top ya bullish trend main banti hy. Price chart pattern pr baaz auqat single candlestick bhi dusry candlesticks charts pattern ki tarah k asraat rakhty hain, jab bhi ye candlesticks prices ky top ya bottom par banty hain. Hanging man candlestick ky ik small real body hoti hy, jis ka lower side par ik long shadow banta hy. Ye shadow Hanging man candlestick ki real body ka taqreeban dugna ya ussy ziada hota hy. Hanging man candlestick ki real body ky upper side par koi wick ya shadow nahi banta yani candlestick ki real body ka upside ik "Bozu" candle hoti hy, lekin agar ik small wick ban bhi jaye to bhi acceptable hy, lekin bht zyada lamba na ho jis sy candlestick ki khasusiyat tabdeel ho jaye.
                • #38 Collapse


                  Hanging man candle stick pattern?

                  Hanging Man Candlestick Pattern Kya Hai?

                  Hanging Man candlestick pattern ek single candlestick pattern hai jo typically bullish trend ke end ko indicate karta hai aur bearish reversal ke possibility ko darust karta hai. Ye pattern typically uptrend ke doran dekha jata hai aur ek potential trend reversal ko darust karta hai. Hanging Man candlestick ek lambi upper shadow (ya wick) ke sath ek chhoti body aur lambi lower shadow ke sath hota hai, jo ek candlestick pattern ki pehchan hoti hai.


                  Click image for larger version

Name:	B25.png
Views:	36
Size:	3.4 کلوبائٹ
ID:	12889256


                  Hanging Man Pattern Ki Pehchan:

                  Hanging Man pattern ki pehchan karna kuch asan steps mein ki ja sakti hai:
                  1. Upper Shadow: Hanging Man candlestick ki upper shadow ya wick, body se bara hota hai aur ye indicate karta hai ke price ne trading session ke doran high level tak pahuncha tha. Iska hona bullish sentiment ko indicate karta hai.
                  2. Body: Hanging Man candlestick ki body chhoti hoti hai aur typically upper shadow ke neeche hoti hai. Is body ke size ki koi khaas ahmiyat nahi hoti, lekin agar body ki size chhoti hai aur lower shadow lambi hai to ye pattern aur bhi reliable ho jata hai.
                  3. Lower Shadow: Hanging Man candlestick ki lower shadow ya wick lambi hoti hai aur body se neeche extend hoti hai. Ye indicate karta hai ke price session ke doran neeche gaya tha, lekin phir se upper taraf wapas aya. Is lower shadow ka hona bearish pressure ko darust karta hai.

                  Hanging Man Pattern Aur Trading Strategies:

                  Hanging Man candlestick pattern ko trading strategies mein shamil karne ke liye kuch mukhtalif approaches istemal kiye ja sakte hain:
                  1. Confirmation Ke Liye Wait Karna: Hanging Man pattern ko confirm karne ke liye traders ko next trading session ka wait karna chahiye. Agar next session mein price Hanging Man ke neeche close hoti hai to ye pattern confirm hota hai aur bearish reversal ka signal milta hai.
                  2. Stop Loss Aur Entry Points: Agar traders Hanging Man pattern ko dekhte hain to wo apne entry aur stop loss points ko set kar sakte hain. Agar Hanging Man pattern ko confirm kiya gaya hai to entry point neeche set kiya ja sakta hai aur stop loss upper side par lagaya ja sakta hai.
                  3. Dusre Indicators Ke Sath Confirmation: Hanging Man pattern ko confirm karne ke liye traders dusre technical indicators jese ke moving averages, RSI, aur MACD ka istemal bhi kar sakte hain. Agar ye indicators bhi bearish signals de rahe hain to Hanging Man pattern ka bearish reversal ka chance aur bhi zyada hota hai.
                  4. Multiple Time Frame Analysis: Hanging Man pattern ko confirm karne ke liye traders multiple time frame analysis ka istemal bhi kar sakte hain. Agar Hanging Man pattern ek higher time frame par dekha gaya hai to ye aur bhi reliable hota hai.

                  Conclusion:

                  Hanging Man candlestick pattern forex trading mein ek ahem technical indicator hai jo bullish trend ke end ko indicate karta hai aur bearish reversal ka signal deta hai. Is pattern ko samajhna aur sahi tareeqay se istemal karna traders ke liye zaroori hai taake wo market ke movements ko samajh sakein aur sahi trading decisions le sakein. Lekin, Hanging Man pattern ko istemal karte waqt zaroori hai ke traders dusre technical indicators aur analysis tools ka bhi istemal karein taake wo apne trades ko further confirm kar sakein aur risk ko minimize kar sakein.


                  • #39 Collapse

                    Hanging Man Candlestick Pattern Key Characteristics:


                    Click image for larger version

Name:	download (26).jpeg
Views:	33
Size:	13.5 کلوبائٹ
ID:	12889271


                    **1. Hanging Man Candlestick Pattern (Latakta Huwa Aadmi Mombatti Patti)**
                    **2. Mombatti Patti Ki Khaas Eigenschaften **

                    Mombatti Patti, ek aham Japanese candlestick pattern hai jo bearish trend ke baad milti hai aur bearish reversal ka indication deti hai. Is pattern ko pehchanne ke liye kuch khaas characteristics hote hain:

                    **3. Shararat **

                    Mombatti Patti ki sab se pehli khaas eigenschaft hai uska lamba shadow (dhayaan) aur chhota body. Shadow, candlestick ki upper tail ya lower tail hoti hai, jo price movement ko darust karti hai.

                    **4. Lambi Shadow **

                    Mombatti Patti mein shadow, candlestick ki body se lambi hoti hai. Yeh upper shadow hai jo candlestick ke upper end se extend hoti hai, aur isko "latakta huwa" shape deti hai, jisse pattern ka naam bhi mila hai.

                    **5. Chhoti Body **

                    Mombatti Patti ki body chhoti hoti hai aur usually upper end se shuru hoti hai. Body ki chhotai aur shadow ki lambai, pattern ke bearish reversal ko indicate karte hain.

                    **6. Candlestick Ka Colour **

                    Hanging Man pattern ka body red (bearish) ho sakta hai, lekin kabhi kabhi ise green (bullish) bhi dekha ja sakta hai. Waise to red colour bearish trend ko darust karta hai, lekin body ka size aur shadow ka lambai, reversal ke liye zyada important hote hain.

                    **7. Price Confirmation **

                    Hanging Man pattern ko validate karne ke liye, iske pehle bearish trend ki zarurat hoti hai. Yani, hanging man candlestick ke baad ek downtrend ya bearish movement hona zaruri hai taake reversal ko confirm kiya ja sake.

                    **8. Conclusion **

                    Mombatti Patti ek mukhtasir lekin powerful candlestick pattern hai jo bearish reversal ko darust karta hai. Iske key characteristics, jaise lambi shadow, chhoti body, aur price confirmation, traders ko market mein reversals ko pehchanne mein madad karte hain. Pattern ko sahi tarah se pehchanna aur confirm karna, trading decisions ko improve karne mein madadgar ho sakta hai.
                    • #40 Collapse


                      Hanging man candle stick pattern kai hy


                      Hanging Man Candlestick Pattern: Ek Taar Lagaye Huye Mardana (Candlestick) Patter

                      Candlestick charts, originally developed by Japanese rice traders in the 18th century, are widely used in technical analysis to predict price movements in financial markets. Among the various patterns that traders study, the "Hanging Man" is one that often signals a potential reversal in the market trend.

                      Madarat (Introduction) Hanging Man candlestick pattern, known as "Taar Lagaye Huye Mardana" in Urdu, is a single candlestick pattern that typically occurs at the end of an uptrend. It is characterized by a small body with a long lower shadow and little to no upper shadow, resembling a hanging man.

                      Pechan (Identification) The Hanging Man pattern is identified by the following characteristics:
                      1. The candlestick has a small real body near the low of the trading range.
                      2. It has a long lower shadow that is about two to three times the length of the body.
                      3. There is little to no upper shadow, or it is very small.
                      4. It appears after a notable uptrend.

                      Mafahimat (Interpretation) The Hanging Man pattern suggests that despite the market opening higher and rallying during the session, selling pressure pushed prices back down to close near the session's lows. This indicates potential weakness in the uptrend and a possible reversal in sentiment from bullish to bearish.

                      Muhawara (Example) For example, suppose a stock has been steadily rising over several trading sessions. Suddenly, a Hanging Man candlestick appears after a particularly bullish session. This could indicate that buyers are losing control, and sellers are starting to gain strength, potentially signaling a reversal in the stock's upward momentum.

                      Tawajjuhat (Considerations) It's important for traders to not rely solely on the Hanging Man pattern for making trading decisions but to consider it alongside other technical indicators and analysis techniques for confirmation. Additionally, the effectiveness of this pattern can vary depending on the overall market context and should be used in conjunction with risk management strategies.

                      Ikhtitami Alfaz (Conclusion) In conclusion, the Hanging Man candlestick pattern, or "Taar Lagaye Huye Mardana," serves as a valuable tool for traders in identifying potential trend reversals in the financial markets. By understanding its characteristics and interpreting its implications within the broader market context, traders can make more informed decisions to manage risk and capitalize on market opportunities.


                      • #41 Collapse

                        ### Hanging Man Candlestick Pattern Kya Hai?
                        Hanging Man candlestick pattern ek bearish reversal signal hai jo technical analysis mein market ke potential downturn ko identify karne ke liye use hota hai. Yeh pattern price charts par ek distinct shape ke roop mein dikhai deta hai aur traders ko market ke reversal points ko samajhne mein madad karta hai. Aaj hum discuss karenge ke Hanging Man pattern kya hota hai, iski characteristics kya hain, aur trading mein iska kaise use kiya jata hai.

                        **Hanging Man Pattern Ka Basic Concept:**

                        Hanging Man pattern ek single candlestick pattern hai jo uptrend ke baad develop hota hai. Is pattern ko “Hanging Man” isliye kaha jata hai kyunki iski appearance ek insaan ke latakte hue body ki tarah hoti hai, jisme ek chhoti body aur ek lambi lower shadow hoti hai. Yeh pattern bearish market reversal ka signal hota hai.

                        **Pattern Ki Characteristics:**

                        1. **Candlestick Formation:**
                        - **Body:** Hanging Man pattern ki body chhoti hoti hai aur generally red ya black color ki hoti hai. Body market ke open aur close ke beech ka range represent karti hai.
                        - **Lower Shadow:** Is pattern ka most distinctive feature uski long lower shadow hoti hai jo ek significant price drop ko indicate karti hai.
                        - **Upper Shadow:** Upper shadow ya to minimal hoti hai ya bilkul non-existent hoti hai.

                        2. **Location:**
                        - Yeh pattern tab develop hota hai jab market ek uptrend mein hoti hai. Hanging Man pattern ka formation market ke peak par hota hai aur yeh indicate karta hai ke buying pressure ke bawajood selling pressure barh raha hai.

                        3. **Confirmation:**
                        - Hanging Man pattern ko bearish reversal signal ke roop mein tab confirm kiya jata hai jab next candlestick ek strong bearish candlestick hoti hai jo Hanging Man pattern ke body ke niche close hoti hai. Yeh confirmation signal hota hai ke market mein selling pressure increase ho raha hai aur price drop ho sakti hai.

                        **Trading Mein Hanging Man Pattern Ka Use:**

                        1. **Bearish Reversal Indicator:**
                        - Hanging Man pattern ek bearish reversal ka signal hota hai. Yeh pattern market ke uptrend ke peak par banata hai aur traders ko potential downtrend ko identify karne mein madad karta hai.

                        2. **Entry Aur Exit Points:**
                        - Entry points ko pattern ke confirmation ke baad consider kiya jata hai. Agar next candlestick bearish hoti hai, to traders sell positions enter kar sakte hain. Exit points ko target prices aur stop-loss levels ke basis par determine kiya jata hai.

                        3. **Risk Management:**
                        - Risk management strategies ko implement karna zaroori hai. Stop-loss orders ko pattern ke high ke upar set karna aur target prices ko market analysis ke basis par adjust karna chahiye. Yeh unexpected market fluctuations se protection provide karta hai.

                        **Conclusion:**

                        Hanging Man candlestick pattern ek effective tool hai jo bearish market reversals ko identify karne mein madad karta hai. Is pattern ko samajhkar aur market conditions ke saath combine karke, traders accurate trading decisions le sakte hain aur market trends ko effectively analyze kar sakte hain. Hanging Man pattern ka sahi use trading strategies ko enhance karta hai aur market ke potential downturns ko predict karne mein madad karta hai.
                        • #42 Collapse

                          Hang Man Candlestick Pattern: Ek Jaiza


                          1. Hang Man Candlestick Pattern Kya Hai?
                          Hang Man Candlestick Pattern aik bearish reversal signal hai jo market ke bullish trend ke aakhir mein banta hai. Yeh pattern do candles ka istamal karta hai: pehli candle ek bara bullish (green) candle hoti hai aur doosri candle aik choti bearish (red) candle hoti hai jo pehli candle ke upar hoti hai. Iska naam “Hang Man” is liye hai kyunki yeh aik insaan ki hanging position ki tarah nazar aata hai.

                          2. Hang Man Pattern Ka Nisar
                          Hang Man Pattern aam tor par aik bullish trend ke baad aata hai. Yeh is baat ka ishara hota hai ke buyers ki taqat kam ho rahi hai aur sellers ka dakhil hota ja raha hai. Iska asar yeh hota hai ke market neche ki taraf jata hai.

                          3. Hang Man Pattern Ki Tasveer
                          Hang Man Pattern ko samajhne ke liye iski tasveer ko dekhna zaroori hai. Pehli candle jab badi bullish hoti hai to yeh market ke maang ka izhar karti hai. Doosri candle choti hoti hai, jo ke high price level par khulti hai aur neeche close hoti hai, yeh asar dikhati hai ke sellers ne market par kabza kar liya hai.

                          4. Is Pattern Ki Pehchan
                          Is pattern ki pehchan karna aasaan hai. Jab aapko aik bullish trend ke baad pehli badi green candle nazar aaye aur uske baad aik choti red candle dekhein, jo ke pehli candle ke 50% ya usse zyada neeche close hoti hai, to yeh Hang Man Pattern ka nishan hai.

                          5. Hang Man Pattern Ki Importance
                          Hang Man Pattern traders ke liye bohot ahem hota hai kyunki yeh market ki direction ko badalne ki taraf ishara karta hai. Is pattern ko dekh kar traders decide karte hain ke unhe position close karni chahiye ya nahi.

                          6. Hang Man Pattern Ki Taaleem
                          Hang Man Pattern ko samajhne ke liye kuch basics zaroori hain. Aapko samajhna hoga ke market ka trend kya hai, aur is pattern ka kya asar ho sakta hai. Jab aap is pattern ko samjhenge, to aap trade karte waqt behtar faisle le sakte hain.

                          7. Hang Man Pattern Ka Jorur Dakhil
                          Is pattern ka sab se bara dakhil yeh hai ke yeh market ke reversal ka nishan hai. Agar aap is pattern ko sahi waqt par pehchan lete hain, to aap apni trading strategy mein behtari la sakte hain.

                          8. Hang Man Pattern Aur Volume
                          Hang Man Pattern ke sath volume bhi bohot ahem hai. Agar volume zyada hai to yeh is pattern ki credibility ko barhata hai. Agar volume kam ho to yeh signal kamzor hota hai. Is liye volume ka dekhna zaroori hai jab aap is pattern ko samjhte hain.

                          9. Hang Man Pattern Ka Use Kaise Karein
                          Hang Man Pattern ka istamal karte waqt aapko kuch chizain mad-e-nazar rakhni chahiye. Sab se pehle, aapko confirmation candle ka intezar karna chahiye. Iska matlab hai ke aapko agle din ya candle ka wait karna chahiye jo is pattern ki tasdiq kare.

                          10. Hang Man Pattern Ki Khatraat
                          Jab aap Hang Man Pattern ka istamal karte hain, to kuch khatraat bhi hoti hain. Kabhi kabar market is pattern ko nazar andaaz kar sakti hai aur bullish trend ko jaari rakh sakti hai. Isliye hamesha risk management ka khayal rakhein.

                          11. Hang Man Pattern Ka Chart Analysis
                          Chart analysis karte waqt aapko Hang Man Pattern ki pehchan karna aasan hoga agar aapko candlestick charts ka achi tarah maloomat ho. Aapko pata hona chahiye ke kaise patterns bante hain aur unka market par kya asar hota hai.

                          12. Hang Man Pattern Ki Trading Strategies
                          Hang Man Pattern ke liye trading strategies bhi hain. Aap is pattern ke baad sell position le sakte hain jab aapko confirmation candle nazar aaye. Aap stop-loss bhi set kar sakte hain taake agar market aapke against jaye to aapko zyada nuqsan na ho.

                          13. Hang Man Pattern Aur Risk Management
                          Risk management is pattern ke liye bohot zaroori hai. Agar aap risk ko manage nahi karte, to aapko bohot zyada nuqsan ho sakta hai. Isliye hamesha stop-loss aur risk-reward ratio ka khayal rakhein.

                          14. Nakhsa: Hang Man Candlestick Pattern
                          Nakhsa yeh hai ke Hang Man Candlestick Pattern ek ahem tool hai traders ke liye. Yeh aapko market ke reversal ke bare mein jald se jald aagah karta hai. Is pattern ko samajh kar, aap behtar trading decisions le sakte hain aur apni profitability ko barha sakte hain.
                          Khulasah


                          Hang Man Candlestick Pattern ek ahem trading signal hai jo market ke bearish reversal ko dikhata hai. Is pattern ko samajhne aur sahi waqt par pehchan karne se traders ko behtar mauqe milte hain, lekin risk management aur market volume ko dekhna bhi zaroori hai. Is pattern ka sahi istemal aapko trading mein behteri la sakta hai aur aapke profits ko barha sakta hai.

                          • <a href="https://www.instaforex.org/ru/?x=ruforum">InstaForex</a>
                          • #43 Collapse

                            Hanging man candle stick pattern?

                            Hanging man candlestick pattern ek technical analysis ka element hai jo khas tor par bearish reversal ka signal deta hai. Ye pattern aksar uptrend ke doran banta hai aur iski pehchan asan hoti hai. Ye ek single candlestick pattern hai jiska shape thoda unique hota hai. Is candlestick ka body choti hoti hai, jabke lower shadow bohot lambi hoti hai, jabke upper shadow nahi hoti ya phir bohot choti hoti hai.
                            Jab ye pattern banta hai, to iska matlab ye hota hai ke market ne kuch waqt tak bullish momentum dekha hai, lekin ab buying pressure kam ho gaya hai. Is candlestick ka low price bohot zyada niche jata hai, jo ye darshata hai ke sellers market me enter kar gaye hain. Iski lambi lower shadow ye dikhati hai ke buyers ne price ko niche aane se roknay ki koshish ki, lekin wo isme poori tarah se kamiyab nahi hue.

                            Hanging man pattern ka pehla step ye hota hai ke aapko dekhna hoga ke ye pattern kis tarah banta hai. Agar ye pattern kisi strong uptrend ke baad banta hai, to ye bearish reversal ka ek strong signal hota hai. Lekin agar ye pattern downtrend ke doran banta hai, to iski ahmiyat kam ho jati hai.

                            Is pattern ki confirmation ke liye aapko agle din ke price action ko dekhna hoga. Agar agle din ka candlestick hanging man ke niche close hota hai, to ye bearish signal ki confirmation hoti hai. Is waqt traders aksar short position lene ya existing long positions ko close karne ka faisla karte hain.

                            Traders is pattern ko sirf akeli candlestick ke tor par nahi dekhte, balki isay doosre technical indicators ke sath bhi istemal karte hain. Jaise ke volume analysis ya support and resistance levels. Agar volume badh raha ho jab ye pattern banta hai, to ye is signal ki mazid taqat darshata hai.

                            Hanging man pattern ko samajhne se aapko trading me bohot madad mil sakti hai. Ye aapko market ke trends aur reversals ko pehchan ne me madad karta hai. Is pattern ko dekh kar, traders apne entry aur exit points ko behtar tarike se plan kar sakte hain, jo unke trading strategy ko mazid behtar banata hai.

                            اب آن لائن

                            Working...
                            X