TMA Centered Bands Indicator.

No announcement yet.
`
X
  • وقت
  • دکھائیں
Clear All
new posts
  • #16 Collapse

    TMA Centered Bands Indicator.
    Forex trading mein, TMA Centered Bands Indicator ek aham tool hai jo traders ko market ke trend aur price movements ke baare mein jankari deta hai. Is article mein hum TMA Centered Bands Indicator ke bare mein Roman Urdu mein batayenge.

    Click image for larger version

Name:	images (52).jpeg
Views:	84
Size:	55.9 کلوبائٹ
ID:	12862050

    TMA Centered Bands Indicator ek technical analysis tool hai jo traders ko market ke trend aur price movements ke baare mein jankari deta hai. Yeh indicator Bollinger Bands ke jaisa hai, lekin ismein ek important difference hai. TMA Centered Bands Indicator mein price ke fluctuations ko calculate karne ke liye Triangular Moving Average (TMA) ka use kiya jata hai, jabki Bollinger Bands mein Simple Moving Average (SMA) ka use kiya jata hai.

    TMA Centered Bands Indicator Features.

    TMA Centered Bands Indicator ke kuch important features hai:

    1. Price Bands: TMA Centered Bands Indicator mein price ke fluctuations ko bands ke form mein dikhaya jata hai. Yeh bands price ke fluctuations ke upar aur neeche hote hai aur traders ko price movements ke direction ke baare mein jankari dete hai.

    2. Trend Identification: TMA Centered Bands Indicator traders ko trend ke baare mein jankari deta hai. Agar price bands upar ki taraf hote hai toh trend bullish hota hai aur agar neeche ki taraf hote hai toh trend bearish hota hai.

    3. Volatility: TMA Centered Bands Indicator mein volatility ko bhi dikhaya jata hai. Agar price bands tight hote hai toh volatility kam hoti hai aur agar wide hote hai toh volatility high hoti hai.

    Click image for larger version

Name:	images (82).png
Views:	62
Size:	30.9 کلوبائٹ
ID:	12862051

    4. Entry and Exit Points: TMA Centered Bands Indicator ke use se traders ko entry aur exit points ka pata chalta hai. Agar price bands upar ki taraf hote hai toh traders buy positions lete hai aur agar neeche ki taraf hote hai toh traders sell positions lete hai.

    TMA Centered Bands Indicator ka Use Kaise Kare?

    TMA Centered Bands Indicator ka use karne ke liye traders ko kuch simple steps follow karne hote hai:

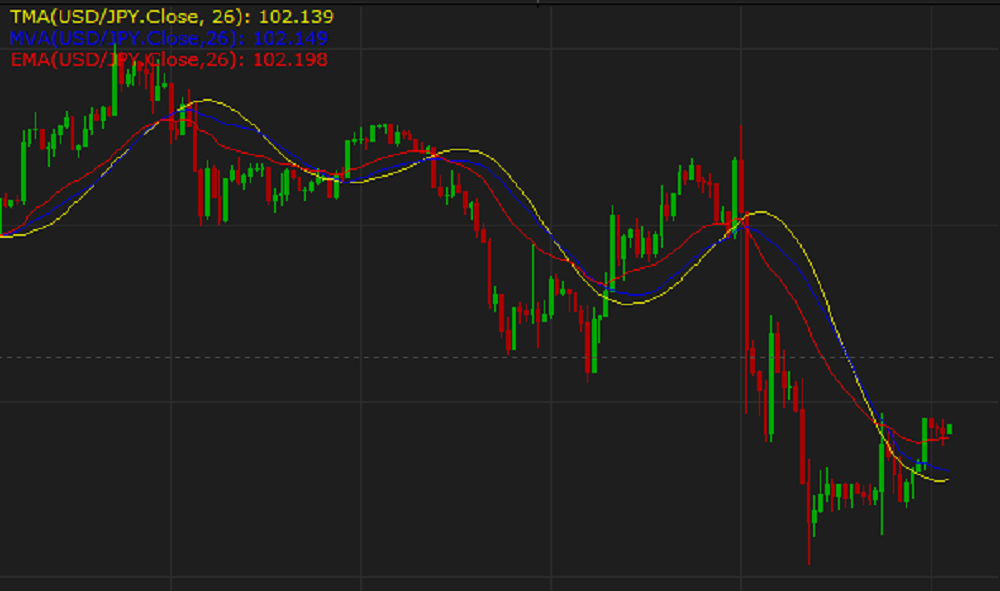
    1. Indicator Install Kare: Sabse pehle traders ko apne trading platform mein TMA Centered Bands Indicator install karna hoga.

    2. Timeframe Select Kare: Traders ko timeframe select karna hoga jis par wo trading karna chahte hai.

    3. Indicator Settings Change Kare: Traders ko indicator settings ko apne trading strategy ke hisab se change karna hoga.

    4. Entry and Exit Points Identify Kare: Traders ko TMA Centered Bands Indicator ke use se entry aur exit points identify karna hoga.

    5. Stop Loss Aur Take Profit Set Kare: Traders ko apne positions ke liye stop loss aur take profit set karna hoga.

    Importants.

    TMA Centered Bands Indicator ek aham tool hai jo traders ko market ke trend aur price movements ke baare mein jankari deta hai. Is indicator ke use se traders apne trading strategy ko improve kar sakte hai aur profit earn kar sakte hai.


    • <a href="https://www.instaforex.org/ru/?x=ruforum">InstaForex</a>
    • #17 Collapse


      TMA Centered Bands Indicator: A Tool for Technical Analysis

      Technical analysis is a crucial aspect of trading in financial markets, aiding traders in making informed decisions based on historical price data. Among the myriad of technical indicators available, the Triangular Moving Average (TMA) Centered Bands Indicator stands out as a valuable tool for market analysis and decision-making.
      TMA Centered Bands: An Overview


      TMA Centered Bands Indicator is derived from the concept of moving averages, which smoothes out price data to identify trends more effectively. Unlike traditional moving averages, TMA Centered Bands offer a unique perspective by employing a triangular calculation method.

      The TMA calculation involves taking the average of prices over a specified period, applying a weight that decreases linearly, forming a triangular distribution. This method places more weight on recent prices, making it responsive to short-term market movements while still capturing the overall trend.
      Understanding the Indicator


      TMA Centered Bands consist of three lines:
      1. Upper Band: This line represents the highest TMA value over the specified period, indicating potential resistance levels.
      2. Lower Band: Conversely, the lower band represents the lowest TMA value over the specified period, suggesting potential support levels.
      3. Center Line: The center line is the average of the upper and lower bands, providing a midpoint reference for price action.
      Application in Trading


      Traders utilize TMA Centered Bands in various ways to analyze market trends and make trading decisions:
      1. Trend Identification: By observing the slope and positioning of the bands relative to each other, traders can identify the direction and strength of the prevailing trend. An upward slope suggests a bullish trend, while a downward slope indicates a bearish trend.
      2. Support and Resistance Levels: The upper and lower bands serve as dynamic support and resistance levels, offering potential entry and exit points for trades. Traders often look for price bounces off these bands to confirm support or resistance levels.
      3. Volatility Analysis: The width of the bands provides insights into market volatility. Narrow bands indicate low volatility, signaling potential consolidation or range-bound trading, whereas widening bands suggest increasing volatility and possible breakout opportunities.
      4. Confirmation with Other Indicators: Traders often combine TMA Centered Bands with other technical indicators, such as oscillators or volume analysis, to confirm signals and improve the accuracy of their trading decisions.
      Limitations and Considerations


      While TMA Centered Bands offer valuable insights into market trends and potential reversal points, traders should be aware of certain limitations:
      1. Lagging Indicator: Like most moving averages, TMA Centered Bands are lagging indicators, meaning they react to price movements rather than predicting them. Therefore, they may not provide timely signals in rapidly changing market conditions.
      2. False Signals: During periods of low volatility or ranging markets, TMA Centered Bands may generate false signals, leading to inaccurate trading decisions. Traders should exercise caution and use additional confirmation tools to filter out such signals.
      Conclusion


      The TMA Centered Bands Indicator is a powerful tool in the arsenal of technical analysts, offering insights into market trends, support and resistance levels, and volatility dynamics. By understanding how to interpret and apply this indicator effectively, traders can enhance their decision-making process and improve their trading outcomes in various financial markets.

      Incorporating the TMA Centered Bands into a comprehensive trading strategy, alongside other technical and fundamental analysis tools, can provide traders with a holistic view of market dynamics, enabling them to navigate the complexities of the financial markets with confidence and precision.
      • #18 Collapse


        TMA Centered Bands Indicator.


        Click image for larger version

Name:	download (63).png
Views:	68
Size:	8.8 کلوبائٹ
ID:	12862106

        TMA Centered Bands Indicator:

        TMA Centered Bands Indicator Kya Hai?

        TMA (Triangular Moving Average) Centered Bands Indicator ek technical analysis tool hai jo price volatility ko measure karta hai aur trading ranges ko identify karta hai. Yeh bands price chart par display hoti hain aur price movements ko analyze karne mein madad deti hain.

        TMA Centered Bands Indicator Ki Tafseel:
        1. Formation (Banao):
          TMA Centered Bands Indicator three lines ya bands se bana hota hai. Yeh bands typically price ke aas paas move karte hain aur volatility ke levels ko represent karte hain.
        2. Bands Ka Calculation (Hisaab):
          TMA bands ka calculation price ke previous closing prices se hota hai. Is tarah ke calculations se ek centered average nikala jata hai jo price movements ko smooth karta hai.
        3. Significance (Ahmiyat):
          TMA Centered Bands Indicator price volatility aur trading ranges ko identify karne mein madad karta hai. Jab price bands ke beech hota hai, toh yeh indicate karta hai ke market range-bound hai. Jab price bands ko cross kiya jata hai, toh yeh indicate karta hai ke market mein potential trend change ho sakta hai.

        TMA Centered Bands Indicator Mein Trading:
        1. Trend Identification (Trend Ka Pata Lagana):
          TMA Centered Bands Indicator ko istemal karke traders trend ko identify karte hain. Agar price bands ke beech hai aur bands narrow hain, toh yeh indicate karta hai ke market range-bound hai. Agar price bands ko cross kiya jata hai aur bands widen hote hain, toh yeh indicate karta hai ke market mein potential trend change ho sakta hai.
        2. Volatility Analysis (Volatility Ki Tehqiq):
          TMA Centered Bands Indicator volatility levels ko bhi measure karta hai. Agar bands widen hote hain, toh yeh indicate karta hai ke market ki volatility increase ho rahi hai. Agar bands narrow hote hain, toh yeh indicate karta hai ke market ki volatility decrease ho rahi hai.
        3. Entry aur Exit Points (Daakhil aur Nikalne Ke Points):
          Traders TMA Centered Bands Indicator ke signals ko istemal karke entry aur exit points determine karte hain. Agar price bands ko cross kiya jata hai, toh traders entry aur exit points set karte hain.

        Muqadma: TMA Centered Bands Indicator ek important technical analysis tool hai jo traders ko price volatility aur trading ranges ko identify karne mein madad deta hai. Is indicator ko samajh kar traders apne trading strategies ko improve kar sakte hain aur market movements ko sahi tareeqe se analyze kar sakte hain. Lekin, zaroori hai ke traders is indicator ke signals ko sahi tareeqe se interpret karein aur confirmatory indicators ka bhi istemal karein.
        • #19 Collapse

          Click image for larger version

Name:	tma.png
Views:	63
Size:	9.9 کلوبائٹ
ID:	12862115

          TMA Centered Bands Indicator" ka istemal tijarat mein kisi bhi aset ke kefiyat aur trendon ko samajhne ke liye kia jata hai. Ye indicator market ke fluctuations ko analyze karne mein madadgar hota hai aur traders ko potential entry aur exit points ki pehchan mein madad karta hai.TMA, ya Triangular Moving Average, ek specific type ka moving average hai jo keemaat ke data ko smooth karne ke liye istemal hota hai. Iska "Centered Bands" hissa ye darust karta hai ke market ki halaat kis tarah se changing hain.TMA Centered Bands Indicator ke kuch ahmiyat points hain:

          Trend Identification:

          Indicator ke istemal se traders ko market ke trend ka pata chalta hai. Agar TMA bands expand ho rahe hain, toh ye indicate karta hai ke market mein volatility barh rahi hai, aur agar contract ho rahe hain, toh ye low volatility ya consolidation ko darust karta hai.

          Entry and Exit Points:

          TMA Centered Bands Indicator traders ko entry aur exit points ke liye madad karta hai. Jab bands ke beech ka area chhota ho, toh ye indicate karta hai ke market stable hai aur shayad trend reversal hone wala hai. Traders is information ka istemal karke apne positions ko manage kar sakte hain.

          Volatility Analysis

          Indicator volatility ko measure karta hai, jo traders ke liye zaroori hota hai. High volatility mein trading karna riskier hota hai, jabki low volatility mein trading relatively stable hoti hai. TMA Centered Bands ye information provide karta hai ke market kitna volatile hai.

          Market Range:

          TMA Centered Bands traders ko ye bhi dikhata hai ke market kitna range-bound hai. Range-bound markets mein traders ko different trading strategies apnani padti hain.Is indicator ki ahmiyat is par depend karti hai ke traders kis tarah se iska istemal karte hain aur unke trading strategy aur goals kya hain. Har ek trader apne risk tolerance aur trading style ke mutabiq is indicator ko customize karke istemal karta hai.


          • #20 Collapse

            TMA Centered Bands Indicator.


            Click image for larger version

Name:	download (66).png
Views:	62
Size:	9.5 کلوبائٹ
ID:	12862117

            TMA Centered Bands Indicator:

            TMA Centered Bands Indicator Kya Hai?

            TMA (Triple Moving Average) Centered Bands Indicator ek technical analysis tool hai jo price chart par trend ka pata lagane aur volatility ko samajhne ke liye istemal kiya jata hai.

            TMA Centered Bands Indicator Ki Tafseel:
            1. Formation (Banao):
              TMA Centered Bands Indicator teen moving averages se bana hota hai: ek short-term moving average, ek medium-term moving average, aur ek long-term moving average. In teeno moving averages ka average calculate karke ek centered band banaya jata hai.
            2. Significance (Ahmiyat):
              TMA Centered Bands Indicator trend ko identify karne mein madad karta hai aur volatility ko measure karta hai. Price chart par bands ke beech ka space volatility ko darust karta hai.
            3. Usage (Istemal):
              • Bands ke beech ka space narrow hone par yeh indicate karta hai ke market mein volatility kam ho rahi hai.
              • Bands ke beech ka space wide hone par yeh indicate karta hai ke market mein volatility zyada hai.
              • Price jab bands ke upper ya lower edge ko cross karta hai, toh yeh potential trading signals ko generate karta hai.

            TMA Centered Bands Indicator mein Trading:
            1. Entry Points (Daakhil Points):
              • Jab price bands ke upper edge ko cross karta hai, toh yeh bullish signal generate hota hai aur traders long positions le sakte hain.
              • Jab price bands ke lower edge ko cross karta hai, toh yeh bearish signal generate hota hai aur traders short positions le sakte hain.
            2. Stop Loss aur Take Profit Levels (Khatra Nigrani aur Maqsood Hajam):
              Har trade ke liye stop loss aur take profit levels ko set karna zaroori hai. Stop loss aur take profit levels ko bands ke opposite side par set kiya jata hai.
            3. Risk Management (Khatra Nigrani):
              Trading ke dauran, risk management ka khaas khayal rakha jata hai. Traders apne positions ke size ko apne account size aur risk tolerance ke mutabiq adjust karte hain.

            Muqadma: TMA Centered Bands Indicator ek mufeed tool hai jo traders ko trend aur volatility ke baray mein maloomat faraham karta hai. Is indicator ko sahi tareeqe se samajh kar aur doosre confirmatory indicators ke saath istemal karke traders apne trading strategies ko improve kar sakte hain.
            • #21 Collapse

              TMA Centered Bands Indicator

              TMA (Triangular Moving Average) Centered Bands Indicator ek technical analysis tool hai jo price volatility ko measure karne aur trading ranges ko identify karne mein madad karta hai. Ye indicator moving averages par mabni hota hai aur price ke around bands create karta hai.

              Yeh indicator typically do lines se banta hai:

              Upper Band

              Upper band TMA ke calculation ke hisaab se calculate hoti hai aur typically standard deviations se define ki jati hai. Ye band price ke upar aur volatility ke increase hone ko represent karta hai. Agar price upper band se bahar nikalta hai, toh yeh indicate karta hai ki market overbought ho sakta hai aur reversal ka possibility hai.

              Lower Band

              Lower band bhi TMA ke calculation ke hisaab se calculate hoti hai aur price ke niche aur volatility ke decrease hone ko represent karta hai. Agar price lower band se bahar nikalta hai, toh yeh indicate karta hai ki market oversold ho sakta hai aur reversal ka possibility hai.

              TMA Centered Bands Indicator ka main feature hai ki ye price volatility ke variations ko smoothen karta hai, jisse traders ko clear trading ranges provide hoti hain. Is indicator ka use primarily trend analysis, volatility analysis aur price reversals ke liye kiya jata hai.

              Traders is indicator ko istemal karke trend direction aur price movements ka analysis karte hain. Jab price upper band ke paas jaata hai, toh yeh bullish momentum ko darust karta hai. Jab price lower band ke paas jaata hai, toh yeh bearish momentum ko darust karta hai. Is indicator ke saath, traders stop-loss aur target levels set karte hain taaki unka risk management improve ho sake.

              TMA Centered Bands Indicator ek useful tool hai jo traders ko market volatility aur trend direction ka analysis karne mein madad karta hai. Lekin, hamesha yaad rakhein ke kisi bhi single indicator par poora bharosa na karein aur hamesha aur analysis ke saath apna trading decision len.
              Click image for larger version

Name:	tma centered bands arrows mt5.png
Views:	69
Size:	6.8 کلوبائٹ
ID:	12862190

              TMA Centered Bands Indicator ke alawa, yeh mukhya features aur tafseelat hai jo traders ko is indicator ka istemal karne mein madad karte hain:

              Adaptive Volatility

              TMA Centered Bands Indicator adaptive volatility ka ek behtareen measure hai. Kyunki ismein bands price volatility ke according adjust hote hain, isliye yeh market ki changing volatility ko achhe se capture karta hai. Jab volatility badhti hai, bands bhi widen ho jaate hain aur jab volatility kam hoti hai, bands narrow ho jaate hain.

              Trend Identification

              Is indicator ka istemal trend identification ke liye bhi kiya jata hai. Jab price upper band ke pass jaata hai aur bands widen hote hain, toh yeh bullish trend ko darust karta hai. Jab price lower band ke pass jaata hai aur bands narrow hote hain, toh yeh bearish trend ko darust karta hai.

              Range Expansion and Contraction

              TMA Centered Bands Indicator ke through traders price range ka expansion aur contraction ka pata lagate hain. Jab bands widen hote hain, toh yeh indicate karta hai ki market mein volatility badh rahi hai aur price range bhi bada ho raha hai. Jab bands narrow hote hain, toh yeh indicate karta hai ki market mein volatility kam ho rahi hai aur price range chhota ho raha hai.

              Reversal Signals

              Jab price upper band se bahar jaata hai aur phir wapas lower band ke andar aata hai, ya fir jab price lower band se bahar jaata hai aur phir wapas upper band ke andar aata hai, toh yeh reversal signals ko indicate karta hai. Traders is indicator ka istemal karke trend reversals ka pata lagate hain aur trading strategies ko adjust karte hain.

              Confirmation with Other Indicators

              TMA Centered Bands Indicator ko doosre indicators ke saath combine karke bhi istemal kiya ja sakta hai. Jaise ki, agar price upper band ke pass jaata hai aur RSI (Relative Strength Index) overbought zone mein jaata hai, toh yeh ek strong sell signal ho sakta hai.

              Risk Management

              Is indicator ka istemal karke traders apne risk management ko bhi improve kar sakte hain. Stop-loss aur target levels ko set karne mein aur position sizing ke decisions lene mein iska istemal kiya ja sakta hai.

              Overall, TMA Centered Bands Indicator ek versatile tool hai jo traders ko market volatility, trend direction aur price movements ka analysis karne mein madad karta hai. Lekin, hamesha yaad rakhein ke kisi bhi single indicator par poora bharosa na karein aur hamesha aur analysis ke saath apna trading decision len
              • #22 Collapse


                TMA Centered Bands Indicator.

                Click image for larger version

Name:	images (24).jpeg
Views:	60
Size:	17.4 کلوبائٹ
ID:	12862207​​​​​​​

                TMA Centered Bands Indicator


                TMA: Triangular Moving Average

                TMA Centered Bands Indicator ek technical analysis tool hai jo traders ko market trends ka analysis karne mein madad karta hai. Yeh indicator price action ko analyze karke trend direction aur volatility ka estimate karta hai.

                Triangular Moving Average (TMA)

                TMA ek specific type ka moving average hai jo prices ko smooth karne aur trends ko identify karne ke liye istemal hota hai. Ismein current price ke aas paas ke prices ka weighted average liya jata hai, jisse ek smooth aur centered trend line generate hota hai.

                Construction

                TMA Centered Bands Indicator ko banane ke liye, pehle TMA calculate ki jati hai. Phir is TMA line ko do bands se surround kiya jata hai: upper band aur lower band. Upper band TMA line ke upar ek fixed deviation distance par hoti hai, jabki lower band TMA line ke neeche hoti hai. Ye bands volatility ko darust karte hain aur price ke fluctuations ko capture karte hain.

                Interpretation
                • Trend Direction: Jab TMA line upward direction mein hai aur price upper band ke paas hai, yeh bullish trend indicate karta hai. Jab TMA line downward direction mein hai aur price lower band ke paas hai, yeh bearish trend indicate karta hai.
                • Volatility: Agar bands expand hote hain, toh yeh volatility increase ko darust karta hai, jabki contraction mein volatility decrease hoti hai.
                • Reversals: Jab price bands ke beech mein se cross karta hai, yeh ek potential reversal signal ho sakta hai, khaaskar agar yeh ek strong trend ke against ho.

                Conclusion

                TMA Centered Bands Indicator ek powerful tool hai jo traders ko trend direction aur volatility ke bare mein insight deti hai. Iska istemal karke traders market movements ko better understand kar sakte hain aur trading decisions ko improve kar sakte hain. Lekin, jaise har technical indicator ke saath, iska istemal bhi dusre confirming factors ke saath karna zaroori hai.


                • #23 Collapse

                  TMA Centered Bands Indicator:
                  Click image for larger version

Name:	images (5).png
Views:	64
Size:	13.7 کلوبائٹ
ID:	12862209
                  1. Ta'aruf (Introduction)
                  TMA Centered Bands Indicator ek technical analysis tool hai jo traders ko price volatility aur trend direction ko analyze karne mein madad karta hai. Is indicator ka full form "Triangular Moving Average Centered Bands" hai.

                  2. TMA Centered Bands Ki Pechan (Identification of TMA Centered Bands)
                  • Triangular Moving Average (TMA):
                    • TMA ek specific type ka moving average hai jo price volatility ko darust karta hai. Ismein current price aur past prices ka average liya jata hai.
                  • Centered Bands:
                    • TMA Centered Bands mein, ek centered moving average ke dono taraf equal distance par bands hote hain. Ye bands price ke volatility ko darust karte hain.
                  3. Indicator Ke Components (Indicator Ke Hissa)
                  • Upper Band:
                    • Upper band, centered moving average (CMA) ke upar ek fixed distance par hoti hai. Ye upper volatility limit ko darust karta hai.
                  • Lower Band:
                    • Lower band, centered moving average (CMA) ke neeche ek fixed distance par hoti hai. Ye lower volatility limit ko darust karta hai.
                  • Middle Band:
                    • Middle band, centered moving average (CMA) ko represent karta hai. Ye trend direction ko identify karta hai.
                  4. Indicator Ke Istemal (Usage of the Indicator)
                  • Volatility Analysis:
                    • TMA Centered Bands indicator volatility analysis ke liye istemal kiya jata hai. Jab price upper band se bahar jata hai, toh ye high volatility indicate karta hai, jabke lower band se bahar jata hai, toh ye low volatility indicate karta hai.
                  • Trend Confirmation:
                    • Middle band ke saath price ka comparison karke, traders trend direction ko confirm karte hain. Agar price upper band ke upar hai, toh bullish trend expected hoti hai aur agar lower band ke neeche hai, toh bearish trend expected hoti hai.
                  5. Limitations and Precautions (Hadood aur Hifazati Tadabeer)
                  • Whipsaw Signals:
                    • Kabhi-kabhi choppy markets mein TMA Centered Bands indicator whipsaw signals generate kar sakta hai, isliye confirmatory factors ka istemal zaroori hai.
                  • Market Conditions Ka Tawaju:
                    • High volatility ke doran, indicator ka istemal karne se pehle market conditions ka tawaju rakha jana chahiye taki false signals se bacha ja sake.
                  6. Ikhtitam (Conclusion)
                  TMA Centered Bands Indicator, traders ko price volatility aur trend direction ka pata lagane mein madad karta hai. Lekin, isay samajhne ke liye thorough research aur market analysis ki zaroorat hoti hai, aur hamesha confirmatory factors ka bhi khayal rakhna chahiye taki accurate trading decisions liye ja sakein.
                  • #24 Collapse

                    TMA Centered Bands Indicator.
                    Click image for larger version

Name:	tma centred.jpg
Views:	64
Size:	148.6 کلوبائٹ
ID:	12862235
                    I. Introduction

                    A. TMA Centered Bands Indicator Ki Tashreeh - TMA Centered Bands (Triangular Moving Average) ek technical analysis tool hai jo market trends ko identify karne aur trading decisions ke liye entry aur exit points tay karne mein istemal hota hai. - Ye indicator price volatility ko measure karta hai aur bands ke through price movements ko visualize karta hai.

                    II. TMA Centered Bands Indicator Ki Tashreeh

                    A. Structure - TMA Centered Bands indicator do main components se bana hota hai: upper band aur lower band. - Bands moving average ke around centered hote hain, jo ki price ke volatility ko reflect karte hain.

                    III. Key Features

                    A. Trend Following - TMA Centered Bands indicator trend following tool hai. - Jab price upper band ko cross karke upper mein move karta hai, to ye uptrend ka indication deta hai. Jab price lower band ko cross karke neeche move karta hai, to ye downtrend ka indication deta hai.

                    B. Volatility Measurement - Ye indicator price volatility ko measure karta hai. - Bands ka width price volatility ko darust karta hai; jab bands chauri hoti hain, to volatility zyada hoti hai aur jab narrow hoti hain, to volatility kam hoti hai.

                    IV. TMA Centered Bands Indicator Ka Istemal

                    A. Trend Analysis - TMA Centered Bands indicator ka istemal karke traders trend analysis karte hain. - Upper band ko uptrend ka indication aur lower band ko downtrend ka indication samjha jata hai.

                    B. Entry aur Exit Points - Traders is indicator ka istemal karke sahi entry aur exit points tay karte hain. - Upper band ko cross karke long positions lete hain aur lower band ko cross karke short positions lete hain.

                    V. Trading Mein Kamyabi Ke Liye Tareeqe

                    A. Sahi Tareeqe Se Analysis - TMA Centered Bands indicator ko sahi tareeqe se analyze karke traders apni trading decisions ko mazeed behtar bana sakte hain. - Is indicator ke signals ko samajh kar traders market ke movements ko samajh sakte hain aur trading mein kamyabi haasil kar sakte hain.

                    B. Risk Management - Sahi risk management ke saath, traders TMA Centered Bands indicator ke signals ko sahi tareeqe se follow karke apne trades ko control mein rakh sakte hain. - Stop-loss aur profit targets ko set karke traders apne trades ko manage karte hain aur nuksanat se bachte hain.

                    VI. Conclusion
                    • TMA Centered Bands indicator ek mazboot trend following tool hai jo traders ko market trends ka pata lagane aur trading decisions ke liye sahi entry aur exit points tay karne mein madad karta hai.
                    • Sahi analysis aur risk management ke sath, traders TMA Centered Bands indicator ka istemal karke trading mein kamyabi haasil kar sakte hain.
                    • Har trade ko carefully analyze karen aur indicator ke signals ko samajh kar trading decisions len taake consistent aur disciplined trading kiya ja sake.
                    • #25 Collapse

                      TMA Centered Bands Indicator: Ek Tafseeli Jaiza

                      TMA Centered Bands Indicator ek popular technical analysis tool hai jo Forex aur anya financial markets mein istemal hota hai. Is article mein, hum TMA Centered Bands Indicator ke bare mein tafseelat faraham karenge aur iske istemal ki ahmiyat ko samjheinge.

                      TMA Centered Bands Indicator Kya Hai?

                      TMA Centered Bands Indicator ek volatility-based indicator hai jo market volatility ko measure karne mein madad karta hai. Is indicator mein "Triangular Moving Average" (TMA) ka istemal hota hai jo ke price action ko smooth karne ke liye istemal hota hai.

                      TMA Centered Bands Indicator Ka Kaam

                      TMA Centered Bands Indicator market volatility ko samajhne mein madad karta hai. Is indicator ke through, traders market ki volatility ko analyze kar sakte hain aur price ke potential future movements ko anticipate kar sakte hain.

                      TMA Centered Bands Indicator Ka Istemal

                      TMA Centered Bands Indicator ko istemal karne ke liye, traders ko indicator ko apne trading platform par add karna hota hai. Jab indicator add ho jata hai, to market volatility aur price movements ko measure karne ke liye indicator ki lines display hoti hain.

                      TMA Centered Bands Indicator Ki Khasiyatayn

                      1. Volatility Measurement:
                      Indicator market volatility ko measure karta hai, jisse traders ko market ki movements ka andaza lagane mein madad milti hai.

                      2. Trend Identification: TMA Centered Bands Indicator trend identification mein madad karta hai. Agar price upper band ke qareeb hai to ye bullish trend ki indication hoti hai, jabke agar price lower band ke qareeb hai to ye bearish trend ki indication hoti hai.

                      3. Entry aur Exit Points: Indicator entry aur exit points ke tajziya mein madad karta hai. Traders upper aur lower bands ke darmiyan price action ko dekhte hue apne positions ko enter aur exit kar sakte hain.

                      Ikhtitām

                      TMA Centered Bands Indicator ek mufeed technical analysis tool hai jo traders ko market volatility ko samajhne aur trend identification mein madad karta hai. Is indicator ka istemal sahi tareeqe se kiya jaye to traders apni trading strategies ko behtar bana sakte hain aur market ke mukhtalif pehluon ko samajh sakte hain.
                      • #26 Collapse

                        TMA Centered Bands Indicator.

                        Click image for larger version

Name:	images (36).jpeg
Views:	65
Size:	19.0 کلوبائٹ
ID:	12862426

                        TMA Centered Bands Indicator


                        TMA Markazi Bands Indicator ek technical analysis tool hai jo traders ko market trends aur volatility ka andaza lagane mein madad karta hai. Yeh ek popular trading indicator hai jo market ke momentum aur reversals ko identify karne mein istemal hota hai.

                        Introduction (Tareef)

                        TMA Markazi Bands Indicator, Triple Moving Average Markazi Bands ko darust karne ke liye istemal hota hai. Yeh ek trend-following indicator hai jo market ke movement ko smoothen karta hai aur support aur resistance levels ko dikhata hai.

                        Construction (Tameer)

                        TMA Markazi Bands Indicator ko banane ke liye, pehle teen moving averages (MA) calculate kiye jate hain. Phir in teeno MAs ka average liya jata hai, jo TMA ka markazi line banata hai. Fir upper aur lower bands ko markazi line ke aas pass create kiya jata hai, jo volatility ko dikhata hai.

                        Interpretation (Tashreeh)

                        Agar market TMA Markazi line ke upar hai, to yeh ek uptrend ko indicate karta hai aur traders ko long positions lena suggest karta hai. Jab market TMA Markazi line ke niche hai, to yeh ek downtrend ko darust karta hai aur traders ko short positions lena suggest karta hai.

                        Uses (Estemal)

                        TMA Markazi Bands Indicator ko market trends ko samajhne aur potential entry aur exit points ko identify karne ke liye istemal kiya jata hai. Iske through traders market ke reversals aur breakouts ko bhi detect kar sakte hain.

                        Conclusion (Ikhtitam)

                        TMA Markazi Bands Indicator ek mufeed tool hai jo traders ko market analysis mein madad deta hai. Yeh unhein trend directions aur volatility ke bare mein behtar understanding deta hai, jo unhein informed trading decisions lene mein madad karta hai. Iski sahi samajh aur istemal se traders apne trading strategies ko improve kar sakte hain.


                        • #27 Collapse

                          TMA Centered Bands Indicator.
                          Click image for larger version

Name:	mt5-tma-centered-bands-indicator-600x450.png
Views:	57
Size:	9.7 کلوبائٹ
ID:	12862500


                          TMA Centered Bands Indicator ek technical analysis tool hai jo market volatility ko measure karta hai aur price ke around ek moving average ko plot karta hai. TMA ka matlab hai "Triangular Moving Average" jo ke price ke around volatility ke adhar par calculate kiya jata hai.
                          TMA Centered Bands Indicator ko samajhne ke liye, yeh kuch key points hain :
                          1. Bands ka Calculation: TMA Centered Bands Indicator do outer bands aur ek central band plot karta hai. Outer bands typically price ke standard deviations ke basis par calculate kiye jate hain, jabki central band ek moving average hota hai.
                          2. Market Volatility: TMA Bands market volatility ko measure karte hain. Agar bands wide hain, toh ye indicate karta hai ke market mein zyada volatility hai, jabki narrow bands low volatility ko darust karte hain.
                          3. Trend Identification: TMA Bands ka istemal trend identification mein hota hai. Jab price upper band se cross karta hai, toh ye uptrend ko darust karta hai, jabki jab price lower band se cross karta hai, toh ye downtrend ko darust karta hai.
                          4. Mean Reversion: TMA Bands ka istemal mean reversion strategies mein bhi hota hai. Jab price upper band ya lower band se bahar nikalta hai, toh traders expect karte hain ke price wapas mean ke taraf revert hoga.
                          5. Trading Signals: TMA Bands ke sath-sath traders doosre indicators aur price action ka bhi istemal karte hain trading signals generate karne ke liye. For example, jab price upper band ko cross karta hai aur RSI overbought zone mein hai, toh ye sell signal generate kar sakta hai.
                          TMA Centered Bands Indicator traders ko market volatility, trend direction, aur mean reversion opportunities ke bare mein information provide karta hai. Is indicator ko sahi tareeke se samajh kar, traders apne trading decisions ko improve kar sakte hain aur market movements ko better predict kar sakte hain.


                          • #28 Collapse

                            TMA Triangular Moving Average Centered Bands Indicator trading mein ek technical analysis ka aala hai jo price movements ka jaeza lene aur potential trends ka pata lagane ke liye istemal hota hai. Iska kaam simple moving average SMA par mabni hota hai lekin ek khaas tareeqay se jo ke triangular calculation method ke tehat hota hai. Ye indicator khaaskar Forex traders mein popular hai aur market volatility, trend strength, aur possible reversal points ko analyze karne mein madadgar hai.


                            Understanding Triangular Moving Average
                            TMA Centered Bands Indicator ko samajhne ke liye, Triangular Moving Average ko samajhna zaroori hai. Jabke simple ya exponential moving averages tamam data points ko barabar ke wazan dete hain, TMA haal hi ke prices par zyada wazan dalta hai jabke fluctuations ko smooth karta hai. Iske liye ek triangular calculation method istemal hota hai jo ke mukhtalif qadmon mein hota hai:
                            1. Calculate the Simple Moving Average: Sab se pehle, ek specified period jaise ke 20 periods ke liye, simple moving average (SMA) ka hisaab lagaya jata hai. Ye SMA TMA calculation ka base banata hai.
                            2. Calculate the SMA of the SMA: Agla kadam ye hai ke pehle wale SMA par doosra SMA lagaya jata hai. Ye doosra SMA data ko mazeed smooth karta hai.
                            3. Center the SMA of the SMA: Centered SMA ko hasil karne ke liye, pehle wale SMA ka SMA ko aadha period aage shift kiya jata hai. Misal ke tor par, agar period 20 hai, to centered SMA ko 10 periods aage shift kiya jata hai.
                            4. Final TMA Calculation: Aakhir mein, centered SMA ko centered SMA se subtract kar ke final TMA hasil hota hai. Ye process ek TMA line ko banata hai jo ke zyada taizi se haal hi ke price changes ka reaction deta hai jabke noise aur false signals ko kam karta hai.

                            Components of TMA Centered Bands Indicator
                            TMA Centered Bands Indicator aam tor par teen mukhya components par mushtamil hota hai:
                            1. TMA Line: Ye mukhya line hai jo ke Triangular Moving Average ko represent karti hai. Aam tor par, isko price chart par solid line ke tor par plot kiya jata hai.
                            2. Upper Band: Upper band TMA line se ek muqarrar standard deviations ko add kar ke hasil hota hai. Ye band resistance level ka kaam karta hai aur TMA line ke upar plot kiya jata hai.
                            3. Lower Band: Isi tarah, lower band TMA line se ek muqarrar standard deviations ko subtract kar ke hasil hota hai. Ye support level ka kaam karta hai aur TMA line ke neeche plot kiya jata hai.
                            Interpreting the TMA Centered Bands
                            Traders TMA Centered Bands Indicator ko mukhtalif tareeqon se istemal karte hain market conditions ka andaza lagane aur trading decisions ko mazeed behtar banana ke liye:
                            1. Trend Identification: Jab price TMA line ke oopar rehti hai aur bands wide ho rahe hain, to ye uptrend ko indicate karta hai. Ulta, jab price TMA line ke neeche rehti hai aur bands wide ho rahe hain, to ye downtrend ko indicate karta hai. Narrowing bands potential reversal ya consolidation phase ko darust kar sakti hain.
                            2. Volatility Assessment: Bands ki width market volatility ko reflect karti hai. Wide bands zyada volatility ko darust karti hain, jabke narrow bands kam volatility ko indicate karti hain. Traders aksar volatility levels ke basis par apne strategies ko adjust karte hain.
                            3. Overbought aur Oversold Conditions: Bollinger Bands ke tarah, TMA bands ko bhi overbought aur oversold conditions ka pata lagaya ja sakta hai. Jab price upper band ko touch karta hai ya exceed karta hai, to ye overbought conditions aur potential reversal ko indicate kar sakta hai. Ulta, lower band ko touch karna ya cross karna oversold conditions ko darust kar sakta hai.
                            4. Divergence Analysis: Price movements aur TMA line ya bands ke darmiyan ka farq potential trend reversals ya continuation patterns ko signal kar sakta hai. Misal ke tor par, agar price higher high banata hai jabke TMA line lower high banata hai, to ye weakening bullish momentum ko indicate kar sakta hai.
                            Practical Application in Trading Strategies
                            Traders TMA Centered Bands Indicator ko mukhtalif trading strategies mein shamil karte hain apne decision-making process ko behtar banane ke liye:
                            1. Trend Following: Trending markets mein, traders jab price TMA line ke oopar rehti hai aur bands widen ho rahe hain, to ye strong uptrend ko indicate karta hai. Ulta, jab price TMA line ke neeche rehti hai aur bands wide ho rahe hain, to ye strong downtrend ko indicate karta hai.
                            2. Reversal Trading: Jab price upper band ko touch karta hai ya exceed karta hai uptrend mein ya lower band ko breach karta hai downtrend mein, to traders reversal signals ko dekhte hain jaise bearish ya bullish candlestick patterns, oscillators ke divergence, ya doosre confirmation signals ke pehle counter-trend trades mein dakhil ho sakte hain.
                            3. Volatility-Based Strategies: Traders jo volatility par focus karte hain wo apne position sizes ko adjust karte hain ya volatility-based stop-loss aur take-profit levels istemal karte hain TMA bands ki width ke basis par. Wide bands zyada stop-loss orders ko accommodate karne ke liye istemal hoti hain.
                            4. Combination with Other Indicators: TMA Centered Bands Indicator aksar doosre technical indicators jaise ke Relative Strength Index (RSI), Moving Average Convergence Divergence (MACD), ya Fibonacci retracement levels ke saath istemal hota hai signals ko validate karne aur trading accuracy ko improve karne ke liye.
                            TMA Centered Bands Indicator trading mein ek powerful tool hai jo trends, volatility, aur potential reversals ko samajhne mein madad deta hai. Traders iske components aur interpretations ko istemal karke robust trading strategies develop kar sakte hain jo mukhtalif market conditions ke liye suitable hote hain. Triangular Moving Average ka calculation aur uske TMA bands par kya asar hota hai samajh kar, traders informed decisions le sakte hain aur apne trading endeavors mein risk ko effectively manage kar sakte hain.
                            Believe in yourself and your abilities. When you fight for your dreams, you can achieve anything.
                            • #29 Collapse

                              Introduction:

                              Forex trading mein, indicators istemal hotay hain taake traders ko market ka trend aur volatility ka andaza ho sake. Triangular Moving Average Centered Bands Indicator bhi aik aham tool hai jo traders ko market ke direction aur range ka pata lagane mein madad karta hai.

                              Triangular Moving Average (TMA):

                              Triangular Moving Average, ya TMA, ek technical analysis indicator hai jo trend ko analyze karne ke liye istemal hota hai. Ismein moving averages ka combination hota hai, jismein current aur past prices ko consider kiya jata hai. TMA ka formula traditional moving averages se thoda mukhtalif hota hai, jo ki price ke movement ko smooth karne mein madad karta hai.
                              Click image for larger version

Name:	MAtriangularES.gif
Views:	28
Size:	19.7 کلوبائٹ
ID:	12919797
                              Centered Bands:

                              Centered Bands TMA ke around hotay hain aur ye market ke current volatility ko represent karte hain. Ye bands TMA ke around symmetrically placed hote hain, jo price ke upper aur lower levels ko define karte hain. Ye bands traders ko volatility aur price range ka idea dete hain.Centered Bands TMA ke do symmetric bands hote hain jo average ke dono taraf hote hain. Ye bands volatility ko measure karte hain aur price ka trend direction indicate karte hain.
                              Click image for larger version

Name:	mt5-tma-centered-bands-indicator-600x450.png
Views:	28
Size:	9.7 کلوبائٹ
ID:	12919798
                              Indicator Interpretation:

                              TMA-CB indicator ko interpret karne ke liye, traders average ke around price ke fluctuations ko dekhte hain. Bands ke divergence aur convergence price ke volatility aur trend direction ke signals provide karte hain.

                              Indicator Uses:

                              Forex trading mein Triangular Moving Average Centered Bands Indicator ka istemal price ke movement ko analyze karne aur trading decisions banane ke liye hota hai. Jab bands narrow hotay hain, ye indicate karta hai ke market mein volatility kam hai aur price range tight hai. Jab bands wide hote hain, to ye indicate karta hai ke market mein zyada volatility hai aur price range broad hai.
                              Click image for larger version

Name:	640px-TMA.png
Views:	29
Size:	128.0 کلوبائٹ
ID:	12919799
                              Trading Strategy:

                              Agar price upper band ko cross karta hai, traders buy karte hain aur agar price lower band ko cross karta hai, traders sell karte hain. Is indicator ko istemal karke traders market ki direction ko samajhte hain aur sahi waqt par trade karte hain. Jab price upper band ko cross karta hai, yeh ek bullish signal hota hai aur jab price lower band ko cross karta hai, yeh ek bearish signal hota hai.
                              Click image for larger version

Name:	Triangular-Moving-Average-Forex-Trading-Strategy.png
Views:	22
Size:	30.5 کلوبائٹ
ID:	12919800
                              Conclusion:

                              Triangular Moving Average Centered Bands Indicator forex traders ke liye aik useful tool hai jo market ke trend aur volatility ko samajhne mein madad karta hai. Iska istemal karke traders better trading decisions le sakte hain aur market ke movements ko samajh sakte hain.

                              • <a href="https://www.instaforex.org/ru/?x=ruforum">InstaForex</a>
                              • #30 Collapse

                                Forex Market Mein Triangular Moving Average (TMA){}{}{}{}

                                Forex market mein Triangular Moving Average (TMA) ek prakar ka technical indicator hai jo price trends ko analyze karne mein madad karta hai. Yeh indicator, ek average ki tarah kaam karta hai, jismein past ki kuchh specific periods ke closing prices ka average calculate kiya jata hai.

                                Triangular Moving Average, simple moving average (SMA) aur exponential moving average (EMA) ke beech ek madhyam sthiti hai. Ismein, SMA aur EMA dono ka mix hota hai. TMA mein har data point ka importance gradually badhta hai, jaise ki EMA mein hota hai, lekin TMA mein past data ka weightage symmetrically barhta hai, jaise ki SMA mein hota hai. Iska result ek curve hota hai jo price ke fluctuations ko smoothen kar deta hai aur trends ko saaf dikhata hai.


                                Forex Market Mein Triangular Moving Average (TMA) Ke Ehem Nukaat{}{}{}{}

                                traders kuch important points ka dhyan rakhte hain:
                                1. Trend Identification: TMA ki madad se traders trend direction ko samajh sakte hain. Agar TMA ka curve upar ki taraf jaa raha hai, to yeh uptrend ko indicate karta hai, jabki agar curve niche ki taraf jaa raha hai, to yeh downtrend ko indicate karta hai.
                                2. Entry aur Exit Points: TMA ko entry aur exit points ke taur par istemal kiya jata hai. Jab TMA ki line price ke neeche se upar chali jaati hai, to yeh ek buy signal ho sakta hai, aur jab yeh line price ke upar se neeche girti hai, to yeh ek sell signal ho sakta hai.
                                3. Trend Strength: TMA ki slope ki madad se traders trend ki strength ka anuman laga sakte hain. Agar TMA ki slope teji se badh rahi hai, to trend strong hai, aur agar slope dheere dheere ghat rahi hai, to trend weak ho sakta hai.
                                4. Support aur Resistance Levels: TMA ka istemal karke traders support aur resistance levels ko bhi identify kar sakte hain. Jab price TMA ko cross karta hai, to yeh ek potential support ya resistance level ban sakta hai.

                                Overall, TMA ek powerful tool hai jo traders ko price movements ko analyze karne mein madad karta hai aur unhe trading decisions lene mein support deta hai. Lekin, jaise har technical indicator ke saath hota hai, TMA ka bhi istemal samajhdari se aur dusre confirmatory indicators ke saath karna zaroori hai.

                                اب آن لائن

                                Working...
                                X