This time we will discuss a wide range of basic tools related to mathematical analysis.
In the context of forex trading, mathematical analysis involves a variety of methods and techniques in a trader’s arsenal aimed at forecasting future price movements in the financial market.
Most of these methods imply the use of various technical indicators. In other words, this type of analysis is called mathematical because every single technical indicator is based upon strict mathematical calculations.
Today, there is an enormous variety of graphical indicators allowing a trader to predict the direction and strength of market trends. The most common and frequently used mathematical indicators include moving averages and stochastic oscillators.
For a comprehensive study of mathematical analysis as applied to the forex market, one should consider both sides of the subject.
On the one side, mathematical analysis on Forex contains many elements of technical analysis referred to as so-called expert advisors (i.e. automated software used in a trading platform). This is why mathematical analysis forms the cornerstone of numerous trading strategies, being an indispensable part of expert advisors. For example, such well-known strategies as the Martingale betting system, the Puria method, the identification of supply and demand zones in the market are all based on the laws of mathematics.
On the other side, computer data processing is considered to be another important aspect of mathematical analysis. Computing technologies along with the probability theory and statistical data provide the basis for developing cutting-edge trading solutions that have become widespread in the financial world over the recent years. Among computer-based technical indicators are moving averages, Bollinger Bands, stochastic oscillators etc.
Generally speaking, market analysis based on such an exact science as mathematics is an integral component of rational capital management and efficient risk control.
Before we take a closer look at trading indicators, let us introduce the notion of divergence. The divergence is rightfully considered to be the strongest signal in technical analysis. It occurs when the actual price movement and a technical indicator are heading in opposite directions.
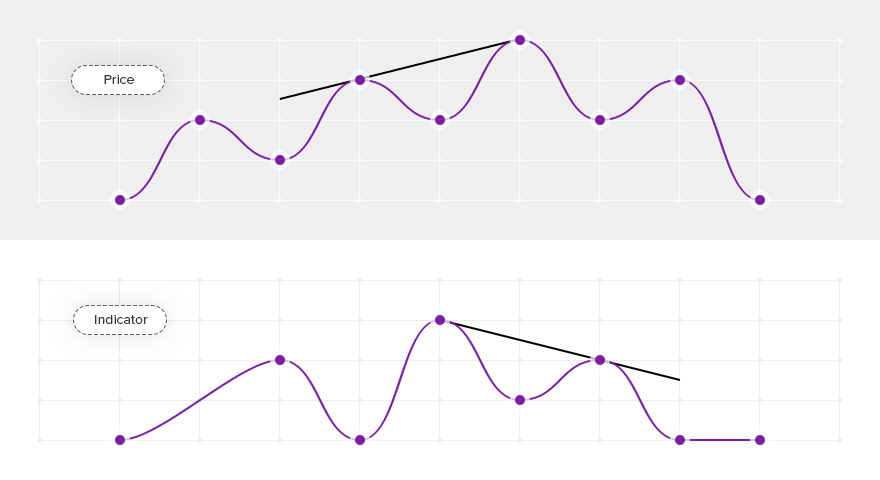
A bearish divergence takes place when prices are on the rise, approaching a new high, but the indicator stops at a lower level. Bearish divergences between prices and indicators point to some weakness at the top of the market and signal a higher probability of an upcoming trend reversal.

Bearish divergence
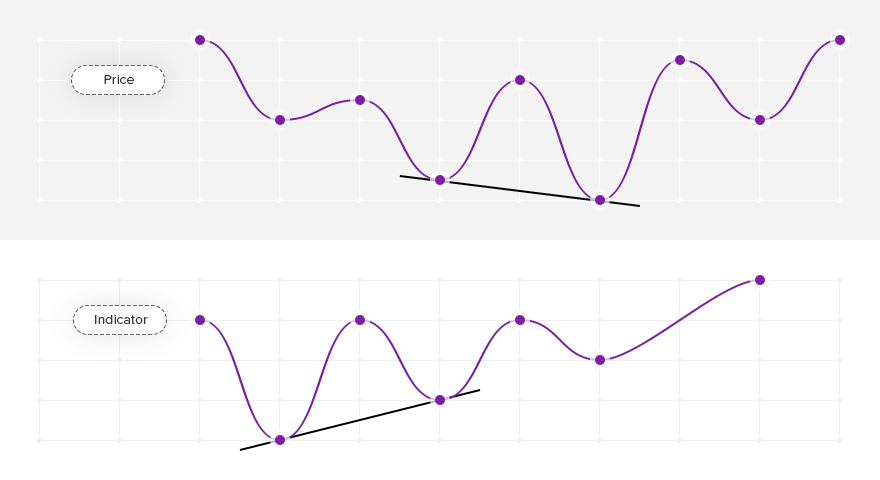
Conversely, if prices are moving towards a new low while the indicator ticks higher, we observe a bullish divergence on the chart.
A bullish divergence between the price and a technical indicator is a clear sign indicating weakness in the trend and a potential shift to the upside.

Bullish divergence
All technical indicators can be roughly divided into two large groups: trend-following indicators and stochastic oscillators.
Before we proceed to specific types of trend-following indicators, let us make sure that you fully understand what a trend is. The traditional definition states that a market trend is a sustainable price movement in a certain direction.
There are three types of trends: bullish (uptrend – prices are rising), bearish (downtrend – prices are falling), and sideways (horizontal – prices are stuck in a narrow trading range, hovering up and down with no clear direction). Therefore, trend-following indicators are designed to determine the current market trend and predict changes in the direction of price movement. As a rule, trend-following indicators are highly accurate in locating the point where a trend starts, ends, or reverses. Nowadays, hardly any trader in the currency market can do without these helpful technical tools. In fact, most market participants commonly use more than one trading indicator, seeking to achieve higher accuracy.
Trend-following indicators start identifying a trend after they have been added to the price chart.
Remember that the process usually involves a certain time lag. Still, using this type of indicators makes it possible to avoid common errors and false signals that can undermine a trader’s success.
At present there exists a tremendous amount of trading indicators designed specifically for the currency market. Many of them are already available in most trading platforms, which means that these tools enjoy the greatest popularity among market participants. However, there are also some indicators that are not that widely recognized and are only used by traders who are well familiar with their functions and operating principles. Some traders also create their own unique expert advisors to suit their personal needs and trading style. Such customized indicators sometimes gain popularity on a wider scale and become widespread.
To achieve efficient and profitable trading based on trend-following indicators, a trader does not necessarily have to test as many technical systems as possible. The use of two or three expert advisors combined with sufficient knowledge and trading skills would be enough to bring positive results.
In the context of forex trading, mathematical analysis involves a variety of methods and techniques in a trader’s arsenal aimed at forecasting future price movements in the financial market.
Most of these methods imply the use of various technical indicators. In other words, this type of analysis is called mathematical because every single technical indicator is based upon strict mathematical calculations.
Today, there is an enormous variety of graphical indicators allowing a trader to predict the direction and strength of market trends. The most common and frequently used mathematical indicators include moving averages and stochastic oscillators.
For a comprehensive study of mathematical analysis as applied to the forex market, one should consider both sides of the subject.
On the one side, mathematical analysis on Forex contains many elements of technical analysis referred to as so-called expert advisors (i.e. automated software used in a trading platform). This is why mathematical analysis forms the cornerstone of numerous trading strategies, being an indispensable part of expert advisors. For example, such well-known strategies as the Martingale betting system, the Puria method, the identification of supply and demand zones in the market are all based on the laws of mathematics.
On the other side, computer data processing is considered to be another important aspect of mathematical analysis. Computing technologies along with the probability theory and statistical data provide the basis for developing cutting-edge trading solutions that have become widespread in the financial world over the recent years. Among computer-based technical indicators are moving averages, Bollinger Bands, stochastic oscillators etc.
Generally speaking, market analysis based on such an exact science as mathematics is an integral component of rational capital management and efficient risk control.
Before we take a closer look at trading indicators, let us introduce the notion of divergence. The divergence is rightfully considered to be the strongest signal in technical analysis. It occurs when the actual price movement and a technical indicator are heading in opposite directions.
A bearish divergence takes place when prices are on the rise, approaching a new high, but the indicator stops at a lower level. Bearish divergences between prices and indicators point to some weakness at the top of the market and signal a higher probability of an upcoming trend reversal.

Bearish divergence
Conversely, if prices are moving towards a new low while the indicator ticks higher, we observe a bullish divergence on the chart.
A bullish divergence between the price and a technical indicator is a clear sign indicating weakness in the trend and a potential shift to the upside.

Bullish divergence
All technical indicators can be roughly divided into two large groups: trend-following indicators and stochastic oscillators.
Before we proceed to specific types of trend-following indicators, let us make sure that you fully understand what a trend is. The traditional definition states that a market trend is a sustainable price movement in a certain direction.
There are three types of trends: bullish (uptrend – prices are rising), bearish (downtrend – prices are falling), and sideways (horizontal – prices are stuck in a narrow trading range, hovering up and down with no clear direction). Therefore, trend-following indicators are designed to determine the current market trend and predict changes in the direction of price movement. As a rule, trend-following indicators are highly accurate in locating the point where a trend starts, ends, or reverses. Nowadays, hardly any trader in the currency market can do without these helpful technical tools. In fact, most market participants commonly use more than one trading indicator, seeking to achieve higher accuracy.
Trend-following indicators start identifying a trend after they have been added to the price chart.
Remember that the process usually involves a certain time lag. Still, using this type of indicators makes it possible to avoid common errors and false signals that can undermine a trader’s success.
At present there exists a tremendous amount of trading indicators designed specifically for the currency market. Many of them are already available in most trading platforms, which means that these tools enjoy the greatest popularity among market participants. However, there are also some indicators that are not that widely recognized and are only used by traders who are well familiar with their functions and operating principles. Some traders also create their own unique expert advisors to suit their personal needs and trading style. Such customized indicators sometimes gain popularity on a wider scale and become widespread.
To achieve efficient and profitable trading based on trend-following indicators, a trader does not necessarily have to test as many technical systems as possible. The use of two or three expert advisors combined with sufficient knowledge and trading skills would be enough to bring positive results.

تبصرہ
Расширенный режим Обычный режим