What is parallel channel pattern
X
  • وقت
  • دکھائیں
Clear All
new posts
  • #16 Collapse


    What is parallel channel pattern

    Click image for larger version

Name:	download (74).png
Views:	25
Size:	7.8 کلوبائٹ
ID:	12849514


    Parallel channel pattern ek technical analysis concept hai jo market charts par paya jata hai. Ye pattern market mein price movement ko represent karta hai jab ek uptrend ya downtrend ke doran prices ek parallel range mein move karte hain. Yeh channel do parallel trend lines ke darmiyan banta hai, jinhe traders chart analysis mein istemal karte hain.

    Parallel Channel Pattern tafseel say:
    1. Formation:
      • Jab market mein strong trend hota hai, upar ya neeche ki taraf, to parallel channel pattern ban sakta hai. Uptrend mein, higher highs aur higher lows banate hain, jabke downtrend mein lower highs aur lower lows banate hain.
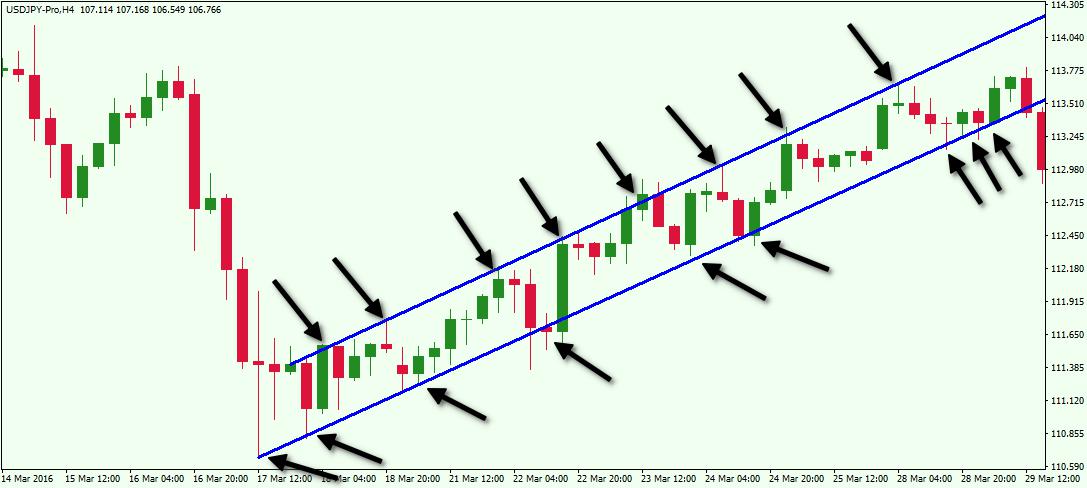
    2. Trend Lines:
      • Parallel channel pattern mein do trend lines hote hain. Uptrend mein, ek line highs ko connect karegi, aur doosri line lows ko connect karegi. Downtrend mein, ek line lows ko connect karegi, aur doosri line highs ko connect karegi.
    3. Trading Range:
      • Prices do trend lines ke darmiyan move karte hain, aur yeh range traders ke liye trading opportunities provide karta hai. Traders is range mein long ya short positions le sakte hain.
    4. Breakouts:
      • Jab prices trend lines ke bahar jaate hain, toh ye breakout kehlata hai. Breakout uptrend mein jab prices upper trend line ko cross karte hain aur downtrend mein jab prices lower trend line ko cross karte hain. Breakouts, traders ko future price movement ke liye signals provide karte hain.
    5. Volume Confirmation:
      • Jab channel pattern mein breakout hota hai, toh traders ko volume ke sath confirm karna zaroori hai. Agar breakout high volume ke sath hota hai, toh ye uski authenticity ko barhata hai.
    6. Target Calculation:
      • Traders channel width ka istemal karke target levels tay kar sakte hain. Uptrend mein, target upper side mein hota hai, jabke downtrend mein, target lower side mein hota hai.

    Parallel channel pattern ek versatile tool hai jo traders ko market trends aur potential reversals ke bare mein malumat dene mein madad karta hai. Lekin, jaise har technical analysis tool ki tarah, isko bhi dusre indicators aur confirmations ke sath istemal karna zaroori hai.


    • <a href="https://www.instaforex.org/ru/?x=ruforum">InstaForex</a>
    • #17 Collapse

      What is parallel channel pattern


      Parallel-channel-example-3.webp


      "Parallel Channel Pattern" forex trading mein ek common technical analysis pattern hai jo market mein price ke movement ko represent karta hai. Ye pattern typically price chart par parallel lines ke saath banata hai, jismein price ka movement ek defined range ke andar hota hai.
      Parallel Channel Pattern ka formation do parallel lines se hota hai jo price ke movement ko encapsulate karte hain. Ye lines typically price ke highs aur lows ko connect karte hain, jisse ek channel ban jata hai.

      Parallel Channel Pattern ka appearance market mein price ke movement ke direction aur volatility ko represent karta hai. Agar price ek uptrend mein hai, toh channel ke upper line ko connect kiya jata hai jo price ke higher highs ko represent karta hai, aur lower line ko connect kiya jata hai jo price ke higher lows ko represent karta hai. Agar price ek downtrend mein hai, toh channel ke upper line ko connect kiya jata hai jo price ke lower highs ko represent karta hai, aur lower line ko connect kiya jata hai jo price ke lower lows ko represent karta hai.

      Parallel Channel Pattern ko recognize karne ke liye, traders ko price ke movement ko closely observe karna hota hai aur channel ke upper aur lower lines ko draw karna hota hai jo price ke movement ko encapsulate karte hain.

      Traders typically Parallel Channel Pattern ka istemal price ke future movement ko predict karne ke liye karte hain. Agar price channel ke andar movement karta hai aur upper ya lower line ko touch karta hai, toh ye indicate karta hai ke price ka movement channel ke andar hi reh sakta hai. Lekin agar price channel ke bahar break karta hai, toh ye indicate karta hai ke trend reversal ya extended move ho sakta hai.

      Parallel Channel Pattern ka istemal traders price ke potential reversal points ya trend ke continuation points ko identify karne ke liye karte hain. Is pattern ke appearance ke saath saath, traders ko market conditions aur additional technical indicators ka bhi analysis karna chahiye. Ye pattern sirf ek indicator hai aur iski accuracy aur reliability ko confirm karne ke liye additional research aur analysis ki zarurat hoti hai.
      • #18 Collapse

        Mawazii Channel Pattern: Analysis aur Istemaal

        Click image for larger version

Name:	download (1).jpeg
Views:	27
Size:	10.8 کلوبائٹ
ID:	12849651

        1. Taaruf:


        1.1 Mawazii Channel ki Taaruf: Mawazii Channel Pattern ek technical analysis ka hissa hai jo market charts ki tajziye mein istemal hota hai. Yeh pattern ek khaas qisam ke trend ko darust karnay mein madad karta hai.

        1.2 Mawazii Channel ki Khasoosiyat: Mawazii Channel ka pattern ek mojooda trend mein maqami mawazan aur moj ki simt ka pata lagane ke liye istemal hota hai. Yeh do mawazii lineon ki shakal mein zahir hota hai jo ke market ki harek ko samajhnay mein madad deti hain.
        2. Mawazii Channel ki Shaklein:


        2.1 Channel ka Shuruaat: Mawazii Channel Pattern ki shuruaat mein, do mawazii linein chart par shakal banati hain jo mojooda trend ko dobara bata rahi hoti hain.

        2.2 Banawati Khatoot: Mawazii Channel ki banawat mein, aik line trend ki upper had ko zahir karti hai jabke dosri line trend ki lower had ko zahir karti hai. In dono lineon ka faasla ahem hota hai.
        3. Mawazii Channel ka Ahmiyat:


        3.1 Trend ki Shanaakht: Mawazii Channel ki madad se trend ko saaf dekha ja sakta hai, jo traders ko market ki harkat ko samajhnay mein madad karta hai.

        3.2 Support aur Resistance: Mawazii Channel ki linein support aur resistance ka ahem kirdar ada karti hain, jo traders ko market ke mukhtalif muqamat par ahem hudood ka ilm deti hain.
        4. Mawazii Channel ka Istemaal:


        4.1 Trend Trading: Mawazii Channel ka istemaal trend trading mein aam hai, jahan traders upper aur lower bounds ki madad se trend ko pehchan kar trading karte hain.

        4.2 Channel ki Maqami Istemaal: Mawazii Channel ki maqami istemaal, jese ke breakout ki talash ya trend ki tabdili ki shanaakht, traders ko alag alag tajaweezat ke liye iska istemaal karne ka mawqa deti hai.
        5. Mawazii Channel ke Fawaid aur Nuksanat:


        5.1 Fawaid:
        • Trend ki Seedhi Shanaakht: Mawazii Channel ka istemaal seedhi trend ki pehchan mein madad karta hai.
        • Support aur Resistance ki Malumat: Linein support aur resistance ka pata lagane mein madad karti hain.
        • Market mein Trading ke liye Madadgar: Mawazii Channel traders ko market mein trading ke liye madadgar malumat farahem karta hai.

        5.2 Nuksanat:
        • Mukhtalif Market Shara'it mein Kami: Mawazii Channel ke faaslay mukhtalif market shara'it mein kamzor hosakte hain.

        6. Mawazii Channel ka Istemaal:


        6.1 Chart Analysis aur Trading Strategies: Mawazii Channel ka istemaal chart analysis aur trading strategies mein ahem kirdar ada karta hai. Traders ko market ki tajziye mein aur behtar faislay karne mein madad karta hai.

        6.2 Mawazii Channel aur Trading Psychology: Mawazii Channel ka istemaal karte waqt trading psychology ka khyal rakhna bhi zaroori hai. Traders ko apne emotions ko control mein rakh kar decisions lena chahiye.
        7. Ikhtitami Raaye:


        Mawazii Channel Pattern ek taqatwar tool hai jo market trends ko samajhnay aur trading strategies tay karnay mein madad deta hai. Lekin, jaise ke har trading tool ka case hai, iska istemaal samajhdari aur taawun ke saath karna chahiye. Traders ko market conditions ka bhi khayal rakhna zaroori hai taki woh sahi tajziya kar sakein aur market mein kamiyabi hasil kar sakein.
        What is parallel channel pattern
        • #19 Collapse

          parallel channel pattern
          Parallel channel pattern ek technical analysis concept hai jo ki price movement ke patterns ko identify karne mein istemal hota hai. Ye pattern typically price action mein dekha jata hai jab market mein ek trend ke dauran price ek specific range ke andar move karta hai.

          Identification
          Parallel channel pattern ko identify karne ke liye, traders ko do parallel trend lines draw karni hoti hain jo price ke highs aur lows ko connect karte hain. Upper trend line ko resistance line ke roop mein dekha jata hai, jabki lower trend line ko support line ke roop mein dekha jata hai. Jab price ek consistent trend ke andar move karta hai aur in dono trend lines ke beech mein rahta hai, toh ye parallel channel pattern ko represent karta hai.


          Yahan kuch key points hain jo parallel channel pattern ke analysis mein madad karte hain:
          1. Trend Identification: Parallel channel pattern typically ek existing trend ke dauran develop hota hai, chahe wo uptrend ho ya downtrend. Traders ko trend ke direction ko identify karna important hota hai takay wo sahi tarah se trend lines ko draw kar sakein.
          2. Price Bounces: Price usually bounces between the support aur resistance lines of the parallel channel pattern. Jab price support line ko touch karta hai, toh yeh ek buying opportunity ban sakta hai, jabki jab price resistance line ko touch karta hai, toh yeh ek selling opportunity ban sakta hai.
          3. Breakout: Breakout ek important aspect hai parallel channel pattern ke analysis mein. Agar price ek channel ke bahar move karta hai, toh ye ek potential trend reversal ya trend continuation ko indicate kar sakta hai. Traders ko breakout ke signals ko confirm karne ke liye doosre technical indicators ka bhi istemal karna chahiye.
          4. Volume Analysis: Volume ek important factor hai parallel channel pattern ke analysis mein. Agar price ek channel ke andar move karta hai, toh volume typically normal hota hai. Lekin breakout ke time par, volume increase ho sakta hai, indicating ki market mein strong momentum hai.Overall, parallel channel pattern ek powerful tool hai price action analysis mein jo ki traders ko trend ke direction aur potential trading opportunities ko identify karne mein madad karta hai. Iske alawa, sahi tarah se risk management aur confirmatory signals ka istemal karna bhi zaroori hai trading decisions ke liye.


          • #20 Collapse

            What is parallel channel pattern

            Click image for larger version

Name:	k.png
Views:	23
Size:	123.7 کلوبائٹ
ID:	12849846


            Parallel Channel Pattern
            ek technical analysis tool hai jo traders ko market trends aur price movements ka andaza lagane mein madad karta hai. Yeh pattern market mein ek range ya trend ko identify karne mein istemal hota hai, aur traders ko entry aur exit points tajaweez karta hai.


            Parallel Channel Pattern Kya Hai?

            Parallel Channel Pattern ek price chart pattern hai jo market mein ek makhsoos range mein price movement ko darust karta hai. Is pattern mein do parallel trendlines hote hain, jinhe high aur low points ko jor kar banaya jata hai. Yeh trendlines market mein ek makhsoos range ya trend ko define karte hain, jise traders istemal karke future price movements ka andaza lagate hain.


            Parallel Channel Pattern Ki Pechan
            1. Parallel Trendlines: Is pattern ki pehli pehchan do parallel trendlines hain, jo ke market ke price movements ko define karte hain. High points ko jorna ek trendline aur low points ko jorna doosri trendline banati hai.
            2. Consistent Price Movement: Parallel Channel Pattern mein price consistently trendlines ke darmiyan move karta hai. Yani ke jab bhi price trendlines se bahar nikalta hai, toh woh jald hi wapas in trendlines ke darmiyan wapas aata hai.

            Parallel Channel Pattern Ka Istemal
            1. Trend Identification: Parallel Channel Pattern ka istemal market mein trend ko pehchanne mein hota hai. Agar price consistently trendlines ke darmiyan move kar raha hai, toh yeh ek trend ko darust karta hai.
            2. Entry aur Exit Points: Traders Parallel Channel Pattern ka istemal karke entry aur exit points tajaweez kar sakte hain. Jab price trendlines ke kareeb hota hai, woh ek potential entry point ban sakta hai. Jab price trendlines ko cross karta hai, woh ek potential exit point ban sakta hai.

            Akhri Khyal

            Parallel Channel Pattern ek asaan lekin mufeed technical analysis tool hai jo market trends ko identify karne aur trading strategies banane mein madad karta hai. Is pattern ki sahi samajh aur istemal se traders apne trades ko behtar taur par plan kar sakte hain. Hamesha yaad rakhein ke market mein risk hota hai, is liye risk management ka bhi khaas khayal rakha jana chahiye jab is pattern ka istemal kiya jata hai.
            • #21 Collapse


              Parallel Channel Pattern: Ek Ahem Price Action Pattern

              Parallel Channel pattern forex trading mein ek ahem price action pattern hai jo market ke price movements ko samajhne aur trading decisions banane mein madad deta hai. Yeh pattern market mein trend ya range ke doran dekha jata hai aur traders iska istemal trend ke continuation ya reversal ke liye karte hain. Yeh pattern do parallel lines ke darmiyan price ka movement dikhata hai.
              Click image for larger version

Name:	aaa.PNG
Views:	19
Size:	70.5 کلوبائٹ
ID:	12850079
              Parallel Channel Pattern Ki Tafseelat:

              1. Upper Line (Uper Ki Rekha): Uper ki rekha ya line parallel channel ke upar ke resistance level ko darust karti hai. Jab price is line se barhti hai, to yeh indicate karta hai ke market mein selling pressure hai aur price ka neeche jaana mumkin hai.

              2. Lower Line (Neeche Ki Rekha): Neeche ki rekha ya line parallel channel ke neeche ke support level ko darust karti hai. Jab price is line se girti hai, to yeh indicate karta hai ke market mein buying pressure hai aur price ka upar jaana mumkin hai.

              Parallel Channel Pattern Ko Samajhne Ka Tareeqa:
              1. Channel Ki Formation Dekhiye: Pehle traders ko market mein channel ki formation ko dekhna hai. Yeh formation do parallel lines ke darmiyan price ka movement ko dikhata hai.
              2. Price Action Analyze Karein: Price action ko analyze karke dekhiye ke price upper aur lower lines ke darmiyan kaisa behave kar raha hai. Agar price upper line se bounce kar raha hai, to yeh bearish signal ho sakta hai, jabke agar price lower line se bounce kar raha hai, to yeh bullish signal ho sakta hai.
              3. Volume Ka Tajziya: Volume ko bhi analyze karein. Agar price upper line ya lower line se bounce karta hai aur uss waqt volume bhi badh raha hai, to yeh signal ko confirm karta hai.

              Parallel Channel Pattern Ka Istemal:

              Parallel Channel pattern ko samajh kar traders market ke price movements ko predict karte hain aur trading decisions lete hain. Agar price upper line se bounce kar raha hai, to traders sell positions lete hain aur agar price lower line se bounce kar raha hai, to traders buy positions lete hain.


              Parallel Channel pattern market ke trend ya range ke doran dekha jata hai aur traders ko price movements ka forecast karne mein madad deta hai. Zaroori hai ke traders is pattern ko aur doosre technical indicators ko combine karke istemal karein taake sahi trading decisions le sakein aur market mein kamiyabi hasil kar sakein.

              • #22 Collapse

                Forex trading mein technical analysis ka aik bohot ahem hissa price patterns ko identify karna hota hai. In patterns mein se aik bohot ahem aur commonly used pattern Parallel Channel Pattern hai. Yeh pattern traders ko market trends ko samajhne aur profitable trading opportunities ko identify karne mein madad karta hai. Parallel channel pattern aik price pattern hai jo do parallel trend lines ke beech price movement ko depict karta hai. Yeh pattern tab banta hai jab price continuous higher highs aur higher lows (uptrend) ya lower highs aur lower lows (downtrend) banata hai aur yeh trend lines price ke movement ko contain karte hain. Parallel channel pattern ko do main types mein divide kiya jata hai: ascending (upward) channel aur descending (downward) channel.


                Types of Parallel Channel Pattern

                1. Ascending (Upward) Channel
                Ascending channel tab banta hai jab price ek uptrend mein hoti hai. Is pattern mein do parallel trend lines hoti hain: ek upper trend line jo higher highs ko connect karti hai aur ek lower trend line jo higher lows ko connect karti hai. Yeh channel tab tak valid hota hai jab tak price in dono trend lines ke beech move karti rehti hai.

                2. Descending (Downward) Channel
                Descending channel tab banta hai jab price ek downtrend mein hoti hai. Is pattern mein bhi do parallel trend lines hoti hain: ek upper trend line jo lower highs ko connect karti hai aur ek lower trend line jo lower lows ko connect karti hai. Yeh channel tab tak valid hota hai jab tak price in dono trend lines ke beech move karti rehti hai.

                Parallel Channel Pattern Ki Pehchaan
                Parallel channel pattern ko pehchaanne ke liye aapko price action aur trend lines ko closely monitor karna hoga. Aaye kuch steps discuss karte hain jo parallel channel pattern ko identify karne mein madadgar hain:
                1. Identify the Trend: Sabse pehle aapko current market trend ko identify karna hoga. Agar market uptrend mein hai to aap ascending channel ko dekhne ke liye tayar ho sakte hain aur agar market downtrend mein hai to descending channel ko dekhne ke liye.
                2. Draw Trend Lines: Market trend ko identify karne ke baad, aapko do parallel trend lines draw karni hongi. Uptrend ke case mein, upper trend line higher highs ko connect karegi aur lower trend line higher lows ko connect karegi. Downtrend ke case mein, upper trend line lower highs ko connect karegi aur lower trend line lower lows ko connect karegi.
                3. Validate the Channel: Trend lines draw karne ke baad, aapko dekhna hoga ke price consistently in dono trend lines ke beech move kar rahi hai. Agar price in trend lines ke beech move karti hai to channel valid hai.
                Parallel Channel Pattern Ki Trading Strategies
                Parallel channel pattern ko use kar ke profitable trading opportunities ko identify kiya ja sakta hai. Aaye kuch effective trading strategies ko discuss karte hain:

                1. Trading the Ascending Channel
                Ascending channel ko trade karne ke liye kuch steps hain:
                1. Buy at the Lower Trend Line: Jab price lower trend line ko touch kare aur wahan se bounce back kare, to yeh buying opportunity ho sakti hai. Yeh level support kehlata hai aur yahan se price ke upar jane ke chances zyada hote hain.
                2. Sell at the Upper Trend Line: Jab price upper trend line ko touch kare aur wahan se reverse ho, to yeh selling opportunity ho sakti hai. Yeh level resistance kehlata hai aur yahan se price ke niche jane ke chances zyada hote hain.
                3. Stop Loss and Take Profit: Stop loss ko lower trend line ke niche place karein agar aap buy kar rahe hain aur upper trend line ke upar place karein agar aap sell kar rahe hain. Take profit ko upper trend line ke qareeb set karein jab aap buy kar rahe hain aur lower trend line ke qareeb set karein jab aap sell kar rahe hain.
                2. Trading the Descending Channel
                Descending channel ko trade karne ke liye kuch steps hain:
                1. Sell at the Upper Trend Line: Jab price upper trend line ko touch kare aur wahan se bounce back kare, to yeh selling opportunity ho sakti hai. Yeh level resistance kehlata hai aur yahan se price ke niche jane ke chances zyada hote hain.
                2. Buy at the Lower Trend Line: Jab price lower trend line ko touch kare aur wahan se reverse ho, to yeh buying opportunity ho sakti hai. Yeh level support kehlata hai aur yahan se price ke upar jane ke chances zyada hote hain.
                3. Stop Loss and Take Profit: Stop loss ko upper trend line ke upar place karein agar aap sell kar rahe hain aur lower trend line ke niche place karein agar aap buy kar rahe hain. Take profit ko lower trend line ke qareeb set karein jab aap sell kar rahe hain aur upper trend line ke qareeb set karein jab aap buy kar rahe hain.
                Example
                Suppose kijiye ke aap EUR/USD pair ko trade kar rahe hain aur aapne 4-hour chart par ascending channel identify kiya. Price continuous higher highs aur higher lows banati hai aur aapne upper aur lower trend lines draw ki.
                1. Identify the Trend: Aapne dekha ke market uptrend mein hai aur price higher highs aur higher lows banati ja rahi hai.
                2. Draw Trend Lines: Aapne upper trend line ko higher highs ko connect karte hue draw kiya aur lower trend line ko higher lows ko connect karte hue draw kiya.
                3. Validate the Channel: Aapne dekha ke price consistently in dono trend lines ke beech move kar rahi hai, jo ke channel ko validate karti hai.
                4. Buy at the Lower Trend Line: Jab price lower trend line ko touch ki aur wahan se bounce back ki, aapne 1.1200 par buy position enter ki.
                5. Sell at the Upper Trend Line: Jab price upper trend line ko touch ki aur wahan se reverse hone lagi, aapne 1.1300 par sell position enter ki aur apna profit secure kiya.
                6. Stop Loss and Take Profit: Aapne buy position par stop loss ko 1.1150 par set kiya aur take profit ko 1.1300 par set kiya. Aapne sell position par stop loss ko 1.1350 par set kiya aur take profit ko 1.1200 par set kiya.
                Is example mein aapne ascending channel ko identify kar ke effective trading strategy ko follow ki aur profitable trades hasil ki.

                Practical Example: Trading the Descending Channel

                Example
                Suppose kijiye ke aap GBP/USD pair ko trade kar rahe hain aur aapne 1-hour chart par descending channel identify kiya. Price continuous lower highs aur lower lows banati hai aur aapne upper aur lower trend lines draw ki.
                1. Identify the Trend: Aapne dekha ke market downtrend mein hai aur price lower highs aur lower lows banati ja rahi hai.
                2. Draw Trend Lines: Aapne upper trend line ko lower highs ko connect karte hue draw kiya aur lower trend line ko lower lows ko connect karte hue draw kiya.
                3. Validate the Channel: Aapne dekha ke price consistently in dono trend lines ke beech move kar rahi hai, jo ke channel ko validate karti hai.
                4. Sell at the Upper Trend Line: Jab price upper trend line ko touch ki aur wahan se bounce back ki, aapne 1.3000 par sell position enter ki.
                5. Buy at the Lower Trend Line: Jab price lower trend line ko touch ki aur wahan se reverse hone lagi, aapne 1.2900 par buy position enter ki aur apna profit secure kiya.
                6. Stop Loss and Take Profit: Aapne sell position par stop loss ko 1.3050 par set kiya aur take profit ko 1.2900 par set kiya. Aapne buy position par stop loss ko 1.2850 par set kiya aur take profit ko 1.3000 par set kiya.
                Is example mein aapne descending channel ko identify kar ke effective trading strategy ko follow ki aur profitable trades hasil ki.


                Parallel Channel Pattern Ki Ahmiyat
                Parallel channel pattern forex trading mein bohot ahmiyat rakhta hai. Is pattern ko use kar ke aap market trends ko behtar samajh sakte hain aur profitable trading opportunities ko identify kar sakte hain. Yeh pattern aapko risk management aur trade planning mein bhi madadgar hota hai.

                Parallel channel pattern forex trading mein aik valuable tool hai jo aapko market trends aur price movements ko analyze karne mein madad karta hai. Ascending aur descending channels ko identify kar ke aur effective trading strategies ko follow kar ke aap consistent profits hasil kar sakte hain. Technical analysis mein practice aur discipline bohot zaroori hain aur parallel channel pattern in dono aspects ko cover karne mein madadgar hota hai. Forex trading mein kamiyabi hasil karne ke liye knowledge, analysis, aur discipline zaroori hain aur parallel channel pattern in sab aspects ko enhance karne mein madadgar hota hai.
                Believe in yourself and your abilities. When you fight for your dreams, you can achieve anything.
                • #23 Collapse

                  What is Parallel Channel Pattern

                  Forex trading mein chart patterns ka istemal bohot important hai kyun ke yeh price movements aur market trends ko predict karne mein madadgar hotay hain. Parallel channel pattern unhi important patterns mein se ek hai jo price action ko visualize karne mein madad karta hai. Aayiye, parallel channel pattern ke concept aur uske istemal ko detail mein samajhte hain.

                  Parallel Channel Pattern Kya Hai?

                  Parallel channel pattern ek technical analysis tool hai jo do parallel trend lines se mil kar banta hai. Yeh lines price action ko bound karti hain aur ek channel create karti hain jisme price move karti hai. Yeh pattern indicate karta hai ke price ek specific range mein move ho rahi hai aur iske breakout hone ke chances hain.

                  Parallel Channel Pattern Ki Pehchaan:

                  1. Two Parallel Trend Lines:

                  Yeh pattern do trend lines par mushtamil hota hai jo ek dusre ke parallel hoti hain. Ek upper trend line jo resistance ko show karti hai aur ek lower trend line jo support ko show karti hai.

                  2. Price Bounces:

                  Price in dono trend lines ke darmiyan bounce karti rehti hai, yani upper trend line se neeche aur lower trend line se upar move hoti rehti hai.

                  3. Trend Direction:

                  Parallel channel ek uptrend, downtrend, ya sideways trend ko indicate kar sakta hai. Uptrend mein channel ascending hota hai, downtrend mein channel descending hota hai, aur sideways trend mein channel horizontal hota hai.

                  Parallel Channel Pattern Ka Istemaal:

                  1. Identifying Entry Points:


                  Jab price lower trend line ke qareeb hoti hai, yeh ek acha buying opportunity ho sakti hai. Similarly, jab price upper trend line ke qareeb hoti hai, yeh ek acha selling opportunity ho sakti hai.

                  2. Stop-Loss Placement:

                  Risk management ke liye stop-loss orders ka istemal bohot zaroori hai. Buying karte waqt stop-loss ko lower trend line ke neeche place karain aur selling karte waqt stop-loss ko upper trend line ke upar place karain takay aapke losses limited rahain.

                  3. Target Setting:

                  Profit targets set karte waqt upper trend line (agar buy kar rahe hain) ya lower trend line (agar sell kar rahe hain) ka istemal kar sakte hain. Yeh aapko realistic profit targets set karne mein madad dega.

                  4. Breakout Trading:

                  Parallel channel ka breakout ek significant trading signal ho sakta hai. Agar price upper trend line ko break karti hai, yeh bullish breakout ka signal ho sakta hai. Agar price lower trend line ko break karti hai, yeh bearish breakout ka signal ho sakta hai. Breakout ke baad trend continuation ka chances zyada hote hain.

                  Example:

                  Agar EUR/USD pair ka chart dekhein aur price ek ascending parallel channel mein move kar rahi hai, jab price lower trend line ke qareeb hoti hai, aap buy karne ka soch sakte hain. Jab price upper trend line ke qareeb hoti hai, aap sell karne ka soch sakte hain. Agar price upper trend line ko break karti hai, yeh bullish breakout ka signal ho sakta hai.

                  Conclusion:

                  Parallel channel pattern ek powerful tool hai jo forex traders ko market trends aur price movements ko predict karne mein madad karta hai. Is pattern ka sahi istemal karne ke liye proper research aur practice bohot zaroori hai. Hamesha yaad rakhein ke kisi bhi trading strategy ko use karne se pehle apne trading plan aur risk management ka khayal zaroor rakhein.

                   
                  • <a href="https://www.instaforex.org/ru/?x=ruforum">InstaForex</a>
                  • #24 Collapse

                    What is Parallel Channel Pattern

                    Forex trading mein chart patterns ka istemal bohot important hai kyun ke yeh price movements aur market trends ko predict karne mein madadgar hotay hain. Parallel channel pattern unhi important patterns mein se ek hai jo price action ko visualize karne mein madad karta hai. Aayiye, parallel channel pattern ke concept aur uske istemal ko detail mein samajhte hain.

                    Parallel Channel Pattern Kya Hai?

                    Parallel channel pattern ek technical analysis tool hai jo do parallel trend lines se mil kar banta hai. Yeh lines price action ko bound karti hain aur ek channel create karti hain jisme price move karti hai. Yeh pattern indicate karta hai ke price ek specific range mein move ho rahi hai aur iske breakout hone ke chances hain.

                    Parallel Channel Pattern Ki Pehchaan:

                    1. Two Parallel Trend Lines:

                    Yeh pattern do trend lines par mushtamil hota hai jo ek dusre ke parallel hoti hain. Ek upper trend line jo resistance ko show karti hai aur ek lower trend line jo support ko show karti hai.

                    2. Price Bounces:

                    Price in dono trend lines ke darmiyan bounce karti rehti hai, yani upper trend line se neeche aur lower trend line se upar move hoti rehti hai.

                    3. Trend Direction:

                    Parallel channel ek uptrend, downtrend, ya sideways trend ko indicate kar sakta hai. Uptrend mein channel ascending hota hai, downtrend mein channel descending hota hai, aur sideways trend mein channel horizontal hota hai.

                    Parallel Channel Pattern Ka Istemaal:

                    1. Identifying Entry Points:


                    Jab price lower trend line ke qareeb hoti hai, yeh ek acha buying opportunity ho sakti hai. Similarly, jab price upper trend line ke qareeb hoti hai, yeh ek acha selling opportunity ho sakti hai.

                    2. Stop-Loss Placement:

                    Risk management ke liye stop-loss orders ka istemal bohot zaroori hai. Buying karte waqt stop-loss ko lower trend line ke neeche place karain aur selling karte waqt stop-loss ko upper trend line ke upar place karain takay aapke losses limited rahain.

                    3. Target Setting:

                    Profit targets set karte waqt upper trend line (agar buy kar rahe hain) ya lower trend line (agar sell kar rahe hain) ka istemal kar sakte hain. Yeh aapko realistic profit targets set karne mein madad dega.

                    4. Breakout Trading:

                    Parallel channel ka breakout ek significant trading signal ho sakta hai. Agar price upper trend line ko break karti hai, yeh bullish breakout ka signal ho sakta hai. Agar price lower trend line ko break karti hai, yeh bearish breakout ka signal ho sakta hai. Breakout ke baad trend continuation ka chances zyada hote hain.

                    Example:

                    Agar EUR/USD pair ka chart dekhein aur price ek ascending parallel channel mein move kar rahi hai, jab price lower trend line ke qareeb hoti hai, aap buy karne ka soch sakte hain. Jab price upper trend line ke qareeb hoti hai, aap sell karne ka soch sakte hain. Agar price upper trend line ko break karti hai, yeh bullish breakout ka signal ho sakta hai.

                    Conclusion:

                    Parallel channel pattern ek powerful tool hai jo forex traders ko market trends aur price movements ko predict karne mein madad karta hai. Is pattern ka sahi istemal karne ke liye proper research aur practice bohot zaroori hai. Hamesha yaad rakhein ke kisi bhi trading strategy ko use karne se pehle apne trading plan aur risk management ka khayal zaroor
                     

                    اب آن لائن

                    Working...
                    X