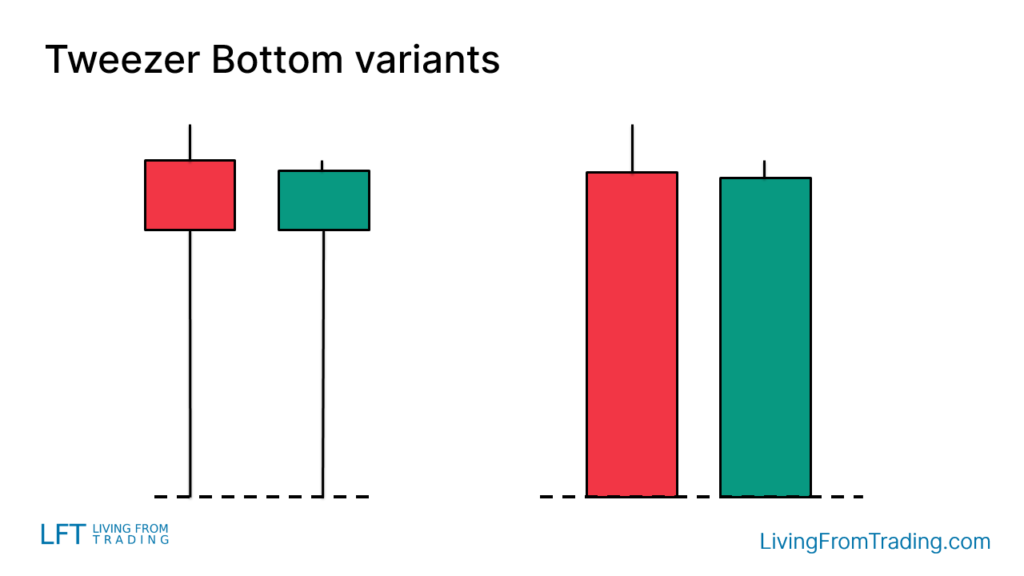
What is Tweezer Bottom candlestick Pattern?
X
  • وقت
  • دکھائیں
Clear All
new posts
  • #1 Collapse

    What is Tweezer Bottom candlestick Pattern?
    Tweezer Bottom Ki Tafseelat:
    Tweezer Bottom, candlestick charts mein aik ahem pattern hai jo market mein trend reversal ko darust karti hai. Yeh pattern usually downtrend ke baad aata hai aur bullish reversal ko represent karta hai.

    1. Shuruwat:
    Tweezer Bottom ek do candlesticks se milta hai. Pehli candlestick downtrend ke doran aati hai aur yeh bearish hoti hai.

    Phela Candlestick ​​​​​
    Pehla candlestick zyadatar lambi hoti hai aur sellers ka dominance darust karta hai. Isme price neeche ja rahi hoti hai, jisse downtrend ki continuation hoti hai.

    3. Dusra Candlestick:
    Dusra candlestick, jo ke direct pehle candlestick ke baad aata hai, ek sudden change ko darust karta hai. Yeh candlestick bullish hoti hai aur iski closing price pehle candlestick ki opening price ke barabar ya usse oopar hoti hai.

    4. Shadows ki Importancy:
    Tweezer Bottom ki pehchan karne ke liye, candlesticks ke shadows ka bhi khass dhyan diya jata hai. Agar dono candlesticks ki lower shadows aapas mein mil rahi hain, toh yeh ek aur confirmation hai ke trend reversal hone wala hai.

    5. Confirmation:
    Is pattern ki confirmation ke liye, traders ko doosre technical indicators aur price patterns ka bhi istemal karna chahiye. Volume analysis bhi madadgar hoti hai is pattern ki tasdeeq mein.

    6. Trading Strategies:
    Agar Tweezer Bottom confirm hota hai, toh traders bullish positions le sakte hain. Stop-loss orders ka istemal zaroori hai taki unexpected market movements se bacha ja sake.

    7. Hidings:
    Trend Reversal Indicator:
    Tweezer Bottom, market mein trend reversal ko darust karta hai.
    Shadows ki Tafseelat:
    Candlesticks ki lower shadows ka dhyan rakhna ahem hai.
    Confirmation ke Liye Istemal:
    Doosre technical indicators aur patterns ka istemal confirmation ke liye kiya jata hai.
    Trading Strategies:
    Confirm Tweezer Bottom ke baad, traders ko cautious trading strategies istemal karni chahiye.

    Yeh pattern market analysis mein ek ahem tool hai, lekin hamesha yaad rakhein ke har ek indicator ki tarah, yeh bhi 100% perfect nahi hota aur risk management ko hamesha priority dein.
  • <a href="https://www.instaforex.org/ru/?x=ruforum">InstaForex</a>
  • #2 Collapse

    Tweezer Bottom candlestick pattern ek popular technical analysis tool hai jo traders aur investors ke liye useful hai. Yeh pattern price action analysis mein istemal hota hai aur market ke reversals ko identify karne mein madad karta hai. Is article mein hum Tweezer Bottom candlestick pattern ke bare mein gehraai se baat karenge.

    1. Tweezer Bottom Kya Hai?

    Tweezer Bottom candlestick pattern ek bullish reversal pattern hai jo downtrend ke baad market ke reversal ko darust karta hai. Yeh pattern do alag alag candlesticks se bana hota hai jinmein pehla candlestick downtrend ke doran form hota hai aur doosra candlestick usi level pe form hota hai jahan pehla candlestick end hota hai. Tweezer Bottom pattern mein pehla candlestick bearish hota hai aur doosra candlestick bullish hota hai.

    2. Tweezer Bottom Ki Shartein

    Tweezer Bottom pattern ko confirm karne ke liye kuch shartein hoti hain:
    • Pehla candlestick bearish (downward) trend mein form hona chahiye.
    • Doosra candlestick pehle candlestick ke neeche ya uske pass close hona chahiye.
    • Doosra candlestick ka size pehle candlestick ke size ke barabar hona chahiye.
    • Yeh pattern long term time frames jaise ki daily charts par zyada reliable hota hai.

    3. Tweezer Bottom Ka Kaam Kaise Karta Hai?

    Tweezer Bottom pattern ka kaam yeh hota hai ki woh downtrend ko indicate karta hai aur bullish reversal ke potential ko show karta hai. Jab market downtrend mein hota hai aur Tweezer Bottom pattern form hota hai, toh yeh indicate karta hai ki sellers ka control kamzor ho raha hai aur buyers ka dominance badh raha hai. Is pattern ke form hone ke baad traders ko uptrend ki shuruaat ka expectation hota hai.

    4. Tweezer Bottom Pattern Ka Istemal Kaise Karein?

    Tweezer Bottom pattern ka istemal karne ke liye traders ko kuch steps follow karne chahiye:
    • Pehle toh downtrend ki identification karni chahiye.
    • Phir Tweezer Bottom pattern ko identify karna chahiye jab market ke bottom pe do alag alag candlesticks form hote hain.
    • Agar yeh pattern long term time frame par form hota hai toh uska signal zyada reliable hota hai.
    • Is pattern ko confirm karne ke liye volume ka bhi dhyan dena chahiye.

    5. Tweezer Bottom Pattern Ka Istemal Karne Ka Fayda

    Tweezer Bottom pattern ka istemal karne se traders aur investors ko kuch fayde milte hain:
    • Is pattern ke istemal se market ke reversals ko detect karna asaan ho jata hai.
    • Yeh pattern downtrend ke end aur uptrend ke shuruat ka signal deta hai.
    • Is pattern ko use karke traders apne trades ko improve kar sakte hain aur profitable trading opportunities ko identify kar sakte hain.

    Conclusion

    Tweezer Bottom candlestick pattern ek powerful technical analysis tool hai jo market ke reversals ko identify karne mein madad karta hai. Is pattern ka sahi taur par istemal karke traders apne trading strategies ko improve kar sakte hain aur profitable trades kar sakte hain. Yeh pattern market ke sentiment ko samajhne mein aur trading decisions ko lene mein madad karta hai.
    • #3 Collapse

      What is tweezer bottom candlestick pattern?

      Click image for larger version  Name:	er.jpg Views:	0 Size:	137.7 KB ID:	12848126


      Tweezer Bottom candlestick pattern ek technical analysis ka tareeqa hai jo ke maaliyaat mein istemal hota hai. Yeh pattern market mein mukhtalif mawafiqat ko pehchan'ne aur trading ke faislay karne ke liye istemal hota hai. Iska naam "tweezer" is liye hai ke iski shaklain do mumtaz hawalaat ko yaani ke candlesticks ko yaad dilatay hain jo ek dosre ke qareeb hote hain.


      Tweezer Bottom Pattern Ki Pechan:

      Tweezer Bottom pattern ek bullish reversal pattern hai, jise jab market mein downtrend ho aur price neekarne ka amkaan ho, tab paaya jata hai. Ismein do alag candlesticks shamil hote hain jo ke aik dosre ke neeche maujood hote hain. Pehla candlestick market mein girawat ko darust karta hai, jabke doosra candlestick us se neeche nahi girta, yani ke dono candlesticks ek dosre ke qareeb hote hain aur neeche girawat ki tarf nahi jaate.

      Key Components of Tweezer Bottom Pattern:
      1. Pehla Candlestick (Downtrend): Tweezer Bottom pattern ka pehla candlestick ek downtrend ko darust karta hai. Is mein market mein neeche ki taraf girawat hoti hai.
      2. Dusra Candlestick (Reversal Signal): Dusra candlestick, pehle wale candlestick ke qareeb hota hai aur us se neeche nahi girta. Yeh bullish signal deta hai aur is se samajhaya jata hai ke market mein reversa hone ka imkaan hai.

      Trading Strategies using Tweezer Bottom:

      Traders tweezer bottom pattern ko samajh kar market mein reversals ki pehchan kar sakte hain. Is pattern ko dekhte hue, woh long position (khareedari) mein dakhil ho sakte hain, yaani ke woh ummeed rakhte hain ke market mein bullish trend shuru ho sakta hai. Stop-loss orders ka istemal kiya ja sakta hai taake nuqsaan ko had mein rakha ja sake.

      Ahmiyat aur Hudood:

      Tweezer Bottom pattern, jab sahi tarah se samjha jata hai, traders ko market trends aur reversals ke bare mein malumat farahem karta hai. Lekin, is pattern ki bhi hudood hain aur is par bharosa karne se pehle, doosre technical indicators aur market ki tafseelat ko bhi madde nazar rakhna chahiye.

      Conclusion:

      Tweezer Bottom candlestick pattern ek aham tool hai jo traders ko market trends aur reversals ke bare mein malumat farahem karta hai. Iski sahi pehchan aur samajh ke saath, traders apne trading strategies ko mazeed behtar bana sakte hain. Lekin, har technical analysis tool ki tarah, tweezer bottom pattern ka bhi istemal soch samajh kar aur doosre factors ko madde nazar rakh kar karna chahiye.
      Last edited by ; 02-03-2024, 05:42 PM.
      • #4 Collapse

        What is Tweezer Bottom candlestick Pattern

        Tweezer Bottom Candlestick Pattern: Forex Mein Candlestick Pattern Ki Tafseel Roman Urdu Mein
        Forex trading mein candlestick patterns ka istemal market direction aur trend reversal ka pata lagane mein madadgar hota hai. Tweezer Bottom Candlestick Pattern bhi ek aham candlestick pattern hai jo bullish reversal ki alamat hoti hai. Is article mein, hum Tweezer Bottom Candlestick Pattern ke mutaliq tafseel se ghoor karenge aur dekheinge ke ye kis tarah se traders ko trading decisions mein guide karta hai.

        1. Tweezer Bottom Candlestick Pattern Ki Tafseel:

        Tweezer Bottom Candlestick Pattern do candlesticks se banta hai. Ye pattern typically downtrend ke doran appear hota hai aur bullish reversal ki alamat hoti hai. Pehla candlestick ek downtrend ke doran form hota hai aur uski body lambi hoti hai. Doosri candlestick bhi downtrend ke doran form hoti hai, lekin uski body choti hoti hai aur pehli candlestick ke neeche close hoti hai.

        2. Tweezer Bottom Candlestick Pattern Ka Arth:

        Tweezer Bottom Candlestick Pattern ko dekh kar traders ko bullish reversal ki alamat milti hai. Ye pattern indicate karta hai ke market ka downtrend khatam ho sakta hai aur bullish trend shuru hone ka chance hai. Jab doosri candlestick pehli candlestick ke neeche close karti hai, to ye bullish sentiment ko darust karta hai.

        3. Tweezer Bottom Candlestick Pattern Ki Alamat:

        Pehli Candlestick: Pehli candlestick ek downtrend ke doran hoti hai aur uski body lambi hoti hai. Ye bearish momentum ko reflect karti hai.

        Doosri Candlestick: Doosri candlestick bhi downtrend ke doran form hoti hai, lekin uski body choti hoti hai aur pehli candlestick ke neeche close hoti hai. Ye bullish reversal ki confirmation hai.

        4. Tweezer Bottom Candlestick Pattern Ka Istemal:

        Tweezer Bottom Candlestick Pattern ka istemal trading decisions mein madadgar hota hai. Agar ye pattern strong downtrend ke baad appear hota hai, to ye bullish reversal ki possibility indicate karta hai. Traders is pattern ko confirm karne ke liye doosre technical indicators aur price action analysis ka bhi istemal kar sakte hain.

        5. Tweezer Bottom Candlestick Pattern Aur Risk Management:

        Tweezer Bottom Candlestick Pattern ke istemal mein risk management ka khaas khayal rakhna zaroori hai. Kyun ke ye pattern bullish reversal ko point out karta hai, isliye traders ko apne stop loss levels aur position sizes ko adjust karna zaroori hai.

        6. Akhri Alfaaz:

        Tweezer Bottom Candlestick Pattern ek aham bullish reversal pattern hai jo traders ko trend reversal ki alamat deta hai. Iska istemal karke, traders market direction ko samajh sakte hain aur apne trading strategies ko improve kar sakte hain. Demo account mein practice karke, traders is pattern ko effectively istemal kar sakte hain.


        • #5 Collapse

          Tweezer Bottom Candlestick Pattern -


          Click image for larger version

Name:	download (5).png
Views:	43
Size:	5.5 کلوبائٹ
ID:	12849258

          Headline: "Tweezer Bottom Candlestick Pattern"

          Ta'aruf (Introduction):


          Tweezer Bottom candlestick pattern ek technical analysis tool hai jo market mein possible bullish reversal ko indicate karta hai. Ye pattern do alag alag candlesticks se banta hai aur traders ise trend reversal ko identify karne mein istemal karte hain.
          Tweezer Bottom Ka Matlab Kya Hai?


          Tweezer Bottom ek aise candlestick pattern ko kehte hain jisme do alag alag candles hote hain, lekin unke low prices ek dosre ke bohot qareeb hoti hain. Yeh pattern market mein bearish phase ke baad hone wale possible bullish reversal ko represent karta hai.
          Kaise Pechane Jaye Tweezer Bottom Pattern Ko?
          1. Do Alag Alag Candles: Tweezer Bottom pattern mein do alag alag candles shamil hote hain. Pehla candle bearish hota hai aur dusra candle usse seedha hone wale bullish movement ko dikhata hai.
          2. Low Prices Ka Tawajjo: Tweezer Bottom ka pehla candle market mein selling pressure ko darust karta hai, lekin dusra candle low price mein recovery ka indication deta hai.
          3. Barabar Ke Niche Hone Wale Prices: Dono candles ke low prices ek dosre ke bohot qareeb ya barabar hote hain, isse pattern ka naam "tweezer" hai.
          Tweezer Bottom Pattern Ki Tijarat Mein Istemal:
          1. Bullish Reversal Signal: Tweezer Bottom pattern bearish trend ke baad hone wale possible bullish reversal ka signal deta hai. Traders ise dekhte hain agar market mein selling pressure ke baad buyers ka acha response aa raha hai.
          2. Confirmation Ke Liye:
            • Is pattern ko confirm karne ke liye traders doosre technical indicators ka bhi istemal karte hain, jaise ke RSI (Relative Strength Index) ya MACD (Moving Average Convergence Divergence).
          3. Stop-Loss Aur Target Levels Ka Tawajjo:
            • Traders ko stop-loss orders ka istemal karke apne positions ko protect karna chahiye, aur target levels tay karke apne profits ko manage karna chahiye.
          Naseehat (Advice):
          1. Thorough Analysis: Tweezer Bottom pattern ko samajhne ke liye thorough analysis karna zaroori hai. Market conditions aur doosre factors ka bhi tawajjo dena chahiye.
          2. Risk Management: Har trading strategy mein risk management ka tawajjo rakhna ahem hai. Stop-loss orders ka istemal karna bhut zaroori hai.
          3. Practice on Demo Account: Naye traders ko pehle demo account par tweezer bottom pattern ko samajhne aur istemal karne mein practice karna chahiye.

          Tweezer Bottom candlestick pattern ek powerful tool ho sakta hai agar ise sahi taur par samjha jaye aur doosre factors ke saath mila kar istemal kiya jaye
          • #6 Collapse


            "Tweezer Bottom"

            candlestick pattern forex trading mein ek ahem technical signal hai jo ke market ke reversal ko indicate karta hai. Is pattern mein do candlesticks hote hain jo ke market ke bottom ya support level par dikhai dete hain aur bullish reversal ko suggest karte hain. Yeh pattern typically downtrend ke baad dikhai deta hai jab market mein selling pressure kam ho rahi hoti hai aur buyers market ko control karne lagte hain.
            Click image for larger version

Name:	Capture.PNG
Views:	42
Size:	193.6 کلوبائٹ
ID:	12849310
            Tweezer Bottom Pattern Ka Tareeqa:
            1. Pehla Candlestick (Bearish): Tweezer bottom pattern mein pehla candlestick bearish hota hai, yaani ke downtrend ko represent karta hai. Is candlestick ka body neeche ki taraf lamba hota hai aur wick (shadow) upper side ki taraf extend hoti hai.
            2. Doosra Candlestick (Bullish): Doosra candlestick bhi neeche ki taraf lamba hota hai aur pehle candlestick ke neeche close hota hai. Is candlestick ka body bhi lamba hota hai aur wick (shadow) upper side ki taraf extend hoti hai.

            Tweezer Bottom Pattern Ko Identify Karna:

            Tweezer bottom pattern ko identify karne ke liye, traders ko do candlesticks ko closely observe karna hota hai. Agar pehla candlestick downtrend ke doran dikhai deta hai aur doosra candlestick usi level par close karta hai, toh yeh ek bullish reversal signal ho sakta hai. Is pattern ko confirm karne ke liye, traders ko volume bhi monitor karna chahiye. Agar volume bhi badh raha hai sath hi tweezer bottom pattern ban raha hai, toh yeh ek strong signal hai.

            Trading Strategy:

            Tweezer bottom pattern ke istemal se traders trading strategies develop karte hain. Jab tweezer bottom pattern confirm hota hai, traders long positions enter kar sakte hain ya existing short positions ko close kar sakte hain. Stop-loss orders lagana aur take-profit levels ko set karna bhi zaroori hai taake nuksan se bacha ja sake.


            Tweezer bottom pattern ek powerful tool hai forex trading mein bullish reversal signals ko identify karne ke liye. Is pattern ko samajhne aur istemal karne ke liye, traders ko thorough research aur practice karna chahiye. Tweezer bottom pattern ke saath-saath, dusre technical indicators aur analysis tools ka bhi istemal karna zaroori hai taake sahi trading decisions liye ja sakein.

            • #7 Collapse

              Hello dear friends


              What is Tweezer Bottom candlestick Patterns


              Tweezer Bottom, forex trading mein istemal hone wala ek candlestick pattern hai jo market trends ko identify karne mein madad karta hai. Yeh pattern bullish reversal ko darust karta hai aur typically downtrend ke baad aata hai.

              Tweezer Bottom Candlestick Pattern Ki Tashkeel:

              Tweezer Bottom pattern mein do consecutive candlesticks hote hain jin ki bottoms aapas mein milte hain. Pehli candlestick bearish hoti hai, jise downtrend ke indicator ki tarah dekha ja sakta hai. Dusri candlestick, jo ke uske baad aati hai, bullish hoti hai aur iski bottom pehli candlestick ki bottom se milti hai. Is tarah ki tashkeel market chart par ek saath do candlesticks ki shakal bana leti hai, jise tweezer bottom kehte hain.

              Tweezer Bottom Candlestick Pattern Ki Tafsilaat:
              1. Consecutive Candlesticks: Tweezer Bottom pattern mein do consecutive candlesticks hote hain. Pehli candlestick bearish hoti hai aur dusri candlestick bullish hoti hai.
              2. Bottoms Ki Milawat: Dono candlesticks ki bottoms aapas mein milti hain, jise tweezer bottom ki tashkeel banati hai.
              3. Volume Ka Tafsilaat: Pattern ko confirm karne ke liye traders volume ki bhi tafsilaat dekhte hain. Agar tweezer bottom ke sath acha volume bhi hota hai, toh yeh pattern aur bhi reliable ho jata hai.

              Tweezer Bottom Candlestick Pattern Ka Maqsad:

              Tweezer Bottom pattern ka maqsad market mein hone wale bearish trend ke baad hone wale potential bullish reversal ko indicate karna hai. Is pattern ki appearance ke baad, traders ko lagta hai ke bearish momentum kamzor ho raha hai aur ab bullish momentum shuru hone wala hai.

              Tweezer Bottom Candlestick Pattern Ka Istemal:
              1. Trend Reversal Indicator: Tweezer Bottom pattern bearish trend ke reversal ko indicate karta hai. Traders is pattern ko dekhte hain taki woh samajh sake ke market ka trend kis direction mein jaane wala hai.
              2. Entry Point: Agar tweezer bottom pattern identify hojata hai, toh traders consider kar sakte hain ke ab market mein bullish reversal hone ke chances hain aur woh long positions le sakte hain.
              3. Stop Loss Orders: Risk management ke liye stop loss orders ka istemal karna important hai. Agar market unexpected direction mein move karta hai, toh stop loss orders se traders apne nuksan ko control mein rakh sakte hain.

              Tweezer Bottom Candlestick Pattern Ke Fayde:
              1. Trend Reversal Indicator: Tweezer Bottom pattern ka istemal karke traders ko bearish trend ke reversal ko identify karne mein madad milti hai.
              2. Simple Recognition: Is pattern ka structure asaan hota hai aur traders ko isko recognize karna aasan hota hai.
              3. Versatility: Tweezer Bottom pattern alag-alag timeframes par kaam karta hai, jisse traders ko versatility milti hai.

              Tweezer Bottom Candlestick Pattern Ke Nuksanat:
              1. False Signals: Kabhi-kabhi market conditions ke changing hone se false signals ho sakte hain, isliye confirmatory factors ka istemal karna zaroori hai.
              2. Market Conditions: Volatile markets mein Tweezer Bottom pattern kam reliable ho sakta hai, isliye market conditions ka bhi dhyan rakhna zaroori hai.

              Tweezer Bottom Candlestick Pattern Ka Istemal Karne Ka Tariqa:
              1. Identification: Tweezer Bottom pattern ko identify karna important hai. Do consecutive candlesticks ki bottoms ko dekhte hue traders ko is pattern ko recognize karna chahiye.
              2. Confirmation: Tweezer Bottom pattern ka signal milne par confirmatory indicators ka istemal karna zaroori hai taki false signals se bacha ja sake.
              3. Risk Management: Trading mein hamesha risk management ka khayal rakhna important hai. Stop loss orders ka istemal karna zaroori hai taki nuksan control mein rahe.

              Tweezer Bottom Candlestick Pattern ek powerful reversal indicator ho sakta hai agar sahi taur par istemal kiya jaye. Traders ko chahiye ke market conditions aur risk tolerance level ko dhyan mein rakh kar iska istemal karein.


              • #8 Collapse

                What is tweezer bottom candlestick pattern?


                Tweezer Bottom Candlestick Pattern ek makhsoos technical analysis ka hissa hai jo kee tijarat mein istemal hota hai. Yeh pattern market mein aane wale changes ko pehchane mein madad karta hai, khaas kar jab ek trend ke badalne ka pata lagana mushkil ho. Yeh pattern traders ko market ke future movements ke bare mein behtareen malumat farahem karta hai.


                Tweezer Bottom Candlestick Pattern Kya Hai?


                Tweezer Bottom ek candlestick pattern hai jo market ke downtrend ke baad aata hai aur ek possible trend reversal ko darust karti hai. Is pattern mein do alag-alag candlesticks hote hain, jo ke ek dusre ke neeche close hote hain. Pehla candlestick downtrend ko represent karta hai aur doosra candlestick is downtrend ke baad hone wale possible reversal ko darust karta hai.


                Kaise Pehchane Tweezer Bottom Pattern Ko?


                Tweezer Bottom pattern ko pehchanna kuchh technical tafseelat par mabni hota hai. Yeh pattern tab banta hai jab do consecutive candlesticks ek dusre ke qareeb close karte hain aur pehla candlestick neeche ki taraf ja raha hota hai jabke doosra candlestick is neeche ja rahe trend ko darust karta hai.


                Iska Tijarat Mein Istemal Kaise Karein?


                Jab Tweezer Bottom pattern paya jata hai, traders isay ek potential trend reversal ka sign samajhte hain. Is pattern ko confirm karne ke liye, traders doosre technical indicators aur tools ka bhi istemal karte hain jaise ke moving averages aur RSI (Relative Strength Index). Agar yeh indicators bhi bullish signals de rahe hain, toh Tweezer Bottom ka confirmation hota hai.


                Nuksan Aur Faida


                Har tijarat mein hoti hai khatra aur munafa, isi tarah Tweezer Bottom pattern ka bhi istemal nuksan ya faida de sakta hai. Traders ko samajhna hoga ke market ki circumstances kis tarah ke hain aur yeh pattern unke trade strategies ke saath kaise milti hai.


                Safalta Ke Tariqe


                Safalta ke liye, traders ko yeh samajhna hoga ke Tweezer Bottom pattern sirf ek tool hai aur isay doosre factors ke saath milake dekha jana chahiye. Proper risk management aur thorough analysis ke bina, kisi bhi pattern ka istemal mushkil ho sakta hai.


                Conclusion


                Tweezer Bottom Candlestick Pattern ek powerful technical tool hai jo market trends ko predict karne mein madad karta hai. Lekin, iska istemal samajhdari aur tijarat mein maharat ki zarurat hoti hai. Traders ko chahiye ke is pattern ko sahi taur par samajh kar istemal karein, aur hamesha market ki changing dynamics ko dhyan mein rakhein.
                • #9 Collapse


                  What is Tweezer Bottom candlestick Pattern?

                  Click image for larger version

Name:	download (32).jpeg
Views:	38
Size:	14.1 کلوبائٹ
ID:	12849390


                  Tweezer Bottom candlestick pattern ek technical analysis tool hai jo market ke trend reversals ko identify karne mein istemal hota hai. Ye pattern bullish reversal ko darust karta hai jab market downtrend se uptrend mein tabdeel hota hai.

                  Tweezer Bottom pattern do alag alag candlesticks se bana hota hai:
                  1. Pehla Candlestick (Bearish): Pehla candlestick downtrend mein hota hai aur bearish hota hai, yaani ke iski closing price opening price se kam hoti hai. Yeh candlestick market mein selling pressure ko darust karta hai.
                  2. Dusra Candlestick (Bullish): Dusra candlestick pehle candlestick ke neeche form hota hai, lekin iski closing price pehle candlestick ki opening price ke qareeb hoti hai ya us se zyada hoti hai. Yeh candlestick market mein buying pressure ko darust karta hai aur downtrend ke khatam hone ka indication deta hai.

                  Tweezer Bottom pattern ki pehchan kuch key features se hoti hai:
                  • Dono candlesticks ka size aur shape ek doosre ke saath milta hai.
                  • Pehla candlestick bearish hota hai aur doosra candlestick bullish hota hai.
                  • Doosra candlestick pehle candlestick ke neeche form hota hai.
                  • Dono candlesticks ki high aur low levels milte hain.

                  Jab aap Tweezer Bottom pattern ko dekhte hain, toh iska matlab hota hai ke market mein selling pressure kamzor hoti ja rahi hai aur buying pressure barh rahi hai, jo ek potential trend reversal ka sign hai. Traders Tweezer Bottom pattern ko dekh kar long positions lete hain ya existing short positions ko cover karte hain, expecting ke ab market uptrend mein move karega.

                  Lekin yaad rakhein, Tweezer Bottom pattern ko confirm karne ke liye, traders aur investors ko doosri technical indicators aur market ki overall conditions ka bhi tajziya karna chahiye, taake false signals se bacha ja sake.


                  • #10 Collapse


                    "Tweezer Bottom"

                    candlestick pattern ek reversal pattern hai jo forex trading mein istemal kiya jata hai. Yeh pattern downtrend ke baad market mein bullish reversal ka signal deta hai. Tweezer Bottom pattern jab do consecutive candles form karte hain, jahan pehla candle down candle hota hai aur doosra candle up candle hota hai, aur dono candles ke low ek hi level par hote hain. Yeh pattern bullish reversal ke indication ke taur par dekha jata hai. Neechay Tweezer Bottom pattern ke istemal aur uski pehchan ke baray mein mukhtasir maloomat di gayi hain:

                    TweezerClick image for larger version

Name:	images.png
Views:	38
Size:	3.6 کلوبائٹ
ID:	12849418 Bottom Pattern Ki Pehchan:
                    1. Downtrend Ke Baad: Tweezer Bottom pattern typically downtrend ke baad dekha jata hai. Jab market ek downtrend mein hota hai aur phir do consecutive candles form hote hain jinke lows ek hi level par hote hain, to yeh Tweezer Bottom pattern ban jata hai.
                    2. Do Consecutive Candles: Tweezer Bottom pattern mein do consecutive candles hote hain. Pehla candle down candle hota hai jo bearish momentum ko indicate karta hai, aur doosra candle up candle hota hai jo bullish reversal ki indication deta hai.
                    3. Lows Ka Ek Hi Level: Tweezer Bottom pattern mein dono candles ke lows ek hi level par hote hain. Yeh lows market mein support level ke tor par kaam karte hain aur bullish reversal ka indication dete hain.

                    Tweezer Bottom Pattern Ka Istemal:
                    1. Bullish Reversal Signal: Tweezer Bottom pattern bullish reversal ka signal provide karta hai. Jab market downtrend ke baad Tweezer Bottom pattern form karta hai, to yeh bullish reversal ki indication hoti hai aur traders ko long positions ke liye taiyar ho jana chahiye.
                    2. Confirmation Signals: Tweezer Bottom pattern ke sath trading karte waqt, traders ko doosre technical indicators aur price action signals ka bhi istemal karna chahiye taake Tweezer Bottom pattern ki validity ko confirm kiya ja sake.
                    3. Stop Loss Aur Take Profit: Tweezer Bottom pattern ke sath trading karte waqt, tight stop loss aur take profit levels set karna zaroori hai taake nuqsaan se bacha ja sake aur munafa hasil kiya ja sake.

                    Tweezer Bottom Pattern Ke Sath Trading Karne Ka Tareeqa:
                    1. Entry Point: Tweezer Bottom pattern ke sath trading karte waqt, traders long positions lete hain jab market Tweezer Bottom pattern ke upar se break karta hai aur uptrend shuru hota hai.
                    2. Risk Management: Tweezer Bottom pattern ke sath trading karte waqt, risk management ka bohot ahem kirdar hota hai. Traders ko tight stop loss levels set karna chahiye taake nuqsaan se bacha ja sake.

                    Tweezer Bottom pattern ek mufeed technical analysis tool hai jo traders ko bullish reversal signals provide karta hai. Iska istemal karke, traders market ke movements ko samajh sakte hain aur behtar trading decisions le sakte hain.

                    • #11 Collapse

                      ### Tweezer Bottom Candlestick Pattern Kya Hai?
                      Forex trading aur technical analysis mein candlestick patterns market trends aur potential reversals ko identify karne ke liye use kiye jate hain. Inmein se ek important pattern “Tweezer Bottom” hai. Yeh pattern bearish trends ke baad bullish reversal ko indicate karta hai aur trading decisions mein madadgar ho sakta hai. Aaiye, Tweezer Bottom candlestick pattern ko detail mein samjhte hain.

                      **1. Pattern Ka Formation:**
                      Tweezer Bottom pattern tab banta hai jab price do consecutive candles ke through similar low points banati hai. Yeh pattern generally downtrend ke baad develop hota hai. Is pattern mein do candles hoti hain jo ek dusre ke saath align hoti hain, jahan dono candles ka low point ek hi level par hota hai.

                      **2. Candlestick Characteristics:**
                      - **First Candle:** Pehli candle ek long bearish candle hoti hai jo strong selling pressure ko show karti hai. Iska low point market ke downtrend ko reflect karta hai.
                      - **Second Candle:** Dusri candle bhi bearish hoti hai, lekin iske low point ko pehli candle ke low point ke sath align karta hai. Yeh candle bhi selling pressure ko show karti hai lekin market ke downward momentum ko maintain karte hue ek support level ko test karti hai.

                      **3. Confirmation:**
                      Tweezer Bottom pattern ko confirm karne ke liye third candle ka observe karna zaroori hota hai. Third candle usually ek bullish candle hoti hai jo Tweezer Bottom ke low level se upar close hoti hai. Is candle ke close hone par pattern confirm hota hai aur bullish reversal signal generate hota hai. Volume analysis bhi pattern ki confirmation mein madadgar hota hai; agar volume increase hota hai, to pattern zyada reliable hota hai.

                      **4. Trading Strategy:**
                      Tweezer Bottom pattern ko trading strategy mein include karne ke liye:
                      - **Entry Point:** Pattern ke confirm hone ke baad, entry point ko bullish confirmation candle ke high level ke paas consider kiya jata hai.
                      - **Stop-Loss:** Risk management ke liye, stop-loss level Tweezer Bottom pattern ke low point ke niche set kiya jata hai.
                      - **Profit Target:** Profit targets ko identify karne ke liye aap previous resistance levels aur risk-to-reward ratio ko consider kar sakte hain.

                      **5. Market Context:**
                      Tweezer Bottom pattern ko market context ke sath samajhna zaroori hai. Yeh pattern tab zyada effective hota hai jab overall market ya currency pair mein strong downtrend ho aur support levels ko test kar raha ho.

                      Tweezer Bottom candlestick pattern forex trading mein potential trend reversal ko identify karne ke liye ek useful tool hai. Is pattern ko accurately analyze karke aur trading signals ko confirm karke aap apni trading strategy ko enhance kar sakte hain aur profitable trades execute kar sakte hain.
                      • #12 Collapse

                        **What is Tweezer Bottom Candlestick Pattern?**
                        Tweezer Bottom candlestick pattern forex trading mein aik ahem reversal pattern hai jo trend ke bottom pe paaya jata hai. Yeh pattern do candles se mil kar banta hai jo market ke trend mein reversal ka ishara deti hain. Tweezer Bottom pattern tab banta hai jab do consecutive candles mein low points barabar ya qareeb hon, aur yeh signal hota hai ke bearish trend apne end pe pohanch gaya hai aur bullish reversal shuru hone wala hai.

                        Pehli candle bearish hoti hai jo ke trend continuation ka ishara deti hai. Doosri candle bullish hoti hai jo ke reversal ka pehla sign hoti hai. Dono candles ke low points same ya qareeb hote hain jo ke market ke support level ko indicate karte hain. Iska matlab yeh hai ke market is level se neeche nahi ja raha, aur buyers ne is point par market mein entry lena shuru kar diya hai.

                        Is pattern ko identify karne ke liye traders ko chart par do consecutive candles dekhni chahiye jinke low points barabar hon. Pehli candle bearish aur doosri bullish hoti hai, jisme doosri candle ka closing price pehli candle ke low se oopar hota hai. Yeh pattern aksar support levels ke qareeb paaya jata hai jo ke reversal ke liye ek strong indicator hota hai.

                        Tweezer Bottom candlestick pattern ko aur ziada strong banane ke liye traders doosre indicators jaise ke RSI (Relative Strength Index) ya MACD (Moving Average Convergence Divergence) ka istimaal karte hain. Agar yeh indicators bhi oversold conditions ya bullish divergence ka signal den, toh Tweezer Bottom pattern ke sath mil kar yeh ek strong bullish signal ban jata hai.

                        Is pattern ko use karte waqt, traders ko yeh yaad rakhna chahiye ke yeh pattern sirf trend reversal ka potential signal hai. Har Tweezer Bottom pattern successful reversal nahi deta, is liye risk management ka khayal rakhna bohat zaroori hai. Stop loss orders aur proper risk-to-reward ratio ka istimaal karte huye trade karna chahiye taake agar market expectation ke mutabiq move na kare toh bhi losses minimum hon.

                        Tweezer Bottom candlestick pattern ke sath trading karna market ka sentiment samajhne aur market ke trend ko identify karne mein madadgar sabit ho sakta hai. Lekin is pattern ko doosre technical analysis tools ke sath combine karke istimaal karna best practice hai taake aapko market mein entry aur exit ka sahi waqt maloom ho sake.
                        • #13 Collapse

                          **Engulfing Candlestick Pattern: Kya Hai?**
                          Engulfing candlestick pattern aik important reversal pattern hai jo market mein trend change hone ka indication deta hai. Yeh pattern do consecutive candles par mushtamil hota hai aur trading mein buyers aur sellers ke balance ko represent karta hai. Forex trading mein, Engulfing pattern ka sahi istemal karne ke liye niche diye gaye points par gaur karein:

                          1. **Engulfing Pattern ki Definition:**
                          - Engulfing pattern do candles se banta hai: aik chhoti candle aur uske baad ek badi candle jo pehli candle ke body ko poori tarah se cover kar leti hai.
                          - Agar yeh pattern uptrend ke baad aata hai aur bearish nature ka hota hai to isse **Bearish Engulfing Pattern** kehte hain.
                          - Agar yeh pattern downtrend ke baad aata hai aur bullish nature ka hota hai to isse **Bullish Engulfing Pattern** kehte hain.

                          2. **Bearish Engulfing Pattern:**
                          - **Formation:** Is pattern mein pehli candle bullish hoti hai, jiska matlab hai ke market upar ki taraf move kar raha hai. Uske baad aane wali candle bearish hoti hai jo pehli candle ke body ko poori tarah se engulf kar leti hai.
                          - **Signal:** Yeh pattern is baat ka indication hai ke market mein sellers ka pressure zyada ho gaya hai aur uptrend reverse ho kar downtrend mein badal sakta hai.
                          - **Trading Strategy:** Jab yeh pattern form ho, traders ko sell signal milta hai. Stop-loss ko pehli candle ke high ke upar set karna chahiye.

                          3. **Bullish Engulfing Pattern:**
                          - **Formation:** Is pattern mein pehli candle bearish hoti hai, jiska matlab hai ke market neeche ki taraf move kar raha hai. Uske baad aane wali candle bullish hoti hai jo pehli candle ke body ko poori tarah se engulf kar leti hai.
                          - **Signal:** Yeh pattern is baat ka indication hai ke market mein buyers ka pressure barh raha hai aur downtrend reverse ho kar uptrend mein badal sakta hai.
                          - **Trading Strategy:** Jab yeh pattern form ho, traders ko buy signal milta hai. Stop-loss ko pehli candle ke low ke neeche set karna chahiye.

                          4. **Volume Confirmation:**
                          - Volume analysis bhi Engulfing pattern ko confirm karne mein madadgar hoti hai.
                          - Agar Engulfing candle ke saath volume high ho, to yeh pattern ka signal aur bhi strong ho jata hai, kyun ke yeh baat confirm hoti hai ke market mein buyers ya sellers ka pressure barh raha hai.

                          5. **Market Sentiment:**
                          - Engulfing pattern traders ke sentiments ko reflect karta hai. Bearish Engulfing pattern dikhata hai ke buyers ka control kamzor ho gaya hai aur sellers ne market pe control le liya hai.
                          - Bullish Engulfing pattern yeh signal deta hai ke sellers ke baad buyers ne market mein entry kar li hai aur uptrend ka aaghaz ho sakta hai.

                          6. **Combining with Other Indicators:**
                          - Engulfing pattern ko doosre technical indicators ke sath combine karna chahiye taake trading signals zyada reliable hon.
                          - Moving Averages, RSI (Relative Strength Index), aur MACD indicators ke sath is pattern ka use trading decisions ko mazboot kar sakta hai.

                          7. **Conclusion:**
                          - Engulfing candlestick pattern forex trading mein aik powerful tool hai jo market ke trend reversal ko pehle hi pakadne mein madad karta hai.
                          - Yeh pattern ko sahi tarah se samajh kar aur doosre confirmation tools ke sath use kar ke aap apni trading strategy ko zyada profitable bana sakte hain.

                          Engulfing candlestick pattern ko effectively use karne se forex traders ke liye market ke reversal points ko identify karna aur profitable trading opportunities dhoondhna aasan ho jata hai. Is pattern ki understanding aapko market mein edge de sakti hai aur aapki overall trading performance ko improve kar sakti hai.
                           
                          • #14 Collapse

                            **Bearish Harami Pattern**
                            Bearish Harami ek candlestick pattern hai jo market ke uptrend ke baad bearish reversal ka signal deta hai. Yeh pattern do candlesticks ke combination se banta hai aur potential price decline ko indicate karta hai. Yahan Bearish Harami pattern ke key points aur trading strategies hain:

                            1. **Bearish Harami Pattern Kya Hai?**
                            - **Formation:** Bearish Harami pattern do candlesticks se milkar banta hai. Pehla candlestick ek large bullish body hota hai, jabke doosra candlestick choti bearish body hoti hai jo pehle ke candlestick ke andar completely enclosed hoti hai.
                            - **Appearance:** Pehle candlestick ka large body market ke strong uptrend ko dikhata hai. Doosra candlestick chota aur narrow hota hai, jo indicate karta hai ke bullish momentum kam ho raha hai.

                            2. **Pattern Identification:**
                            - **Previous Trend:** Yeh pattern tab banta hai jab market ek strong uptrend mein hota hai. Pattern ke formation ke baad, bearish reversal ke signals milte hain.
                            - **Body Size:** Pehle candlestick ka body doosre candlestick ke body ko completely engulf karta hai. Doosra candlestick ka body chhoti aur narrow hoti hai, jo price movement ke slowdown ko indicate karta hai.

                            3. **Trading Strategy:**
                            - **Entry Point:** Bearish Harami pattern ke formation ke baad entry point tab hota hai jab price doosre candlestick ke low ko break karti hai. Yeh confirmation hota hai ke bearish trend shuru ho raha hai.
                            - **Confirmation:** Additional indicators jaise Moving Averages ya Relative Strength Index (RSI) ka use bhi karna chahiye. Agar RSI overbought zone se bearish zone mein move karta hai, to yeh confirmation provide karta hai.

                            4. **Risk Management:**
                            - **Stop-Loss:** Stop-loss order ko pehle candlestick ke high ke thoda upar set karna chahiye. Yeh large losses se protect karta hai aur trade ko risk management ke under rakhta hai.
                            - **Take-Profit:** Take-profit levels ko previous support levels ya technical targets par set kiya jata hai. Yeh profit-taking points aapko trade ke gains secure karne mein madad karte hain.

                            5. **Practical Tips:**
                            - **Pattern Confirmation:** Pattern ke confirmation ke liye price action aur volume ko bhi observe karna zaroori hai. Agar volume badh raha hai to pattern ki validity barh jati hai.
                            - **Market Conditions:** Bearish Harami pattern ko market conditions aur economic factors ke sath consider karna chahiye. Strong uptrend ke baad pattern ka hone se bearish reversal ki probability zyada hoti hai.

                            Bearish Harami pattern ek effective tool hai jo market ke reversal points ko identify karne mein madad karta hai. Sahi analysis aur risk management ke sath, aap is pattern ko profitable trades ke liye use kar sakte hain.
                               
                            • <a href="https://www.instaforex.org/ru/?x=ruforum">InstaForex</a>
                            • #15 Collapse

                              **Tweezer Bottom Candlestick Pattern: Kya Hai Aur Iski Khasiyat**
                              Tweezer Bottom ek candlestick pattern hai jo market ke downtrend ke baad bullish reversal ka signal deta hai. Yeh pattern do candlesticks se milkar banta hai aur price ke potential reversal points ko indicate karta hai. Yahan Tweezer Bottom candlestick pattern ki definition aur khasiyat diye gaye hain:

                              1. **Tweezer Bottom Pattern Kya Hai?**
                              - **Definition:** Tweezer Bottom pattern do consecutive candlesticks se milkar banta hai. Pehla candlestick ek long bearish (red) body ke sath hota hai aur doosra candlestick ek similar size ki bullish (green) body ke sath hota hai. Dono candlesticks ke lows same level par hote hain, ya bahut hi close hote hain.
                              - **Formation:** Pattern tab develop hota hai jab market ek significant downtrend ke baad do candlesticks ke sath ek strong support level ko test karta hai. Yeh pattern market ke bearish momentum ke khatam hone aur bullish reversal ke shuru hone ka indication hai.

                              2. **Characteristics of Tweezer Bottom Pattern:**
                              - **Previous Trend:** Tweezer Bottom pattern downtrend ke baad banta hai, jo indicate karta hai ke market bearish momentum khatam ho raha hai aur bullish trend shuru ho raha hai.
                              - **Candlestick Bodies:** Dono candlesticks ki bodies similar size ki hoti hain, lekin ek bearish aur doosra bullish hota hai. Yeh market ki strength aur reversal ki confirmation ko indicate karta hai.
                              - **Support Level:** Tweezer Bottom pattern tab zyada effective hota hai jab yeh pattern strong support level ke aas-paas develop hota hai. Yeh support level market ke potential reversal point ko indicate karta hai.

                              3. **Pattern Identification:**
                              - **Price Action:** Pehla candlestick ek long bearish body ke sath hota hai jo previous price movement ko show karta hai. Doosra candlestick ek long bullish body ke sath hota hai jo price ke upward reversal ko indicate karta hai. Dono candlesticks ke lows similar level par hone chahiye.
                              - **Volume Analysis:** Volume bhi pattern ke strength ko confirm karne ke liye check kiya jata hai. Agar second candlestick ke dauran volume increase hota hai, to yeh pattern ke signal ko strong banata hai.

                              4. **Trading Strategy with Tweezer Bottom Pattern:**
                              - **Entry Point:** Entry point tab hota hai jab price second candlestick ke high ko break karti hai. Yeh bullish reversal ke confirmation ka signal hota hai.
                              - **Confirmation:** Additional technical indicators, jaise Moving Averages ya RSI, ko bhi use karke signal ko confirm kiya jata hai. Agar RSI oversold zone se nikal kar bullish zone mein move karta hai, to yeh pattern ke signal ko confirm karta hai.

                              5. **Risk Management:**
                              - **Stop-Loss:** Stop-loss ko pehla candlestick ke low ke thoda neeche set karna chahiye. Yeh large losses se protection provide karta hai aur risk management ko ensure karta hai.
                              - **Take-Profit:** Take-profit levels ko previous resistance levels ya technical targets ke hisaab se set kiya jata hai. Yeh aapke gains ko secure karne mein madad karta hai.

                              Tweezer Bottom pattern ek effective reversal signal hai jo market ke potential uptrend ko indicate karta hai. Sahi analysis aur risk management ke sath, aap is pattern ko profitable trading strategy mein convert kar sakte hain.
                               

                              اب آن لائن

                              Working...
                              X