What is bullish counter attack pattern
X
  • وقت
  • دکھائیں
Clear All
new posts
  • #1 Collapse

    What is bullish counter attack pattern
    BULLISH COUNTER ATTACK PATTERN:

    Market indication aur predictions ky leye pattern ko samajhna aur unn per amal kerna traders ky leye bhout zaroori hy. Ess ky baghair koi bi trader positive trading perform nahi ker sakta. Esi leye aaj hum aik aur pattern jis ko market mein counter attack pattern kaha jata hy, oss ky realated complete discussion kery gy. Counterattack candlestick pattern jab create hoti hay, tou aesy main market ka reversal trend confirm hota hy. Jab market continuously aik trend ko follow kerty huey movement kerti hay aur aik big candle create hony kay baad market main next candle gap ky sath open ho ker reverse direction main movement kerty huey previous candle ki closing position ky sath hi close ho jati hay, tou aesy mein jo pattern create hota hay osy counterattack candlestick pattern kaha jata hay. Agar market kisi aik direction mein big movement complete ker chuki hay, tou phir oss ky according reverse direction main bhi movement continue ker leti hay. Yeh trend reversal ki clear confirmation aur indication hoti hay.

    Click image for larger version

Name:	s.jpeg
Views:	41
Size:	42.6 کلوبائٹ
ID:	12848053


    SIGNIFICANCE OF BULLISH COUNTER ATTACK PATTERN:

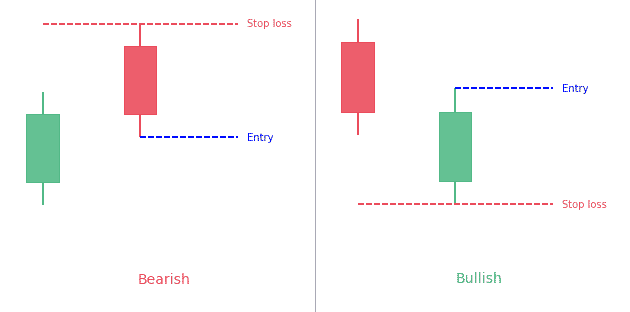
    Dear forex friends market mein yeh pattern just like “bullish belt hold candlestick pattern” ya “bearish thrusting line pattern” jaisa nazar ata hay. But second bearish candle ki shape different honne ki waja se yeh pattern different ban jata hay. Yeh pattern 2 candles par consisted hota hay. Jiss mein 1st candle bearish aur 2nd candle bullish candle hoti hay. Ess ki first candle aik long real body wali bearish candle hoti hy jo kay bearish trend ya low prices ko indicate karti hay. Yeh candle black ya red color mein hoti hay. Ess ki second candle aik real body wali bullish candle hoti hay, jo kay pehli candle kay bottom par open ho kar ussi k same closing point k in line close hoti hay. First aur second candles ka closing price lazmi same point par meet karna chaheye. Enn patterns ki identity ka knowledge trading mein apply kiya jaye tu market ko samjhny mein koi mushkil nahi hoti, aur traders easily ess pattern ko identify ker kay trade laga lety hein.

    Click image for larger version

Name:	d.jpg
Views:	28
Size:	42.5 کلوبائٹ
ID:	12848054

    TECHNICAL ANALYSIS:


    Friends professional traders jab yeh prediction ker lety hain, ky market buy ki side ja rahe hay, ya market sell ki traf ja rhe hay, tou aesy time mein unn ky leye market entry bhout easy ho jati hy. Ess leye hamein chahye keh aagar ham isko correctly understand ker gy tou ess sey ham apni trade ko secure kar saken gy. Ess tarah kay indicators mein market trend reverse show ho sakta hy, aur forward bi show ho sakta hy. Jab bi market me up trend start hota hy aur eik line close ho jati hy tou second line eik gap ke sath open hoti hy . Yeh gap kuch ess tarah se form hota hy ky jaisy bearish candle aur bullish candle eik dosry ke sath eik point py aa ker join ho jaty hain . Jaisy hee yeh eik point py a kar join hoty hain tou exactly ess time mein jo trend hamein milta hy uss mein selling traders bht ziada hoty hain, kyu kay ess time both candles same point py join hoti hein. Aur yeh bht essential hy keh market apni trend selling me lay kar ja raha hota hay. Traders kay leye market mein apna order place kerny ka ideal time hota hay.

    Click image for larger version

Name:	f.png
Views:	19
Size:	67.2 کلوبائٹ
ID:	12848055

  • <a href="https://www.instaforex.org/ru/?x=ruforum">InstaForex</a>
  • #2 Collapse

    Bullish Counter Attack Pattern ek technical analysis ka tajurba hai jo ke stock market mein istemal hota hai. Yeh pattern traders ko price action ko samajhne aur market ke future direction ka andaza lagane mein madad deta hai. Is article mein hum bullish counter attack pattern ke bare mein mukhtasar tafseelat se guftagu karenge.

    1. Bullish Counter Attack Pattern Kya Hai?

    Bullish Counter Attack Pattern ek candlestick pattern hai jo ke uptrend ke doran dekha jata hai. Is pattern mein do candlesticks involved hote hain: pehla candle bearish hota hai, jo ke downtrend ka part hota hai, aur doosra candle bullish hota hai, jo ke uptrend ki taraf ishara karta hai. Bullish counter attack pattern ko "bullish reversal pattern" bhi kaha jata hai.

    2. Bullish Counter Attack Pattern Ki Pehchan Kaise Ki Jati Hai?

    Bullish counter attack pattern ki pehchan karne ke liye traders ko kuch khaas points par tawajjo deni hoti hai:
    • Pehla candle bearish hota hai aur iski body choti hoti hai.
    • Doosra candle bullish hota hai aur iski body pehle candle ki body se bada hota hai.
    • Doosra candle ke open aur close pehle candle ke close ke near ya us se ooper hota hai.
    • Bullish counter attack pattern ki pehchan karne ke liye volume bhi dekha jata hai. Agar volume pehle candle ke mukable doosre candle mein zyada hota hai, to yeh pattern mukhtasar hota hai.

    3. Bullish Counter Attack Pattern Ka Matlab Kya Hai?

    Bullish counter attack pattern ka matlab hota hai ke market ka sentiment change hone wala hai. Jab pehla bearish candle formation hota hai, to yeh indicate karta hai ke sellers control mein hain. Lekin jab doosra candle bullish hota hai aur pehle candle ko cover kar leta hai, to yeh dikhata hai ke buyers ka strong comeback hai aur market ki trend reversal hone wali hai.

    4. Bullish Counter Attack Pattern Ka Istemal Kaise Kiya Jata Hai?

    Bullish counter attack pattern ka istemal karne ke liye traders ko kuch points par tawajjo deni hoti hai:
    • Pattern ko confirm karne ke liye doosre candle ki body pehle candle ki body se badi honi chahiye.
    • Volume ki analysis bhi zaroori hai. Agar doosre candle mein volume pehle candle se zyada hai, to yeh pattern strong hota hai.
    • Agar market mein overall bullish sentiment hai, to yeh pattern aur bhi powerful ho jata hai.

    5. Bullish Counter Attack Pattern Ki Limitations

    Bullish counter attack pattern ki limitations ko samajhna bhi zaroori hai. Kuch mamooli baaton par dhyan dena chahiye:
    • Is pattern ka istemal sirf doosri candle ke close ke baad confirm hota hai. Is wajah se entry point miss ho sakta hai.
    • Kisi bhi single pattern par pura bharosa na karein aur hamesha doosri technical indicators ka bhi istemal karein.
    • Market mein uncertainty hone ki wajah se, pattern ke saath risk management bhi zaroori hai.

    Ikhtitami Guftugu

    Bullish counter attack pattern ek powerful technical analysis tool hai jo ke traders ko market ke direction ka andaza lagane mein madad deta hai. Lekin iska istemal karne se pehle, traders ko iski pehchan aur limitations ko samajhna zaroori hai. Pattern ko confirm karne ke liye doosri technical indicators ka bhi istemal zaroori hai. Is tarah, traders apne trading strategies ko mazbooti se banaye aur market mein kamiyabi haasil kar sakte hain.
    • #3 Collapse

      What is bullish counter attack pattern

      Click image for larger version

Name:	iii.jpeg
Views:	23
Size:	151.0 کلوبائٹ
ID:	12848148


      Bullish Counter Attack Pattern ek technical analysis tool hai jo market mein hone wale trends ko identify karne aur traders ko potential buying opportunities dikhane mein madad karta hai. Yeh pattern market charts par visual representation ke roop mein aata hai aur bullish trend ke reversal ko suggest karta hai.


      Bullish Counter Attack Pattern Ka Tijarati Taur Par Ta'aruf:
      1. Formation: Bullish Counter Attack Pattern ka formation jab hota hai jab market mein initially downtrend (girawat) ho rahi hoti hai, lekin ek certain point par buyers control hasil karte hain aur market mein trend reversal shuru hota hai.
      2. Candlestick Representation: Is pattern ko candlestick charts par dekha ja sakta hai. Jab downtrend ke baad market mein trend change hota hai, ek large bullish candle aati hai jo downtrend ke bearish candles ko cover karti hai. Is large bullish candle ko "counter attack" kehte hain.
      3. Volume Increase: Bullish Counter Attack Pattern ke sath hone wale reversal ko confirm karne ke liye, traders volume ka bhi dhyan rakhte hain. Agar reversal ke samay trading volumes bhi badh jaaye, toh yeh indicate karta hai ke market mein strong buying interest hai.
      4. Resistance Breakout: Is pattern ke sath hone wale bullish reversal ke baad, market ek specific resistance level ko bhi break kar sakta hai, jo ki ek aur positive sign ho sakta hai.
      Bullish Counter Attack Pattern Ke Fayde:
      • Early Trend Reversal Indication: Bullish Counter Attack Pattern traders ko early indication deta hai ke market mein downtrend ke badle uptrend shuru ho sakta hai.
      • Entry Point Identification: Is pattern ka istemal karke traders apne trades ke liye entry points ko identify kar sakte hain. Counter attack candle ke appearance par entry ka faisla hota hai.
      • Risk Management: Bullish Counter Attack Pattern ke istemal se traders apne trades ko risk ko kam karne mein madad le sakte hain, kyun ke reversal ki early indication milti hai.
      Kuch Zaroori Baatein:
      • Confirmation Ki Zarurat Hai: Hamesha yaad rahe ke ek pattern ko dekhte hi trading decision lena thoda riski ho sakta hai. Isliye, confirmation ke liye doosre technical indicators ka bhi istemal kiya jata hai.
      • Practice Aur Experience: Bullish Counter Attack Pattern ko sahi taur par samajhna aur istemal karna practice aur experience ko require karta hai. Regular market analysis aur observation ke through traders is pattern ko behtar taur par samajh sakte hain.

      Yeh important hai ke traders market analysis mein ek holistic approach adopt karein aur ek hi indicator par pura bharosa na karein. Bullish Counter Attack Pattern ek matra tool nahi hai, lekin jab sahi tarah se istemal kiya jata hai, toh yeh traders ko market ke potential reversals ke bare mein agah kar sakta hai.
      • #4 Collapse

        Bullish Counter Attack

        Bullish Counter Attack" pattern ek technical analysis concept hai jo price action ko analyze karne mein istemal hota hai, khaaskar forex trading aur stock market mein. Ye patternek bullish reversal pattern hai, yaani ke ye ek uptrend ke end par ya downside movement ke baad aane wale bullish trend ko darust karna hota hai.

        Bullish Counter Attack pattern ko identify karne ke liye, traders price charts ki madad se price action ko dekhte hain. Ye pattern do main components par mabni hota hai:

        Candlesticks

        Bullish Counter Attack pattern ek specific candlestick configuration par mabni hota hai. Is mein ek down day (jab price lower close karta hai) ke baad ek strong bullish candle aati hai jo pehle din ke low se start hoti hai aur pehle din ke high tak close hoti hai. Yani, ye bullish candle pehle din ke downtrend ko counter karta hai.

        Volume

        Is pattern ko confirm karne ke liye, traders volume ki bhi tafseel dekhte hain. Bullish Counter Attack pattern mein volume pehle din ke down day ke volume se kam hota hai ya fir woh approximately same hota hai. Yani, jab price bullish reversal karta hai, toh volume decrease hota hai ya stable rehta hai, jo ek positive sign hai.

        Jab ye pattern form hota hai, toh traders consider karte hain ke market ka sentiment change ho sakta hai aur price ka trend upward move kar sakta hai. Lekin, jaise har technical analysis pattern mein hota hai, ye bhi kabhi kabhi accurate nahi hota aur isliye dusre technical indicators aur confirmatory signals ke saath istemal kiya jata hai.

        Bilkul, zaroor! Bullish Counter Attack pattern ko mazeed samajhne ke liye, yahan kuch ahem points aur considerations hain:
        Click image for larger version

Name:	counterattack-bullish-candlestick-chart-pattern-candlestick-chart-pattern-for-traders-powerful-bullish-candlestick-chart-for-forex-stock-cryptocurrency-vector.jpg
Views:	26
Size:	138.6 کلوبائٹ
ID:	12848205
        Confirmation

        Bullish Counter Attack pattern ko confirm karne ke liye, traders doosre technical indicators aur patterns ka istemal karte hain. Misal ke taur par, price ke sath RSI (Relative Strength Index) ya MACD (Moving Average Convergence Divergence) jaise momentum indicators ka istemal kiya ja sakta hai.

        Stop Loss aur Entry Point

        Is pattern ko trade karne ke liye, traders stop loss aur entry points ko bhi dhyaan mein rakhte hain. Stop loss ko typically pattern ke neeche ke low ke thode se neeche set kiya jata hai taake agar trade ulta ho gaya toh nuksan kam ho. Entry point ko wahi jagah set kiya jata hai jahan bullish candle ka close hota hai.

        Time Frame

        Bullish Counter Attack pattern ko kisi bhi time frame par dekha ja sakta hai, lekin zyadatar traders ek higher time frame jaise ke daily ya weekly chart par iska istemal karte hain taake pattern ki validity aur significance ko samajh sakein.

        Risk Management

        Jaise har trading strategy mein, risk management Bullish Counter Attack pattern ke trade mein bhi ahem hota hai. Traders ko apne trading plan mein risk ko manage karne ke liye apne capital ka ek hissa nikaalna chahiye aur har trade ke liye sahi risk-reward ratio set karna chahiye.

        Backtesting

        Naye traders ko ye pattern samajhne aur istemal karne ke liye apne strategy ko backtest karna chahiye. Backtesting karne se pata chalta hai ke pattern ke istemal karne par kitna success rate hota hai aur kis tarah ke market conditions mein ye sabse zyada effective hota hai.
        • <a href="https://www.instaforex.org/ru/?x=ruforum">InstaForex</a>
        • #5 Collapse

          **Bullish Counter Attack Pattern: Ek Jaiza**
          Bullish Counter Attack Pattern aik technical analysis pattern hai jo share market aur forex trading mein trend reversal ko indicate karta hai. Yeh pattern khas taur par bearish trend ke baad aata hai aur market ke bullish reversal ka signal deta hai. Is pattern ko samajhna aur identify karna trading strategies ko improve karne ke liye zaroori hai.

          Bullish Counter Attack Pattern do candlesticks par base hota hai. Is pattern ka pehla candlestick ek lambi bearish (red) candlestick hoti hai, jo market ke downward momentum ko indicate karti hai. Yeh candlestick market ke strong selling pressure ko darshati hai aur traders ko bearish trend ka signal deti hai. Is candlestick ke baad, ek second candlestick hoti hai jo bullish (green) hoti hai aur pehle candlestick ke body ko completely cover karti hai.

          Yeh second candlestick bullish reversal ka indicator hoti hai, kyunki iska body pehle candlestick ke body ko completely engulf karta hai. Is pattern ki confirmation tab hoti hai jab second candlestick ke closing price pehle candlestick ke closing price se higher hoti hai. Iska matlab hai ke buying pressure market mein increase ho raha hai aur bearish trend khatam ho raha hai.

          Pattern ke effectiveness ko confirm karne ke liye traders ko other technical indicators aur tools ka bhi istemal karna chahiye. Volume analysis, moving averages, aur momentum indicators is pattern ki validity ko test karne mein madadgar sabit ho sakte hain. Jab volume bhi increase hota hai aur market ki momentum positive hoti hai, to Bullish Counter Attack Pattern ki prediction zyada accurate hoti hai.

          Is pattern ko implement karte waqt risk management bhi zaroori hai. Stop-loss orders ko strategically place karke losses ko control kiya ja sakta hai agar market expected direction mein move nahi karti. Aik clear trading plan aur disciplined approach is pattern ke effectiveness ko enhance karte hain.

          Summary yeh hai ke Bullish Counter Attack Pattern aik significant trend reversal indicator hai jo bearish trend ke baad bullish trend ki potential shift ko signal karta hai. Is pattern ki sahi identification aur confirmation se traders market ke reversal points ko better samajh sakte hain aur apni trading strategies ko accordingly adjust kar sakte hain.

          اب آن لائن

          Working...
          X