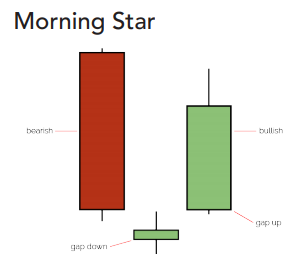
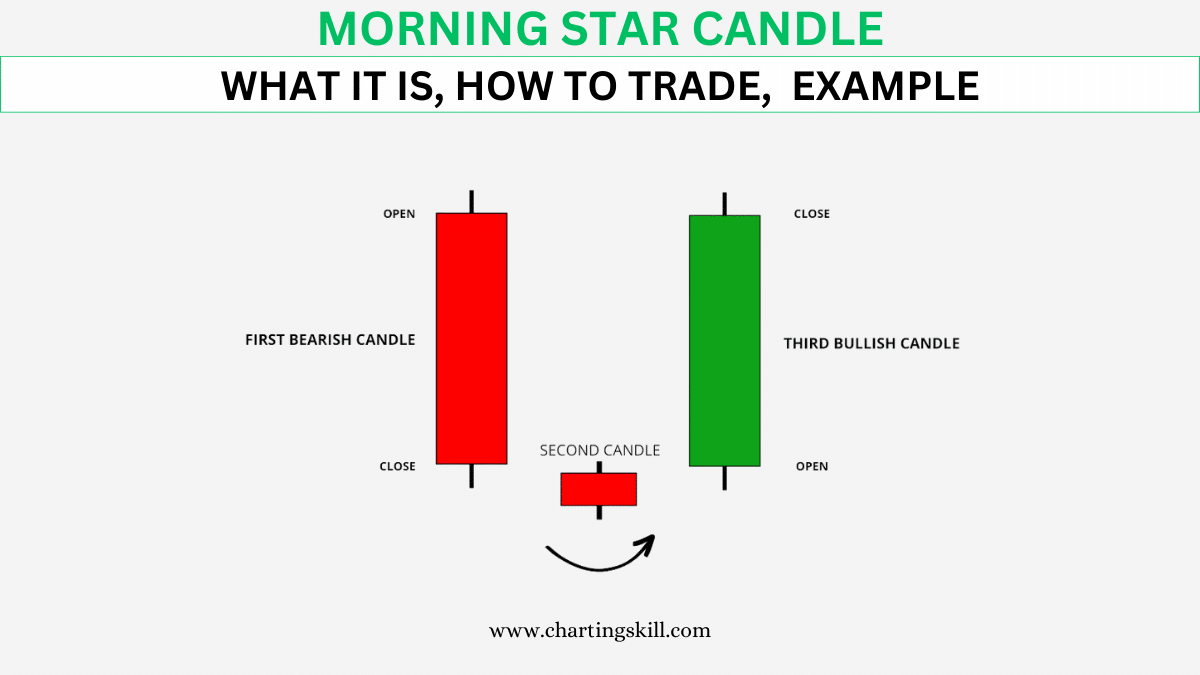
As we already know, candlestick analysis is a subtype of technical analysis. It is based on reading a chart that consists of a sequence of Japanese candlesticks. This is actually the oldest tool of price analysis. So, let’s make good use of this method to generate maximum profit in the financial markets.
Pattern analysis classification:
Single candlesticks patterns
Combination of candlesticks patterns
Single candlestick patterns
When reading a chart, we can see some patterns composed of single candlesticks that predict certain price movements. This is what we call a single candlestick pattern.
When working with different methods of technical analysis, we have found out that the higher time frame we use, the more comprehensive analysis we get. This means that a monthly chart is more crucial than a weekly chart, the latter is more important than the daily one, while a daily chart has a higher priority than an hourly chart.
The single candlestick pattern analysis is especially informative on higher time frames, that is, not lower than the daily one.
Main types of single candlestick patterns
Marubozu [Bald head] is a candlestick with a long body and small or no shadows. This pattern is formed during an active trading day full of events which results in a one-direction movement also known as momentum. When analyzing this pattern, traders can predict future price movements based on the direction of the drawn candlestick. There are some details to consider. Thus, if a long candlestick appears after several short candlesticks, this is an indication of a stronger movement.
Doji candlestick patterns are candlesticks with a small or no body and long shadows. This pattern may signal that there is no movement in the market or that the market uncertainty is high. It depends on the moment when this candlestick pattern was formed.
We can often find these patterns when analyzing the charts on М30, H1, and H4 time frames. In the Asia-Pacific session, trading volumes are usually low which results in a zero price movement and the formation of Doji candlesticks. Should we consider them at all? The answer is rather no than yes since this flat movement is caused by low trading volumes rather than by behavior of market participants.
Now let’s suppose that the Doji pattern appears during the European or New York session when the trading activity is usually high. You may ask why there is still no movement here. In this case, we are dealing with the actions of market participants who start hesitating under the pressure from the news background, thus forming the Doji pattern. As a result, the price may perform a sharp movement.
Let’s consider a situation when a Doji is formed on a lower time frame, for example, on the daily chart [D1]. In fact, the quote has been standing still for the whole day which indicates a temporary halt due to an unclear trend arising from market uncertainty rather than low trading volumes.
To sum it up, the formation of Doji candlesticks signals the state of indecision that may later result in a strong market movement. Thus, a proper reading of the patterns in combination with other technical tools may serve as additional support for trading.
Types of Doji candlesticks
Neutral Doji is a pattern with a small or no body and short shadows. It is a sign of sluggish market activity with low trading volumes.
Dragonfly Doji is a pattern with a small or no body and a long lower shadow. This pattern shows that the bullish trend was strong and buyers were able to push the price back to the initial point.
Gravestone Doji is a pattern with a small or no body and a long upper shadow. This pattern implies that the bearish trend is strong and sellers were able to reverse the price back to the initial point.
Long-legged Doji is a pattern with a small or almost no body and very long upper and lower shadows. The pattern shows indecision in the market and uncertain price direction.
Four-price Doji is a pattern where open, close, high, and low prices are equal. This is a rare pattern that reflects a low-liquid asset or a slow trading session. On Forex, you can come across this Doji pattern only if you switch to the M1 time frame. In all other cases, there will be at least some short shadows.


تبصرہ
Расширенный режим Обычный режим