Some tools of technical analysis may seem too complicated to beginners, so they avoid them in their day-to-day trading. But they’d better use them as these technical tools can be the key to successful trading. Among such effective technical indicators are Fibonacci retracement levels. In this lesson, we will take a close look at how to use Fibonacci levels when trading Joe DiNapoli style.
Let’s first meet the creator of this method, Joe DiNapoli. He is a prominent analyst and a professional trader who introduced his own trading system. His trading strategy features a combination of lagging and leading indicators which helps trace accurate signals.
The system is based on the well-known Fibonacci levels, or lines, which are used to predict the future direction of the price movement. However, the way DiNapoli applied these levels in his strategy was so unusual that later they were called DiNapoli levels and became very widespread.
Notably, such technical patterns as arcs and fans that are based on Fibonacci numbers are not applied in this strategy. Instead, the method uses only horizontal lines, or levels.
Let’s recap what Fibonacci levels are. This technical indicator is based on the Elliott Wave theory whose creator, Ralph Nelson Elliott, was the first one to notice repeating patterns in which markets are moving.
It is the ratio between Fibonacci numbers rather than the numbers themselves that is the basics of technical analysis. They help track the price changes in the market over time. Price targets derived from this method usually turn out to be the key support and resistance levels.
In general, DiNapoli levels can be viewed as these very support and resistance levels. Yet, this method is slightly different from a popular trading strategy that is based on key levels.
The main advantage of the DiNapoli strategy is that it allows a trader to get the most accurate signals and use them to enter the market.
In addition, this method is multifunctional as it is suitable both for intraday and medium-term trading. Besides, it can be applied to trading various currency pairs.
Now that you have a general understanding of this trading strategy, let’s learn how to draw DiNapoli levels on the chart. We need only three Fibo levels to do this: 38.2%, 50%, and 61.8%.
The lines are plotted on the chart by means of a standard tool - the Fibonacci grid. They can be built in any trading platform that features such an option. For this, choose the Fibonacci and Levels (Lines) section in the toolbar.
The placement of Fibo levels is generally done in two steps: 1. First, we need to determine the so-called market swing and a focus point. To do this, we need to define the current trend.
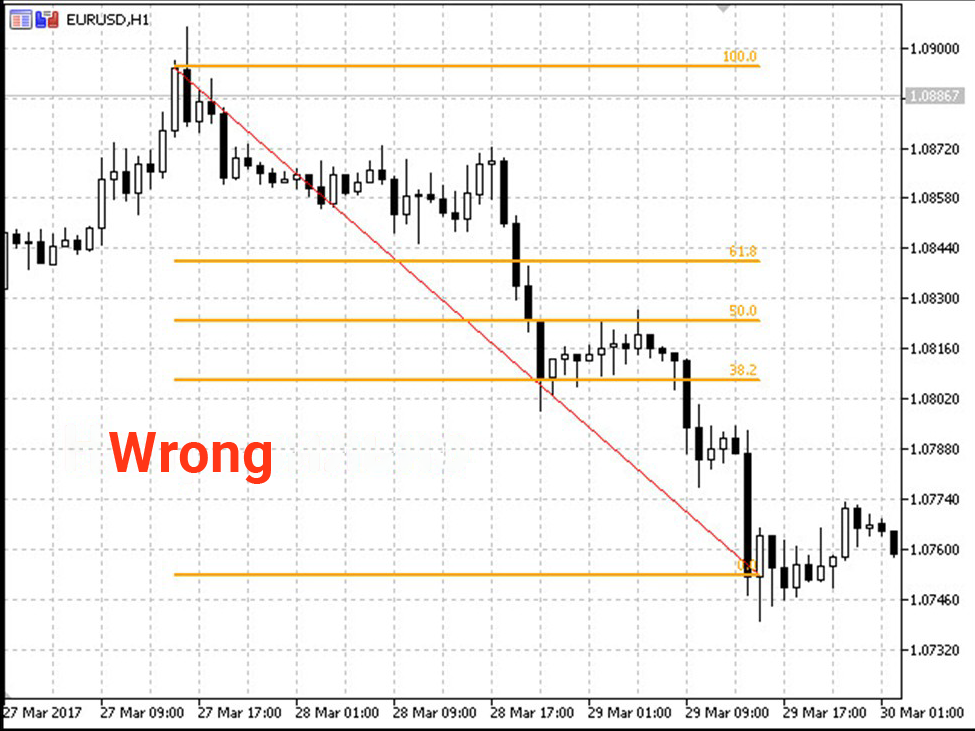
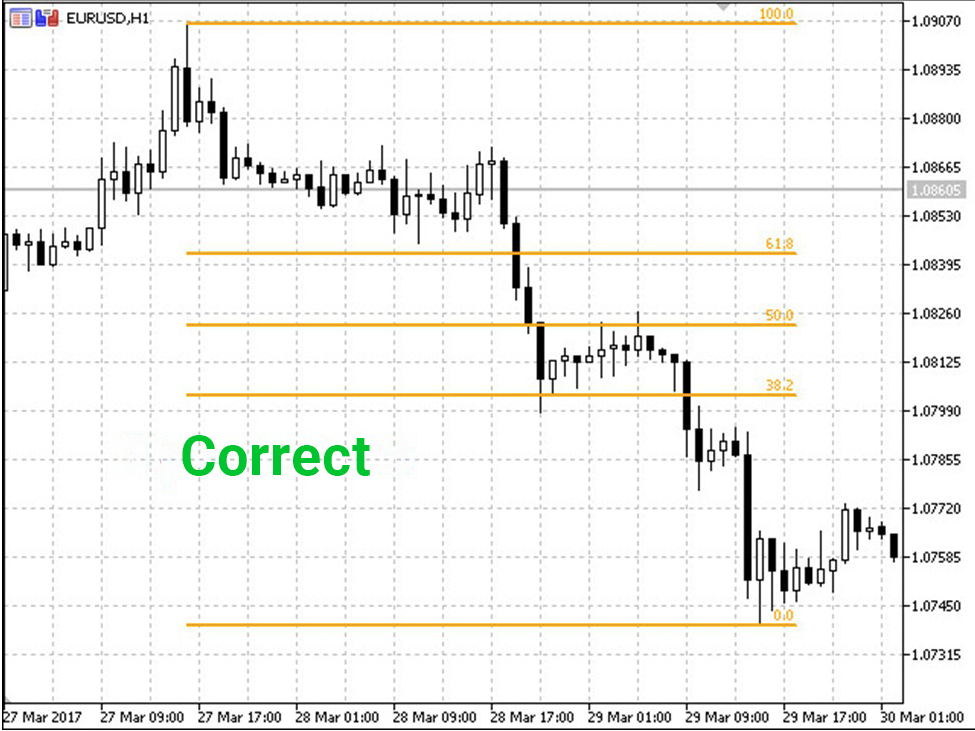
In case of a downtrend, the boundaries of the grid are placed from top to bottom. That is, you should stretch the grid from a local high to a local low of the price.
In case of an uptrend, the grid is placed from bottom to top. Hence, you stretch it from a local low to a local high of the price.
The distance between extreme points is called a market swing. If lines are plotted correctly, they should be arranged between 0% and 100% in the direction of the current trend.
The market swing always ends with a focus point which is followed by a correction, that is, a price movement in the opposite direction.
A price chart is constantly moving, so the market swing is changing together with the chart. As the market swing is expanding, the number of focus points on the chart is naturally increasing.
Therefore, several price corrections may appear in the center of a market swing. These corrections are called reactions and each of them has its own number.
So we have found out that a trend usually ends with a correction. In practice, these correctional pullbacks are not deep and hit the Fibonacci levels of support. As a rule, these levels are located within the range of 38.2%. In fewer cases, the pullback may extend to the levels of 50% and 61.8%.
As for the resistance level, it is a bit more difficult to determine since calculations should be used here. Oftentimes, the moment when the price reaches the resistance line is considered to be a signal for closing a trade. To define the resistance level, we should take into account such factors as volatility, trade volume, the overall strength of the trend, and other indicators.
Focus points are also important for determining Fibo knots, or accumulation of levels. Fibo knots are points on the chart where the correction movement ends. They serve as strong resistance levels that halt further price movements.
Fibo knots are derived from the Fibonacci grid stretched between two neighboring focus points and are used to find the best entry point. DiNapoli recommends working only with those knots that fall in the range between 38.2% and 61.8%. All other levels are considered insignificant.
Let’s first meet the creator of this method, Joe DiNapoli. He is a prominent analyst and a professional trader who introduced his own trading system. His trading strategy features a combination of lagging and leading indicators which helps trace accurate signals.
The system is based on the well-known Fibonacci levels, or lines, which are used to predict the future direction of the price movement. However, the way DiNapoli applied these levels in his strategy was so unusual that later they were called DiNapoli levels and became very widespread.
Notably, such technical patterns as arcs and fans that are based on Fibonacci numbers are not applied in this strategy. Instead, the method uses only horizontal lines, or levels.
Let’s recap what Fibonacci levels are. This technical indicator is based on the Elliott Wave theory whose creator, Ralph Nelson Elliott, was the first one to notice repeating patterns in which markets are moving.
It is the ratio between Fibonacci numbers rather than the numbers themselves that is the basics of technical analysis. They help track the price changes in the market over time. Price targets derived from this method usually turn out to be the key support and resistance levels.
In general, DiNapoli levels can be viewed as these very support and resistance levels. Yet, this method is slightly different from a popular trading strategy that is based on key levels.
The main advantage of the DiNapoli strategy is that it allows a trader to get the most accurate signals and use them to enter the market.
In addition, this method is multifunctional as it is suitable both for intraday and medium-term trading. Besides, it can be applied to trading various currency pairs.
Now that you have a general understanding of this trading strategy, let’s learn how to draw DiNapoli levels on the chart. We need only three Fibo levels to do this: 38.2%, 50%, and 61.8%.
The lines are plotted on the chart by means of a standard tool - the Fibonacci grid. They can be built in any trading platform that features such an option. For this, choose the Fibonacci and Levels (Lines) section in the toolbar.
The placement of Fibo levels is generally done in two steps: 1. First, we need to determine the so-called market swing and a focus point. To do this, we need to define the current trend.
In case of a downtrend, the boundaries of the grid are placed from top to bottom. That is, you should stretch the grid from a local high to a local low of the price.
In case of an uptrend, the grid is placed from bottom to top. Hence, you stretch it from a local low to a local high of the price.
The distance between extreme points is called a market swing. If lines are plotted correctly, they should be arranged between 0% and 100% in the direction of the current trend.
The market swing always ends with a focus point which is followed by a correction, that is, a price movement in the opposite direction.
A price chart is constantly moving, so the market swing is changing together with the chart. As the market swing is expanding, the number of focus points on the chart is naturally increasing.
Therefore, several price corrections may appear in the center of a market swing. These corrections are called reactions and each of them has its own number.
So we have found out that a trend usually ends with a correction. In practice, these correctional pullbacks are not deep and hit the Fibonacci levels of support. As a rule, these levels are located within the range of 38.2%. In fewer cases, the pullback may extend to the levels of 50% and 61.8%.
As for the resistance level, it is a bit more difficult to determine since calculations should be used here. Oftentimes, the moment when the price reaches the resistance line is considered to be a signal for closing a trade. To define the resistance level, we should take into account such factors as volatility, trade volume, the overall strength of the trend, and other indicators.
Focus points are also important for determining Fibo knots, or accumulation of levels. Fibo knots are points on the chart where the correction movement ends. They serve as strong resistance levels that halt further price movements.
Fibo knots are derived from the Fibonacci grid stretched between two neighboring focus points and are used to find the best entry point. DiNapoli recommends working only with those knots that fall in the range between 38.2% and 61.8%. All other levels are considered insignificant.
تبصرہ
Расширенный режим Обычный режим