Explain Commodity channel index Indicator (CCI)
X
  • وقت
  • دکھائیں
Clear All
new posts
  • #1 Collapse

    Explain Commodity channel index Indicator (CCI)
    Commodity channel index Indicator :

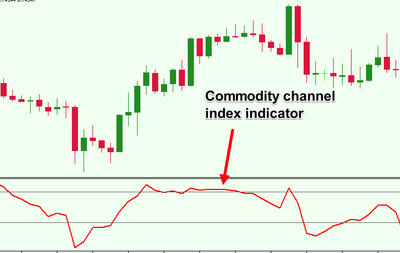
    Assalam o Alaikum Dear Friends and Fellows Commodity Channel Index (CCI) indicator ek popular technical analysis tool hy. Yeh price movements ko analyze karny ke liye istemal hota hy. CCI volatility aur overbought/oversold conditions ko identify karny me madad krta hy. Positive aur negative divergence ko bhi detect karny me helpful hota hy. CCI indicator -100 aur +100 ke beech oscillate krta hy. Jab CCI +100 se upar jata hy, toh overbought condition indicate krta hy aur jab -100 se neechy jata hy, toh oversold condition indicate krta hy. Traders CCI indicator ka istemal kar ke trading signals generate kar sakty hein.

    Click image for larger version

Name:	cci1.png
Views:	104
Size:	9.1 کلوبائٹ
ID:	12840526
    Overbought And Oversold Conditions
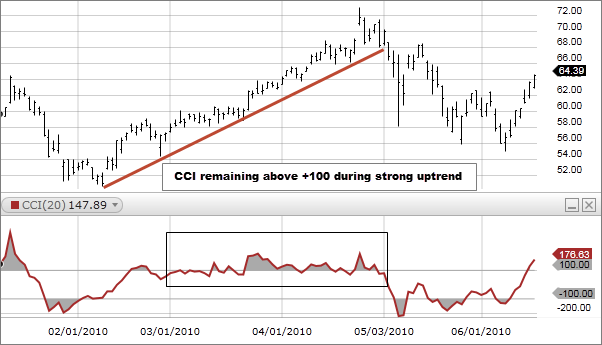
    Dear Fellows CCI +100 se zyada ho to ye market ko overbought indicate krta hy, jab ke CCI -100 se kam ho to ye market ko oversold indicate krta hy. Overbought condition me trend reversal ka chance hota hy aur oversold condition me trend change hone ka chance hota hy.

    Trading Signals
    CCI ko trading signals ke liye istemal kiya ja sakta hy: Buy Signals: Jab CCI -100 se upar se neechy aata hy aur phir upar direction me move krta hy. Sell Signals: Jab CCI +100 se neechy aata hy aur phir neechy direction me move krta hy.

    Click image for larger version

Name:	cci2.png
Views:	90
Size:	10.0 کلوبائٹ
ID:	12840527
    Divergence-Risk Management
    CCI ki madad se trader market me divergence detect kar sakty hein, jo trend reversal ki nishani ho sakti hy. CCI ko risk management me istemal kar ke trader apni stop-loss aur take-profit levels ko set kar sakty hein.

    CCI indicator Formula :
    CCI indicator ka formula yeh hy: CCI = (Typical Price - 20-period SMA of Typical Price) / (0.015 * Mean Deviation) Yaha "Typical Price" current candle ka average price hota hy, "SMA" simple moving average hy, aur "Mean Deviation" standard deviation ke average ko represent krta hy. Is formula ka istemal kar ke CCI indicator ka value calculate kiya jata hy.

  • <a href="https://www.instaforex.org/ru/?x=ruforum">InstaForex</a>
  • #2 Collapse

    Assalamu Alaikum Dosto!

    Commodity Channel Index (CCI) Indicator


    Commodity Channel Index (CCI) Indicator ek technical analysis ka tool hai jo traders aur investors use karte hain. CCI Indicator ko Donald Lambert ne develop kiya tha, jo ek technical analyst the. CCI Indicator ka use market trends aur price movements ko analyze karne ke liye kiya jata hai. Is tool ki madad se traders aur investors market ka direction aur momentum determine kar sakte hain.
    CCI Indicator ka use commodity trading ke liye kiya jata hai, lekin iska use stock market aur forex market mein bhi kiya jata hai. CCI Indicator ko calculate karne ke liye, ek specific formula ka use kiya jata hai jo market ke price movements aur volatility ke basis par work karta hai.
    CCI Indicator ka use trend determination aur oversold/overbought levels ke liye kiya jata hai. Agar CCI Indicator ke readings negative hote hain, toh market bearish trend mein hai aur agar CCI Indicator ke readings positive hote hain toh market bullish trend mein hai. CCI Indicator ke readings zero ke around fluctuate karte rehte hain, jo sideways trend ko indicate karte hain.


    CCI Indicator ki Calculation


    CCI Indicator ka calculation market ke price movements aur volatility ke basis par kiya jata hai. CCI Indicator ke calculation ke liye, kuch steps follow kiye jate hain jo neeche diye gaye hain:

    • Step 1:
      Calculate the Typical Price (TP) of the Commodity
      Typical Price (TP) ko calculate karne ke liye, commodity ka high, low aur close price ko add karke 3 se divide kiya jata hai. Yeh formula hai: (High + Low + Close) / 3.

    • Step 2:
      Calculate the Simple Moving Average (SMA) of the Commodity
      Simple Moving Average (SMA) ko calculate karne ke liye, commodity ke prices ka average calculate kiya jata hai. Yeh formula hai: SUM (TP) / n, jahan n price periods hai.

    • Step 3:
      Calculate the Mean Deviation (MD) of the Commodity
      Mean Deviation (MD) ko calculate karne ke liye, commodity ke prices ka deviation calculate kiya jata hai. Yeh formula hai: SUM (|TP - SMA|) / n, jahan n price periods hai.

    • Step 4:
      Calculate the Commodity Channel Index (CCI)
      Commodity Channel Index (CCI) ko calculate karne ke liye, is formula ka use kiya jata hai:
      CCI = (TP - SMA) / (0.015 x MD)


    CCI Indicator ke readings typically -100 se 100 ke beech fluctuate karte hain. Agar CCI Indicator ke readings +100 se zyada hote hain, toh commodity overbought level par hai aur agar CCI Indicator ke readings -100 se kam hote hain, toh commodity oversold level par hai.


    Commodity Channel Index (CCI) Indicator Strategies


    Commodity Channel Index (CCI) Indicator ek technical analysis tool hai jo traders aur investors market trends aur price movements analyze karne ke liye use karte hain. CCI Indicator ke readings market direction aur momentum determine karne mein help karte hain. Is tool ke readings typically -100 se 100 ke beech fluctuate karte hain aur oversold/overbought levels ke liye bhi use kiya jata hai.

    1. CCI Divergence Strategy:

      CCI Divergence Strategy ka use CCI Indicator ke divergence signals ke liye kiya jata hai. CCI Indicator ka use oversold/overbought levels ke determine karne ke liye kiya jata hai aur ismein bullish aur bearish divergence ka concept bhi hota hai. Agar market price new lows banata hai aur CCI Indicator new highs banata hai toh yeh bullish divergence hai aur agar market price new highs banata hai aur CCI Indicator new lows banata hai toh yeh bearish divergence hai.
      CCI Divergence Strategy mein traders bullish divergence ko buy signals aur bearish divergence ko sell signals ke roop mein use karte hain. Divergence signals mein ek confirmation indicator ki zaroorat hoti hai jaise ki trend lines ya price patterns.

    2. CCI Overbought/Oversold Strategy:

      CCI Indicator ka use oversold/overbought levels ke determine karne ke liye kiya jata hai. CCI Indicator ke readings typically -100 se 100 ke beech fluctuate karte hain aur -100 se kam readings oversold level aur +100 se zyada readings overbought level ko indicate karte hain. Is strategy mein traders oversold level par buy signals aur overbought level par sell signals ke roop mein CCI Indicator ka use karte hain.
      Agar CCI Indicator ke readings oversold level ke andar aate hain toh yeh indicate karta hai ki market bearish trend se bahar aa sakta hai aur reversal hone ke chances hote hain. Agar CCI Indicator ke readings overbought level ke andar aate hain toh yeh indicate karta hai ki market bullish trend se bahar aa sakta hai aur reversal hone ke chances hote hain.

    3. CCI Trend Strategy:

      CCI Trend Strategy ka use CCI Indicator ke readings ke trend determination ke liye kiya jata hai. CCI Indicator ke readings negative hote hain toh market bearish trend mein hota hai aur readings positive hote hain toh market bullish trend mein hota hai. Is strategy mein traders CCI Indicator ke readings ke trend determination ke liye use karte hain aur trend ke hisaab se buy/sell signals generate karte hain.
      Agar CCI Indicator ke readings positive hote hain toh traders long positions (buy) par jate hain aur agar CCI Indicator ke readings negative hote hain toh traders short positions (sell) par jate hain. Trend determination ke liye CCI Indicator ke readings ke saath saath price patterns aur moving averages jaise confirmation indicators bhi use kiye jate hain.

    4. CCI Retracement Strategy:

      CCI Retracements Trading Technique mein traders price retracement ke signals ke liye CCI Indicator ka use karte hain. Jab market trend mein hai aur price retracement ke baad phir se trend ke hisaab se move karta hai toh traders CCI Indicator ka use price retracement ke levels ko determine karne ke liye karte hain. Price retracement ke levels CCI Indicator ke readings ke saath saath Fibonacci retracement levels se bhi match karte hain.
      CCI Retracements Trading Technique mein traders CCI Indicator ke readings ke saath price retracement ke levels ko determine karte hain aur phir trend ke hisaab se buy/sell signals generate karte hain. Is technique mein traders price patterns aur moving averages jaise confirmation indicators bhi use karte hain.

    5. CCI Breakout Trading Technique:

      CCI Breakout Trading Technique mein traders price breakout ke signals ke liye CCI Indicator ka use karte hain. Jab market price ki volatility badhti hai aur price support ya resistance levels ko break karta hai toh yeh breakout signal generate karta hai. Is technique mein traders CCI Indicator ke readings ko bhi dekhte hain jissey ki yeh confirm kiya ja sakta hai ki breakout valid hai ya nahi.
      CCI Indicator ke readings oversold/overbought levels ko indicate karte hain. Agar market price breakout ke sath oversold/overbought levels ke andar aata hai toh yeh confirm karta hai ki breakout signal strong hai. Breakout signals ke saath saath traders price patterns aur moving averages jaise confirmation indicators bhi use karte hain.

    6. CCI Trendline Break Trading Technique:

      CCI Trendline Break Trading Technique mein traders trendline break ke signals ke liye CCI Indicator ka use karte hain. Jab market price trendline ko break karta hai toh yeh trendline break signal generate karta hai. Is technique mein traders CCI Indicator ke readings ko bhi dekhte hain jissey ki yeh confirm kiya ja sakta hai ki trendline break signal strong hai.
      CCI Trendline Break Trading Technique mein traders trendline break ke saath saath price patterns aur moving averages jaise confirmation indicators bhi use karte hain. Trendline break signals ke baad traders trend ke hisaab se buy/sell signals generate karte hain.

    7. CCI Moving Average Trading Technique:

      CCI Moving Average Trading Technique mein traders CCI Indicator ke readings ke saath moving averages ka use karte hain. Is technique mein traders moving averages ke crossover ke signals ke liye CCI Indicator ka use karte hain. Agar moving averages ka crossover CCI Indicator ke readings ke saath match karta hai toh yeh crossover signal strong hota hai.
      CCI Moving Average Trading Technique mein traders CCI Indicator ke readings ke saath saath price patterns aur other technical indicators jaise ki Bollinger Bands aur MACD bhi use karte hain. Crossover signals ke baad traders trend ke hisaab se buy/sell signals generate karte hain.

    8. Support/Resistance Levels:

      CCI Indicator ke readings support aur resistance levels ko bhi indicate karte hain. Agar market price support ya resistance level pe hai toh traders CCI Indicator ke readings ke saath saath price action aur other technical indicators ka use karke buy/sell signals generate karte hain.


    Trading


    CCI Indicator ke readings ke saath traders apne trades ki entry, exit, take profit aur stop loss k positions determine karte hain. Traders CCI Indicator ke readings ke saath price action aur other technical indicators ka use karke apne trades ko manage karte hain. CCI Indicator traders ke liye ek powerful tool hai jiske use se traders apne trading strategies ko improve kar sakte hain.

    1. Entry:

      CCI Indicator ke readings ke saath traders apne trades ki entry points determine karte hain. Agar CCI Indicator ke readings positive hai aur market bullish trend mein hai toh traders buy signal generate karte hain aur trade enter karte hain. Agar CCI Indicator ke readings negative hai aur market bearish trend mein hai toh traders sell signal generate karte hain aur trade enter karte hain.

    2. Exit:

      CCI Indicator ke readings ke saath traders apne trades ki exit points determine karte hain. Traders apne trades ko exit karte hain jab CCI Indicator ke readings opposite direction mein move karte hain. Agar traders buy position mein hain aur CCI Indicator ke readings negative ho jate hain toh traders apna position exit karte hain. Agar traders sell position mein hain aur CCI Indicator ke readings positive ho jate hain toh traders apna position exit karte hain.

    3. Take Profit:

      Take profit ek level hai jahan traders apne trades ko close karte hain aur profit book karte hain. CCI Indicator ke readings ke saath traders take profit level determine karte hain. Agar traders buy position mein hain aur CCI Indicator ke readings oversold level pe hai toh traders take profit level ko yaha pe set karte hain. Agar traders sell position mein hain aur CCI Indicator ke readings overbought level pe hai toh traders take profit level ko yaha pe set karte hain.

    4. Stop Loss:

      Stop loss ek level hai jahan traders apne trades ko close karte hain aur apni losses ko control karte hain. CCI Indicator ke readings ke saath traders stop loss level determine karte hain. Agar traders buy position mein hain aur CCI Indicator ke readings negative ho jate hain toh traders stop loss level ko yaha pe set karte hain. Agar traders sell position mein hain aur CCI Indicator ke readings positive ho jate hain toh traders stop loss level ko yaha pe set karte hain.

    • #3 Collapse

      Explain commodity channel index indicator (cci)

      Title: "Commodity Channel Index (CCI): Ek Taaruf Roman Urdu Mein"

      Commodity Channel Index (CCI) ek technical analysis indicator hai jo market trends aur price movements ko evaluate karne ke liye istemal hota hai. Yah indicator 1980 mein Donald Lambert ne tashkeel diya tha aur isay traders aur investors ke darmiyan aapas ki taqat-o-tawanaiyan samajhne ke liye banaya gaya tha.

      CCI ka maqsad hota hai market mein hone wale abnormal price movements ko nazar andaaz karna, taki traders ko pata chal sake ke market overbought ya oversold hai. CCI market volatility aur trend ki strength ko measure karta hai.

      CCI Kaise Kaam Karta Hai:

      CCI ka calculation price, moving average aur ek constant factor par mabni hota hai. Yeh formula istemal hota hai:

      ���=(������������−���0.015×�������������)CCI=(0.01 5×MeanDeviationTypicalPrice−SMA​)

      Yahan,
      • ������������TypicalPrice ek security ka average price hota hai, jo close, high, aur low prices ka average hota hai.
      • ���SMA Simple Moving Average hota hai, jo kisi specific period ke closing prices ka average hota hai.
      • �������������MeanDeviation prices ka deviation hota hai jo SMA se hota hai.

      CCI ke values +100 aur -100 ke aas-pass fluctuate karte hain. Positive values ka matlab hota hai ke market overbought hai, jabke negative values indicate karte hain ke market oversold hai. Jab CCI +100 se zyada ya -100 se kam hojata hai, toh yeh indicate karta hai ke trend shuru hone wala hai.

      CCI Ke Istemal Ke Tareeqay:
      1. Overbought aur Oversold Conditions Ka Pata Lagana:
        • Agar CCI +100 ke upar jaata hai, toh market overbought ho sakti hai aur yeh indicate karta hai ke prices ne zyada tezi se barhna shuru kar diya hai.
        • Agar CCI -100 ke neeche jaata hai, toh market oversold ho sakti hai aur yeh indicate karta hai ke prices ne zyada tezi se girna shuru kar diya hai.
      2. Divergence Ke Zariye Trend Ki Peshan Goi:
        • CCI ki values aur price movements ke darmiyan farq ko dekhte hue traders trend ki strength ko samajh sakte hain. Agar CCI aur price mein mukhtalif direction ka trend hai, toh yeh divergence ka tajzia kar ke future price movements ka andaza lagaya ja sakta hai.
      3. CCI Ke Sath Dusre Indicators Ka Istemal:
        • Traders CCI ko dusre indicators ke saath combine kar ke market analysis karte hain, jaise ke Moving Averages aur Relative Strength Index (RSI).

      Ikhtitami Alfaz:

      CCI ek powerful tool hai jo market trends aur price movements ko analyze karne mein madad karta hai. Traders ko iska sahi istemal karke market ki peshan goi aur future price movements ka andaza lagane mein madad milti hai. Lekin, yaad rahe ke har ek indicator ki tarah, CCI bhi khud ko validate karne ke liye dusre indicators aur tools ke saath istemal karna zaroori hai.
      • #4 Collapse

        1. Introduction:

        Commodity Channel Index (CCI) ek technical analysis indicator hai jo traders aur investors ke liye market ki harkaton ko samajhne aur trading decisions lene mein madad deta hai. CCI ka istemal price movements aur market volatility ko analyze karne ke liye kiya jata hai. Is indicator ka istemal short-term aur long-term trading strategies mein kiya jata hai. CCI ki calculation ke liye mukhtalif parameters aur formulas istemal kiye jate hain jo market ki harkaton ko measure karne mein madadgar hote hain.

        CCI ke introduction mein shamil hona zaroori hai taake readers ko indicator ki basic understanding ho. Ismein traders aur investors ke darmiyan ek bridge banna chahiye, jo unhein market ki complexities ko samajhne mein madad kare.

        2. Formation:

        CCI ka formation mukhtalif muddaton (commonly 20 ya 14) ke closing prices aur unka average istemal karta hai. Iske baad, ek mukhtalif multiplier apply kiya jata hai taki ek normalized oscillator hasil kiya ja sake. CCI ke values usually +100 aur -100 ke darmiyan hoti hain. Iske zariye, market ki overbought ya oversold conditions ko identify kiya jata hai.

        Formation ke section mein CCI ka calculation process aur uske mukhtalif elements ko explain kiya jata hai. Ismein indicator ke mathematical aspects ko samjhaya jata hai taake readers ko indicator ki inner workings ka pata chale.

        3. Feature:

        CCI ka ek prominent feature yeh hai ke yeh ek normalized oscillator hai jo market ki harkaton ko measure karta hai. Iska istemal kar ke traders market ki volatility ko samajh sakte hain aur overbought ya oversold conditions ko identify kar sakte hain. CCI versatile bhi hai aur mukhtalif trading strategies ke sath istemal kiya ja sakta hai.

        Feature ke section mein CCI ka unique selling proposition (USP) aur iske key characteristics ko highlight kiya jata hai. Ismein indicator ke flexibility aur adaptability ki baat kari jati hai taki readers ko indicator ke potential benefits ka pata chale.

        Dynamic Nature:

        CCI ka dynamic nature isse ek mufeed indicator banata hai. Iske values constantly changing rehti hain market ki harkaton ke mutabiq. Iske dynamic nature ki wajah se traders market ke mukhtalif scenarios ko analyze kar sakte hain aur sahi waqt par trading decisions le sakte hain.

        Dynamic nature ke section mein CCI ka dynamic behavior aur iska practical implication discuss kiya jata hai. Ismein indicator ke dynamic nature ke faide aur challenges ko explore kiya jata hai taki readers ko indicator ke real-time applications ka pata chale.

        Click image for larger version

Name:	download (31).png
Views:	58
Size:	6.6 کلوبائٹ
ID:	12840577

        4. Significance:

        CCI ka istemal kar ke traders market ki harkaton ko samajh sakte hain aur sahi waqt par entry aur exit points tay kar sakte hain. Is indicator ke signals ko confirm karne ke liye traders mukhtalif technical analysis tools ka istemal karte hain. CCI ki significance yeh hai ke iske signals traders ko market trends aur potential reversals ke bare mein maloomat faraham karte hain.

        Significance ke section mein CCI ka importance aur iske impact ko explore kiya jata hai. Ismein traders aur investors ke liye CCI ke signals ka relevance aur significance ko highlight kiya jata hai taki readers ko indicator ke value proposition ka pata chale.

        Volatility Measurement:

        CCI ka primary purpose market ki volatility ko measure karna hai. Isse traders ko pata chalta hai ke market kitni active hai aur kis direction mein move kar rahi hai. Volatility measurement ke zariye traders apne trading strategies ko adjust karte hain aur market ki harkaton ko samajhte hain.

        Volatility measurement ke section mein CCI ka role market ki volatility ko samajhne mein aur uski implications ko samajhne mein discuss kiya jata hai. Ismein volatility measurement ke significance aur iska impact trading decisions par kaise hota hai, uspar light dala jata hai.

        5. Confirmatory Signals:

        CCI ke signals ko confirm karne ke liye traders mukhtalif technical analysis tools ka istemal karte hain. Inmein se kuch important tools hain:

        Moving Averages: Moving averages CCI ke signals ko confirm karne ke liye commonly istemal ki jati hain. Traders moving averages ka istemal kar ke CCI ke signals ko validate karte hain aur trading decisions lete hain.

        Trend Lines: Trend lines bhi CCI ke signals ko confirm karne aur validate karne mein madadgar hoti hain. Traders trend lines ka istemal kar ke market trends ko identify karte hain aur CCI ke signals ko confirm karte hain.

        Support/Resistance Levels: CCI ke signals ko confirm karne ke liye traders support aur resistance levels ka bhi istemal karte hain. Support aur resistance levels CCI ke signals ko validate karne mein madadgar sabit hote hain.

        Confirmatory signals ke section mein CCI ke signals ko validate karne ke liye mukhtalif technical tools ka istemal ko explore kiya jata hai. Ismein confirmatory signals ki importance aur unka role trading decisions mein discuss kiya jata hai.

        6. Tips:

        CCI indicator ka istemal karne se pehle traders ko kuch tips ka khayal rakhna chahiye:

        Practice: CCI indicator ka istemal karne se pehle traders ko practice karna chahiye taki woh iska sahi istemal kar sakein. Practice karne se traders ko indicator ki sensitivity aur functionality samajh mein aati hai.

        Combine with Other Tools: CCI ke signals ko confirm karne ke liye traders doosri technical analysis tools ke saath combine karna chahiye. Isse traders ko sahi aur reliable signals milte hain.

        Adjust Sensitivity: CCI ki sensitivity ko adjust karte waqt market ki current volatility ka bhi khayal rakhna chahiye. Isse traders ko accurate signals milte hain aur unhein sahi trading decisions lene mein madad milti hai.

        Tips ke section mein traders ke liye helpful suggestions diye jate hain jinhein woh CCI indicator ka istemal karne mein madadgar payenge. Ismein beginners aur experienced traders ke liye customized tips diye jate hain taki woh indicator ko sahi tareeqe se istemal kar sakein.

        7. Uses:

        CCI indicator ko tijarati analysis ke liye istemal kiya jata hai. Traders iska istemal kar ke market ki harkaton ko samajhte hain aur trading decisions lete hain. Iske alawa, CCI indicator ko trend identification aur trend reversals ko samajhne ke liye bhi istemal kiya jata hai.

        Uses ke section mein CCI indicator ke versatile applications aur uske practical uses ko explore kiya jata hai. Ismein CCI ke uses ko different trading scenarios mein apply karne ka tareeqa aur unka impact trading performance par discuss kiya jata hai.

        Market Analysis: CCI indicator ka istemal kar ke traders market ki harkaton ko samajh sakte hain aur sahi waqt par trading decisions le sakte hain. Is indicator ko istemal kar ke traders market trends aur potential reversals ko identify karte hain.

        Market analysis ke section mein CCI ke role ko market analysis mein samjhaya jata hai. Ismein CCI ka contribution market analysis mein aur uska impact trading decisions par kaise hota hai, uspar light dala jata hai.

        8. Analysis:

        CCI indicator ki analysis ke doran traders market ki mukhtalif harkaton ko dekhte hain jaise ke overbought aur oversold levels, trend reversals, aur price momentum. Iske signals ko confirm karne ke liye traders doosri technical analysis tools ka bhi istemal karte hain.

        Analysis ke section mein CCI indicator ki in-depth analysis ki jati hai. Ismein traders ke liye useful insights aur actionable recommendations diye jate hain taki woh indicator ke signals ko sahi tareeqe se interpret kar sakein.

        Overbought/Oversold Levels: CCI ke analysis ke doran traders overbought aur oversold levels ko dekhte hain. Overbought conditions mein market ki prices neeche aane ki ummeed hoti hai jabke oversold conditions mein prices upar jaane ki ummeed hoti hai.

        Overbought/Oversold levels ke section mein CCI ke readings ko interpret karne ka tareeqa aur unke practical implications ko samjhaya jata hai. Ismein overbought aur oversold levels ke significance aur trading decisions par unka kya impact hota hai, uspar baat ki jati hai.

        Trend Reversals: CCI ke signals ko analyze kar ke traders trend reversals ko samajhte hain. Isse unhein pata chalta hai ke market ka trend kis direction mein change hone wala hai aur woh apne trading positions ko us change ke mutabiq adjust karte hain.

        Trend reversals ke section mein CCI ke role ko trend identification aur reversal patterns ke analysis mein explore kiya jata hai. Ismein trend reversals ke potential indicators aur unke practical applications ko samjhaya jata hai taki traders ko market ke potential turning points ka pata chale.

        Price Momentum: CCI indicator ki analysis ke doran traders price momentum ko bhi dekhte hain. Price momentum ke analysis se traders ko pata chalta hai ke market mein buying pressure ya selling pressure kitna hai. Isse unhein market ke current direction ka pata chalta hai aur woh sahi waqt par entry ya exit points tay karte hain.

        Price momentum ke section mein CCI ke readings ke correlation ko price momentum ke saath explain kiya jata hai. Ismein price momentum ki importance aur iska impact trading decisions par kaise hota hai, uspar discussion kiya jata hai.

        9. Types:

        CCI indicator ke mukhtalif types hote hain jo traders ke liye useful hote hain. Kuch important types include:

        CCI (20): CCI (20) type me, 20-day ka time frame istemal hota hai jisme traders 20-day ke closing prices aur unka average calculate karte hain. Is type me traders long-term trends ko analyze karte hain.

        CCI (14): CCI (14) type me, 14-day ka time frame istemal hota hai jisme traders 14-day ke closing prices aur unka average calculate karte hain. Is type me traders short-term trends ko analyze karte hain.

        CCI (50): CCI (50) type me, 50-day ka time frame istemal hota hai jisme traders 50-day ke closing prices aur unka average calculate karte hain. Is type me traders medium-term trends ko analyze karte hain.

        Types ke section mein mukhtalif CCI types ko explain kiya jata hai aur unke specific use cases ko discuss kiya jata hai. Ismein traders ke liye mukhtalif types ka comparison aur unke practical applications ka tareeqa bataya jata hai taki woh apne trading strategies ko customize kar sakein.

        10. Importance:

        CCI indicator ka istemal kar ke traders market ki harkaton ko samajh kar sahi waqt par entry aur exit points tay karte hain. Iska istemal karne se traders apni trading strategies ko improve kar sakte hain aur market ki mukhtalif scenarios ko samajhne mein maharat hasil kar sakte hain.

        Importance ke section mein CCI ke importance ko highlight kiya jata hai aur iska role traders ke trading journey mein kya hota hai, uspar baat ki jati hai. Ismein traders ke liye CCI indicator ke significance aur uska impact trading performance par discuss kiya jata hai.

        Trend Identification: CCI indicator traders ko market trends ko identify karne mein madad deta hai. Isse unhein pata chalta hai ke market ka trend kis direction mein ja raha hai aur woh apne trading strategies ko us direction ke mutabiq adjust karte hain.

        Trend identification ke section mein CCI ke readings ke correlation ko market trends ke saath explain kiya jata hai. Ismein trend identification ke importance aur uska impact trading decisions par kaise hota hai, uspar discussion kiya jata hai.

        Reversal Signals: CCI ke signals traders ko trend reversals ke bare mein maloomat faraham karte hain. Isse unhein pata chalta hai ke market ka trend kis direction mein change hone wala hai aur woh apne trading positions ko us change ke mutabiq adjust karte hain.

        Reversal signals ke section mein CCI ke readings ke correlation ko trend reversals ke saath explain kiya jata hai. Ismein reversal signals ke identification aur unke practical applications ko samjhaya jata hai taki traders ko market ke potential turning points ka pata chale.

        11. Pros and Cons:

        Pros:
        • CCI indicator market ki harkaton ko samajhne aur trading decisions lene mein madad deta hai.
        • Iska istemal kar ke traders apni trading strategies ko improve kar sakte hain aur market ki mukhtalif scenarios ko samajh sakte hain.

        Cons:
        • False Signals: CCI ke signals kabhi kabar false ho sakte hain jinse traders ko nuqsaan ho sakta hai.
        • Technical Knowledge Required: Iska istemal karne ke liye traders ko thori technical knowledge aur experience ki zaroorat hoti hai.

        Pros and cons ke section mein CCI ke strengths aur weaknesses ko explore kiya jata hai. Ismein indicator ke potential benefits aur challenges par focus kiya jata hai taki traders ko indicator ke istemal ke potential implications ka pata chale.

        12. Conclusion:

        CCI indicator tijarati analysis mein ek ahem tool hai jo traders ko market ki harkaton ko samajhne aur sahi waqt par trading decisions lene mein madad deta hai. Iska istemal karne ke liye traders ko thori practice aur technical knowledge ki zaroorat hoti hai lekin agar sahi tareeqe se istemal kiya jaye to yeh ek mufeed aur asar aawar tool sabit ho sakta hai. Traders ko CCI ke signals ko sahi tareeqe se analyze aur confirm karna chahiye taki woh market mein safalta hasil kar sakein.
        • #5 Collapse

          Explain Commodity channel index Indicator (CCI)


          CCI Kya Hai?

          Commodity Channel Index (CCI) ek technical indicator hai jo market volatility aur price movements ko measure karne ke liye istemal hota hai. Donald Lambert ne 1980 mein CCI ko develop kiya tha, aur ye indicator initially commodities market ke liye design kiya gaya tha. Lekin ab iska istemal stocks, currencies, aur other financial instruments ke trading mein bhi hota hai.


          Click image for larger version

Name:	k20.png
Views:	61
Size:	8.6 کلوبائٹ
ID:	12840605

          CCI Ka Maqsad

          CCI ka maqsad market volatility aur price trends ko determine karna hai. Ye indicator traders ko overbought aur oversold conditions ko identify karne mein madad karta hai. Iske zariye, traders market ke reversals ko anticipate kar sakte hain aur trading decisions ko support kar sakte hain.

          CCI Ka Tashkeel

          CCI ka tashkeel price movements ke zariye hota hai. Iske calculation mein kuch mukhtalif steps shamil hote hain, lekin asal formula ye hai:

          CCI = (Typical Price - SMA) / (0.015 * Mean Deviation)

          Yahan, kuch key terms hain:
          • Typical Price (TP): Ye price ka average hota hai jo high, low, aur close prices ka average hota hai.
          • SMA (Simple Moving Average): SMA ek specific number of periods ke price ka average hota hai.
          • Mean Deviation: Ye average deviation hota hai jo har ek period ke average price se calculate kiya jata hai.

          CCI usually ek range mein hota hai jo typically -100 se 100 tak hota hai. Positive values indicate strong uptrends aur negative values indicate strong downtrends. -100 aur +100 levels ko typically overbought aur oversold zones ke tor par interpret kiya jata hai.

          CCI Ka Istemal

          CCI ka istemal market trends aur potential reversals ko identify karne ke liye hota hai. Yahan kuch key points hain jinhe traders CCI ke istemal mein dhyan rakhte hain:
          1. Overbought aur Oversold Conditions: CCI overbought aur oversold conditions ko detect karne mein madad karta hai. Agar CCI +100 se ooper jaata hai, toh ye indicate karta hai ke market overbought ho sakta hai aur reversal ki possibility hai. Agar CCI -100 se neeche jaata hai, toh ye indicate karta hai ke market oversold ho sakta hai aur reversal ki possibility hai.
          2. Divergence: CCI divergence bhi ek important signal hai. Agar price ek direction mein ja rahi hai aur CCI opposite direction mein ja raha hai, toh ye divergence signal ho sakta hai. Ye divergence indicate karta hai ke current trend ki weakness ho sakti hai aur potential reversal ho sakta hai.
          3. Trend Identification: CCI ke zariye traders market trends ko identify kar sakte hain. Positive CCI values uptrends ko indicate karte hain jabke negative values downtrends ko indicate karte hain.
          4. Confirmation with Other Indicators: Traders CCI ko doosre technical indicators ke saath istemal karte hain taake unki analysis ko confirm kiya ja sake. Is tarah se, multiple indicators ki madad se more reliable trading decisions liye ja sakte hain.

          CCI Ke Fayde aur Nuksan

          CCI ke istemal ke kuch fayde aur nuksan hain:

          Fayde:
          • Market trends aur reversals ko identify karne mein madad karta hai.
          • Overbought aur oversold conditions ko detect karne mein madad karta hai.
          • Divergence aur trend strength ko analyze karne mein madad karta hai.

          Nuksan:
          • False signals ka khatra hota hai, khaaskar choppy markets mein.
          • Sirf ek indicator ke istemal par depend karna risky ho sakta hai.

          Nateeja

          Commodity Channel Index (CCI) ek important technical indicator hai jo market volatility aur price movements ko analyze karne mein madad karta hai. Iska istemal traders ke liye ek powerful tool ho sakta hai, lekin hamesha yaad rakha jana chahiye ke har ek indicator ki tarah, CCI bhi perfect nahi hai aur false signals ka khatra hota hai. Isliye, sahi risk management aur doosre indicators ke saath CCI ka istemal kiya jana chahiye taake more accurate trading decisions liye ja sakein.
          • #6 Collapse

            Explain Commodity channel index Indicator (CCI)
            Commodity channel index Indicator :

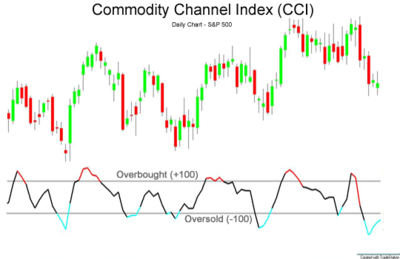
            Assalam o Alaikum Dear Friends and Fellows Commodity Channel Index (CCI) indicator ek popular technical analysis tool hy. Yeh price movements ko analyze karny ke liye istemal hota hy. CCI volatility aur overbought/oversold conditions ko identify karny me madad krta hy. Positive aur negative divergence ko bhi detect karny me helpful hota hy. CCI indicator -100 aur +100 ke beech oscillate krta hy. Jab CCI +100 se upar jata hy, toh overbought condition indicate krta hy aur jab -100 se neechy jata hy, toh oversold condition indicate krta hy. Traders CCI indicator ka istemal kar ke trading signals generate kar sakty hein.

            Click image for larger version  Name:	cci1.png Views:	9 Size:	9.1 KB ID:	12840526
            Overbought And Oversold Conditions
            Dear Fellows CCI +100 se zyada ho to ye market ko overbought indicate krta hy, jab ke CCI -100 se kam ho to ye market ko oversold indicate krta hy. Overbought condition me trend reversal ka chance hota hy aur oversold condition me trend change hone ka chance hota hy.

            Trading Signals
            CCI ko trading signals ke liye istemal kiya ja sakta hy: Buy Signals: Jab CCI -100 se upar se neechy aata hy aur phir upar direction me move krta hy. Sell Signals: Jab CCI +100 se neechy aata hy aur phir neechy direction me move krta hy.

            Click image for larger version  Name:	cci2.png Views:	7 Size:	10.0 KB ID:	12840527
            Divergence-Risk Management
            CCI ki madad se trader market me divergence detect kar sakty hein, jo trend reversal ki nishani ho sakti hy. CCI ko risk management me istemal kar ke trader apni stop-loss aur take-profit levels ko set kar sakty hein.

            CCI indicator Formula :
            CCI indicator ka formula yeh hy: CCI = (Typical Price - 20-period SMA of Typical Price) / (0.015 * Mean Deviation) Yaha "Typical Price" current candle ka average price hota hy, "SMA" simple moving average hy, aur "Mean Deviation" standard deviation ke average ko represent krta hy. Is formula ka istemal kar ke CCI indicator ka value calculate kiya jata hy.
            • #7 Collapse

              Explain Commodity channel index Indicator (CCI)


              Click image for larger version

Name:	download (22).png
Views:	57
Size:	6.6 کلوبائٹ
ID:	12841274


              Commodity Channel Index (CCI) ek technical analysis indicator hai jo market trends aur potential overbought ya oversold conditions ko samajhne mein madad karta hai. Yeh indicator Donald Lambert ne 1980s mein banaya tha. CCI ka istemal stocks, commodities, currencies, aur indices mein kiya jata hai.

              Commodity Channel Index (CCI) ka tafseeli bayan:
              1. Formula: CCI ka calculation price changes ke basis par hota hai. Yeh formula hota hai: ���=(������������−20−���������)(0.015∗������������ �)CCI=(0.015∗MeanDeviation)(TypicalPrice−20−period SMA)​
                • Typical Price: (High + Low + Close) / 3
                • SMA: Simple Moving Average
                • Mean Deviation: Mean absolute deviation of the Typical Price from its SMA over a specified period.
              2. Interpretation:
                • Positive Values: Agar CCI positive hai, toh yeh indicate karta hai ke current price average se zyada hai, aur iska matlab ho sakta hai ke market overbought hai.
                • Negative Values: Agar CCI negative hai, toh yeh indicate karta hai ke current price average se kam hai, aur iska matlab ho sakta hai ke market oversold hai.
              3. Levels:
                • Traders CCI ko readings ke basis par interpret karte hain. Typical levels include +100 aur -100.
                • +100 ke upar ka reading overbought conditions ko indicate kar sakti hai.
                • -100 ke neeche ka reading oversold conditions ko darust kar sakta hai.
              4. Divergence aur Convergence:
                • CCI ki readings ke saath divergence aur convergence ka analysis kiya jata hai. Agar price aur CCI mein kisi bhi tarah ka mismatch hai, toh isse trend reversal ka sign mil sakta hai.
              5. Volatility Indicator:
                • CCI volatility ko bhi measure karta hai. Agar CCI zyada fluctuate kar raha hai, toh iska matlb hai ke market mein zyada volatility hai.

              CCI ka Istemal:
              • Overbought aur oversold conditions ko samajhne ke liye.
              • Potential trend reversals ka pata lagane ke liye.
              • Divergence aur convergence ka analysis kar ke trend strength ko samajhne ke liye.

              CCI ek versatile indicator hai, lekin iske istemal se pehle market conditions aur doosre technical indicators ka bhi mawazna karna zaroori hai.


              • #8 Collapse


                Explain Commodity channel index Indicator (CCI)


                Click image for larger version

Name:	download (26).png
Views:	51
Size:	8.5 کلوبائٹ
ID:	12841298


                Commodity Channel Index (CCI) ek technical indicator hai jo market volatility aur price trend ko evaluate karne ke liye istemal hota hai. Yeh indicator Donald Lambert ne 1980 mein develop kiya tha. CCI primarily ek momentum oscillator hai, jo trading signals generate karne mein madad karta hai.

                Commodity Channel Index (CCI) ka Roman Urdu Mein Tafseel:

                1. CCI ka Maqsad:
                • CCI ka maqsad market mein hone wale price changes ko quantify karna hai, taaki traders ko overbought (zyada khareed) ya oversold (zyada bech) conditions ka pata chal sake.

                2. Calculation:
                • CCI ka calculation market price se hota hai. Yeh formula use hota hai: ���=Current Price−Simple Moving Average of Typical Price0.015×Mean DeviationCCI=0.015×Mean DeviationCurrent Price−Simple Moving Average of Typical Price​
                  • Typical Price=High Price + Low Price + Close Price3Typical Price=3High Price + Low Price + Close Price​
                  • Mean DeviationMean Deviation ek specific number of periods ke liye Typical Prices ka average absolute deviation hota hai.

                3. Interpretation:
                • CCI positive aur negative values produce karta hai.
                • Positive CCI values indicate ke price current trend ke upper side mein hai aur possibly overbought conditions ho sakti hain.
                • Negative CCI values suggest ke price current trend ke lower side mein hai aur possibly oversold conditions ho sakti hain.

                4. Overbought aur Oversold Conditions:
                • CCI ka use overbought ya oversold conditions ka pata lagane ke liye hota hai. Jab CCI positive hota hai aur ek certain threshold ko cross kar leta hai, toh yeh overbought conditions ko suggest karta hai. Upar se neeche girne ke baad, jab CCI negative hota hai aur ek certain threshold ko cross kar leta hai, toh yeh oversold conditions ko suggest karta hai.

                5. Trading Signals:
                • CCI ka use trading signals generate karne mein hota hai.
                • Overbought conditions mein, traders selling positions le sakte hain (sell).
                • Oversold conditions mein, traders buying positions le sakte hain (buy).

                6. Divergence aur Confirmation:
                • CCI ke signals ko confirm karne ke liye traders doosre technical indicators aur market analysis techniques ka istemal karte hain.
                • Divergence (alag ho jana) CCI signals ko validate karne mein madad karta hai.

                CCI ek versatile indicator hai jo various market conditions ko analyze karne mein istemal hota hai. Lekin, jaise ke har indicator ki tarah, CCI bhi kabhi-kabhi false signals generate kar sakta hai, isliye prudent trading ke liye confirmatory signals ka istemal zaroori hai.


                • #9 Collapse

                  Commodity Channel Index (CCI) ek technical analysis ka tool hai jo price movements ko evaluate karne aur trading opportunities ko identify karne ke liye istemal hota hai,

                  1. History and creation of Commodity Channel Index:

                  CCI 1980s mein Donald Lambert ne develop kiya tha. Initially, yeh tool commodities ke liye design kiya gaya tha, lekin aaj kal yeh stocks, currencies aur futures markets mein bhi istemal hota hai,

                  2. How CCI Works:

                  CCI price movements ka analysis karta hai aur overbought aur oversold conditions ko identify karta hai. Yeh price ke variation ko measure karta hai aur ek trend ka pata lagane mein madad karta hai,

                  3. Formula and calculations:

                  Commodity Channel Index ka formula simple hai. Yeh ek average price se current price ko compare karta hai aur fir us ko standard deviation se divide karta hai,

                  4. Overbought aur Oversold Conditions:

                  Yeh indicator overbought aur oversold conditions ko identify karne mein madad karta hai. Jab CCI high values ko cross karta hai, toh yeh overbought condition ka signal deta hai aur jab CCI low values ko cross karta hai, toh yeh oversold condition ka signal deta hai,

                  Click image for larger version

Name:	images(118).jpg
Views:	54
Size:	8.3 کلوبائٹ
ID:	12841379

                  5. Useful in Trend Analysis:

                  CCI trend analysis mein help karta hai. Agar CCI positive values show kar raha hai, toh yeh uptrend ka indication hai, jab ki agar negative values show kar raha hai, toh yeh downtrend ka indication hai,

                  6. Popular Trading Strategies:

                  Is indicator ke kuch popular trading strategies hain, jaise ki CCI bounce aur CCI divergence. In strategies ko istemal kar ke traders apne trading results improve kar sakte hain,

                  7. Measurement of Volatility:

                  CCI volatility ko bhi measure karta hai. Jab market volatile hota hai, toh CCI ki values bhi change hoti hain, aur isse traders ko volatility ke maamle mein behtar understanding milti hai,

                  8. Future Prospects of using CCI:

                  Future mein, CCI aur bhi advanced ho sakta hai. Aur accurate signals provide karne ki capabilities ko enhance kiya ja sakta hai, jisse traders ko aur bhi reliable information mil sake.
                  • #10 Collapse


                    Explain Commodity channel index Indicator (CCI)
                    The Commodity Channel Index (CCI) is a versatile technical indicator designed to identify cyclical trends in financial markets, particularly in commodities. Created by Donald Lambert, CCI is widely used across various asset classes, including stocks, currencies, and futures. The indicator helps traders and analysts identify potential overbought or oversold conditions and potential trend reversals.

                    Key Components of the Commodity Channel Index (CCI):
                    1. Calculation:
                      • The CCI is calculated using the following formula: 𝐶𝐶𝐼=(𝑇𝑦𝑝𝑖𝑐𝑎𝑙𝑃𝑟𝑖𝑐𝑒−𝑆𝑖𝑚𝑝𝑙𝑒𝑀𝑜𝑣𝑖𝑛𝑔𝐴𝑣𝑒𝑟𝑎𝑔𝑒)(0.015×𝑀𝑒𝑎𝑛𝐷 𝑒𝑣𝑖𝑎𝑡𝑖𝑜𝑛)CCI=(0.015×MeanDeviation)(TypicalPrice−Si mpleMovingAverage)​
                      • Here, the Typical Price is the average of the high, low, and close prices for a given period. The Simple Moving Average (SMA) is calculated over the same period, and the Mean Deviation represents the average deviation of prices from the SMA.
                    2. Time Period:
                      • Traders can customize the time period used in the calculation of the CCI based on their preferences and trading style. Common periods include 14, 20, or 25, but the choice depends on the timeframe of analysis.
                    3. Overbought and Oversold Levels:
                      • The CCI typically oscillates around a zero line. Traders often interpret CCI values above +100 as overbought conditions, suggesting that the price may be due for a correction or reversal. Conversely, CCI values below -100 are considered oversold, indicating potential buying opportunities.

                    Interpretation of the Commodity Channel Index (CCI):
                    1. Overbought and Oversold Conditions:
                      • CCI values above +100 suggest overbought conditions, indicating that the price may have risen too far, too fast, and a reversal might be imminent.
                      • CCI values below -100 suggest oversold conditions, indicating that the price may have declined too rapidly, and a potential bounce or reversal might occur.
                    2. Zero Line Crossings:
                      • The CCI crossing above the zero line from negative territory may signal the start of an uptrend.
                      • Conversely, the CCI crossing below the zero line from positive territory may signal the start of a downtrend.
                    3. Divergence:
                      • Divergence occurs when the CCI moves in the opposite direction of the price. Bullish divergence (CCI making higher lows while prices make lower lows) may indicate weakening bearish momentum, and vice versa.
                    4. Extreme Readings:
                      • Extremely high or low CCI values may indicate potential trend exhaustion. Traders often look for divergences or other confirming signals when CCI reaches extreme levels.

                    Trading Strategies Using CCI:
                    1. CCI as a Trend Indicator:
                      • Use CCI to identify the beginning of a new trend when it crosses above or below the zero line.
                    2. Overbought/Oversold Signals:
                      • Trade potential reversals when CCI reaches overbought or oversold levels. Look for price confirmation before entering a trade.
                    3. Divergence Trading:
                      • Utilize divergences between CCI and price to identify potential trend reversals.
                    4. Combining CCI with Other Indicators:
                      • Many traders combine CCI with other technical indicators, such as moving averages or trendlines, for additional confirmation.

                    Considerations and Caution:
                    1. False Signals:
                      • Like any indicator, CCI can generate false signals, especially in ranging markets. Traders should use additional analysis to confirm signals.
                    2. Adapt to Market Conditions:
                      • Market conditions change, and CCI's effectiveness may vary. Traders should adapt their strategies based on current market dynamics.
                    3. Risk Management:
                      • Always employ proper risk management techniques, such as setting stop-loss orders, to protect against unexpected market movements.

                    In conclusion, the Commodity Channel Index (CCI) is a valuable tool for traders and analysts to identify potential trend changes, overbought or oversold conditions, and divergence signals. As with any technical indicator, it is crucial to use CCI in conjunction with other tools and to adapt strategies to current market conditions.

                    ​​​​​​​
                    • #11 Collapse

                      What is commodity channel index indicator.

                      Assalam o Alaikum Dear Friends and Fellows Commodity Channel Index (CCI) indicator ek popular technical analysis tool hy. Yeh price movements ko analyze karny ke liye istemal hota hy. CCI volatility aur overbought/oversold conditions ko identify karny me madad krta hy. Positive aur negative divergence ko bhi detect karny me helpful hota hy. CCI indicator -100 aur +100 ke beech oscillate krta hy. Jab CCI +100 se upar jata hy, toh overbought condition indicate krta hy aur jab -100 se neechy jata hy, toh oversold condition indicate krta hy. Traders CCI indicator ka istemal kar ke trading signals generate kar sakty hein.

                      Overbought And Oversold Conditions.

                      Dear Fellows CCI +100 se zyada ho to ye market ko overbought indicate krta hy, jab ke CCI -100 se kam ho to ye market ko oversold indicate krta hy. Overbought condition me trend reversal ka chance hota hy aur oversold condition me trend change hone ka chance hota hy.

                      Trading Signals.

                      CCI ko trading signals ke liye istemal kiya ja sakta hy: Buy Signals: Jab CCI -100 se upar se neechy aata hy aur phir upar direction me move krta hy. Sell Signals: Jab CCI +100 se neechy aata hy aur phir neechy direction me move krta hy.


                      Divergence-Risk Management.

                      CCI ki madad se trader market me divergence detect kar sakty hein, jo trend reversal ki nishani ho sakti hy. CCI ko risk management me istemal kar ke trader apni stop-loss aur take-profit levels ko set kar sakty hein.

                      CCI indicator Formula .

                      CCI indicator ka formula yeh hy: CCI = (Typical Price - 20-period SMA of Typical Price) / (0.015 * Mean Deviation) Yaha "Typical Price" current candle ka average price hota hy, "SMA" simple moving average hy, aur "Mean Deviation" standard deviation ke average ko represent krta hy. Is formula ka istemal kar ke CCI indicator ka value calculate kiya jata hy.
                      • #12 Collapse


                        Commodity Channel Index (CCI) Indicator Ka Tajziya

                        Commodity Channel Index (CCI) ek ahem technical indicator hai jo market ki volatility aur price changes ko measure karta hai. Yah indicator traders ko trend reversals aur overbought ya oversold conditions ka pata lagane mein madad karta hai. Is article mein, hum CCI indicator ke tajziya ke liye 2000 lafz tak istemal karenge, Pakistan ke traders ke liye Roman Urdu mein.

                        Commodity Channel Index (CCI) Kya Hai?

                        CCI ek momentum-based indicator hai jo Donald Lambert ne 1980 mein banaya tha. Iska maqsad yeh hai ke woh traders ko bataye ke market kitna strong hai aur kya yeh overbought ya oversold hai. CCI ek oscillator hai, jo ek specific time period ke andar price ki relative strength ko measure karta hai.

                        Formula ke zariye CCI calculate kiya jata hai:

                        ���=(Typical Price−SMA of Typical Price0.015×Mean Deviation)CCI=(0.015×Mean DeviationTypical Price−SMA of Typical Price​)

                        Yahan, "Typical Price" market ka average price hota hai, "SMA" simple moving average ko represent karta hai, aur "Mean Deviation" actual prices ka deviation ko darust taur par darust karta hai.

                        CCI Ka Istemal:
                        1. Overbought Aur Oversold Conditions: CCI 100 aur -100 levels ko as standard consider karta hai. Agar CCI 100 ke upar hai, to yeh indicate karta hai ke market overbought hai aur aapko behtar hota hai apne long positions ko close kar lena. Wahi agar CCI -100 ke neeche hai, to yeh oversold market ko represent karta hai aur aapko behtar hota hai apne short positions ko close kar lena.
                        2. Trend Reversals: CCI trend reversals ko identify karne mein madad karta hai. Agar CCI positive se negative ya negative se positive ho jata hai, to yeh trend reversal ka sign hai. Traders is signal ko samajh kar apni trading strategy ko adjust kar sakte hain.
                        3. Divergence Aur Convergence: CCI ki madad se traders market ke momentum mein divergence aur convergence ko dekh sakte hain. Agar price new highs banata hai lekin CCI naye highs nahi banata, to yeh divergence hai aur trend ka weak hone ka indication ho sakta hai. Wahi agar dono new highs banate hain, to yeh convergence hai aur trend ka confirmatory sign ho sakta hai.
                        4. Support Aur Resistance Levels: CCI ka istemal support aur resistance levels ko identify karne mein bhi kiya ja sakta hai. Agar CCI support level ko cross karta hai, to yeh bullish signal ho sakta hai. Wahi agar CCI resistance level ko cross karta hai, to yeh bearish signal ho sakta hai.

                        CCI Ka Istemal Chart Par:

                        CCI ko chart par dekhte waqt, traders ko kuch ahem points ka khayal rakhna chahiye:
                        1. Level Crossings: Jab CCI 100 ya -100 level ko cross karta hai, to yeh ek potential trading signal ho sakta hai. Agar CCI positive se negative ja raha hai, to yeh behtar hota hai ke aap apne long positions ko close karein. Wahi agar CCI negative se positive ja raha hai, to yeh bearish sentiment ko darust karta hai.
                        2. Divergence Aur Convergence: Divergence aur convergence ko dekhte hue traders ko price action ke sath milake CCI ka istemal karna chahiye. Agar price aur CCI mein divergence hai, to yeh trend ki kamzori ko darust karta hai. Wahi agar dono mein convergence hai, to yeh trend ke faaslay ko confirm karta hai.
                        3. Extreme Levels Par Hoshyaari: Agar CCI extreme levels par pohanch jata hai, jese ke 200 ya -200, to hoshyaari se kaam lena chahiye. Extreme levels par pohanchne ka matlab hai ke market mein bohot zyada volatility hai, aur aapko apne positions ko monitor karne ke liye tayyar rehna chahiye.

                        CCI Aur Diğer Indicators Ke Sath Istemal:

                        CCI ko dusre indicators ke saath milake istemal karna bhi acha hota hai. Isse traders ko aur bhi tajaweezat aur confirmations milti hain. Moving averages, RSI, aur MACD jese indicators ke saath CCI ka istemal karke traders apne trading decisions ko mazeed strengthen kar sakte hain.

                        Mukhtalif Time Frames Par CCI:

                        CCI ko mukhtalif time frames par dekha ja sakta hai. Short-term traders aur long-term investors dono iska faida utha sakte hain. Chhote time frames par CCI jaldi se overbought ya oversold conditions ko detect karta hai jabke baray time frames par yeh trend reversals ko bhi achhi tarah se identify kar sakta hai.

                        Conclusion:

                        Commodity Channel Index (CCI) ek aham technical indicator hai jo traders ko market ki volatility, trend reversals, aur overbought ya oversold conditions ka andaza lagane mein madad karta hai. Pakistan ke traders ko yeh samajhna zaroori hai ke CCI ka sahi istemal karne ke liye unko market ki mazbooti aur kamzoriyon ko samajhna hoga. CCI ke signals ko confirm karne ke liye dusre technical indicators ka bhi istemal kiya ja sakta hai. Hamesha yaad rahe ke kisi bhi indicator ko istemal karne se pehle, thorough analysis aur risk management ka khayal rakhna zaroori hai.


                        Last edited by ; 27-02-2024, 01:12 PM.
                        • #13 Collapse

                          Explain Commodity channel index Indicator (CCI)Click image for larger version

Name:	download - 2024-02-26T143626.168.png
Views:	44
Size:	8.6 کلوبائٹ
ID:	12842975


                          Heading: "Commodity Channel Index (CCI) Indicator ka Tafseeli Tajziya"

                          Tareef: Commodity Channel Index (CCI) ek technical indicator hai jo market volatility aur price momentum ko evaluate karne ke liye istemal hota hai. Yeh indicator trend reversal aur overbought/oversold conditions ko identify karne mein madad karta hai.

                          CCI Kaise Kaam Karta Hai: CCI calculation market ke current price ko uski moving average se compare karta hai aur standard deviation ka istemal karta hai. Isse ek normalized value milta hai jo market ki volatility ko darust karta hai. Positive CCI values indicate bullish momentum, negative values indicate bearish momentum, aur zero ke aspaas fluctuations indicate market stability.

                          Mukhtalif Stithiyon Mein CCI:
                          1. Overbought aur Oversold Conditions:
                            • Jab CCI positive values se zyada ho jata hai, toh yeh indicate karta hai ke market overbought hai, aur reversaal ki sambhavna badh jaati hai.
                            • Jab CCI negative values se zyada ho jata hai, toh yeh indicate karta hai ke market oversold hai, aur reversaal ki sambhavna badh jaati hai.
                          2. Divergence aur Convergence:
                            • CCI ki tajziya mein divergence aur convergence dekha ja sakta hai, jo trend reversal ko suggest karte hain.
                          3. **Trend Reversal:
                            • Jab CCI values extreme levels tak pahunchti hain, toh yeh indicate karta hai ke trend reversal hone ki sambhavna hai.

                          CCI Ka Istemal Trading Mein: CCI ko trading strategies mein incorporate karne se pehle, traders ko market conditions aur dusre technical indicators ka bhi dhyan rakhna chahiye. CCI ko dusre oscillators aur trend-following indicators ke saath mila kar istemal karna behtar hota hai.

                          Dhyan Rahein: CCI ek powerful tool hai, lekin yeh kabhi-kabhi false signals bhi generate kar sakta hai. Isliye, iska istemal karne se pehle thorough analysis aur risk management ka dhyan rakhna important hai.

                          Naseehat: CCI ka istemal karne se pehle, traders ko iske tafseelat ko samajhna chahiye aur demo trading account par isko test karna chahiye taki asal trading mein behtar faislay liye ja sakein.
                          • #14 Collapse

                            **Commodity Channel Index (CCI) Indicator Ka Taaruf**
                            Forex trading mein, technical indicators market analysis aur trading decisions ko enhance karne mein madadgar sabit hote hain. Inme se ek hai Commodity Channel Index (CCI), jo price momentum aur trend strength ko measure karne ke liye use kiya jata hai. Is post mein, hum CCI indicator ke basics, calculation, aur trading strategies ke baare mein detail se discuss karenge.

                            **1. Commodity Channel Index (CCI) Kya Hai?**

                            Commodity Channel Index (CCI) ek versatile technical indicator hai jo originally commodities markets ke liye develop kiya gaya tha, lekin ab yeh forex aur stocks markets mein bhi use hota hai. CCI price ke deviation ko measure karta hai aur market ke overbought ya oversold conditions ko identify karta hai. Yeh indicator price aur its moving average ke beech ke deviation ko quantify karta hai, jisse traders ko market momentum aur potential reversals ko detect karne mein madad milti hai.

                            **2. CCI Ki Calculation:**

                            CCI ko calculate karne ke liye, sabse pehle Average Price (AP) calculate ki jati hai, jo high, low, aur closing prices ka average hota hai:

                            \[ \text{AP} = \frac{\text{High} + \text{Low} + \text{Close}}{3} \]

                            Phir, CCI calculate karne ke liye, AP ka Moving Average (MA) aur Mean Absolute Deviation (MAD) use kiya jata hai. CCI formula kuch is tarah hota hai:

                            \[ \text{CCI} = \frac{\text{AP} - \text{MA}}{0.015 \times \text{MAD}} \]

                            Yahan 0.015 ek constant hai jo CCI ko overbought aur oversold levels ke beech normalize karta hai.

                            **3. CCI Ki Interpretation:**

                            - **Overbought Conditions:** Jab CCI indicator +100 se upar hota hai, to market overbought condition mein hoti hai. Yeh signal de sakta hai ke price trend apne peak par hai aur reversal ya correction expected ho sakta hai.

                            - **Oversold Conditions:** Jab CCI indicator -100 se neeche hota hai, to market oversold condition mein hoti hai. Yeh signal de sakta hai ke price trend apne low point par hai aur potential reversal ya bounce expected ho sakta hai.

                            - **Zero Line Crossings:** CCI indicator zero line ko cross karne par bhi important signals provide karta hai. Jab CCI zero line ko upar se neeche ya neeche se upar cross karta hai, to yeh potential trend reversal ke signals de sakta hai.

                            **4. CCI Trading Strategies:**

                            - **Trend Confirmation:** CCI ko trend confirmation ke liye use kiya ja sakta hai. Jab CCI +100 ke upar hota hai aur price bhi upward trend show karti hai, to yeh bullish trend confirmation ke signal ke roop mein dekha ja sakta hai. Similarly, -100 ke neeche CCI aur downward price trend bearish confirmation ka indication hai.

                            - **Reversal Signals:** CCI ke overbought aur oversold levels ko trading reversals ke signals ke roop mein use kiya ja sakta hai. Jab CCI overbought level par hota hai aur phir neeche aata hai, to yeh potential selling opportunity provide kar sakta hai. Conversely, jab CCI oversold level par hota hai aur upar aata hai, to yeh buying opportunity indicate kar sakta hai.

                            - **Divergence:** CCI ko price action ke saath divergence identify karne ke liye bhi use kiya ja sakta hai. Agar price naye highs bana rahi hai jabke CCI lower highs bana raha hai, to yeh bearish divergence ko indicate karta hai aur reversal ka signal ho sakta hai. Similarly, agar price naye lows bana rahi hai jabke CCI higher lows bana raha hai, to yeh bullish divergence ka signal hai.

                            **5. Combining With Other Indicators:**

                            CCI ko other technical indicators ke saath combine karke trading signals ko confirm kiya ja sakta hai. Moving averages, RSI (Relative Strength Index), aur MACD (Moving Average Convergence Divergence) ke saath CCI ko use karke more accurate trading decisions liye ja sakte hain.

                            **Summary:**

                            Commodity Channel Index (CCI) ek powerful indicator hai jo price momentum aur market conditions ko analyze karne mein madad karta hai. Yeh overbought aur oversold conditions, trend confirmation, aur reversal signals provide karta hai. CCI ke signals ko risk management aur other technical indicators ke saath combine karke trading accuracy aur profitability ko enhance kiya ja sakta hai. Trading decisions ko better banane ke liye CCI ka effective use zaroori hai.
                            • <a href="https://www.instaforex.org/ru/?x=ruforum">InstaForex</a>
                            • #15 Collapse

                              Commodity channel Indicator Indicator
                              Assalam o Alaikum Dear musketeers and Fellows Commodity Channel Index( CCI) index ek popular specialized analysis tool hy. Yeh price movements ko dissect karny ke liye istemal hota hy. CCI volatility aur overbought oversold conditions ko identify karny me madad krta hy. Positive aur negative divergence ko bhi descry karny me helpful hota hy. CCI index-100 aur 100 ke beech oscillate krta hy. poke CCI 100 se upar jata hy, toh overbought condition indicate krta hy aur poke-100 se neechy jata hy, toh oversold condition indicate krta hy. Dealers CCI index ka istemal kar ke trading signals induce kar sakty hein.

                              Click image for larger version

Name:	commmo.png
Views:	30
Size:	9.1 کلوبائٹ
ID:	13131299

                              Overbought And Oversold Conditions
                              Dear Fellows CCI 100 se zyada ho to ye vend ko overbought indicate krta hy, poke ke CCI-100 se kam ho to ye vend ko oversold indicate krta hy. Overbought condition me trend reversal ka chance hota hy aur oversold condition me trend change hone ka chance hota hy.

                              Trading Signals
                              CCI ko trading signals ke liye istemal kiya ja sakta hy Buy Signals poke CCI-100 se upar se neechy aata hy aur phir upar direction me move krta hy. vend Signals poke CCI 100 se neechy aata hy aur phir neechy direction me move krta hy.

                              Divergence- threat operation
                              CCI ki madad se dealer request me divergence descry kar sakty hein, jo trend reversal ki nishani ho sakti hy. CCI ko threat operation me istemal kar ke dealer apni stop- loss aur take- profit situations ko set kar sakty hein.

                              CCI index Formula
                              CCI index ka formula yeh hy CCI = ( Typical Price- 20- period SMA of Typical Price)/( 0.015 * Mean divagation) Yaha" Typical Price" current candle ka average price hota hy," SMA" simple moving average hy, aur" Mean divagation" standard divagation ke average ko represent krta hy. Is formula ka istemal kar ke CCI index ka value calculate kiya jata hy.

                              Click image for larger version

Name:	222.jfif
Views:	12
Size:	17.9 کلوبائٹ
ID:	13131300

                              اب آن لائن

                              Working...
                              X