?What is DMI in forex trading

No announcement yet.
`
X
  • وقت
  • دکھائیں
Clear All
new posts
  • #1 Collapse

    ?What is DMI in forex trading

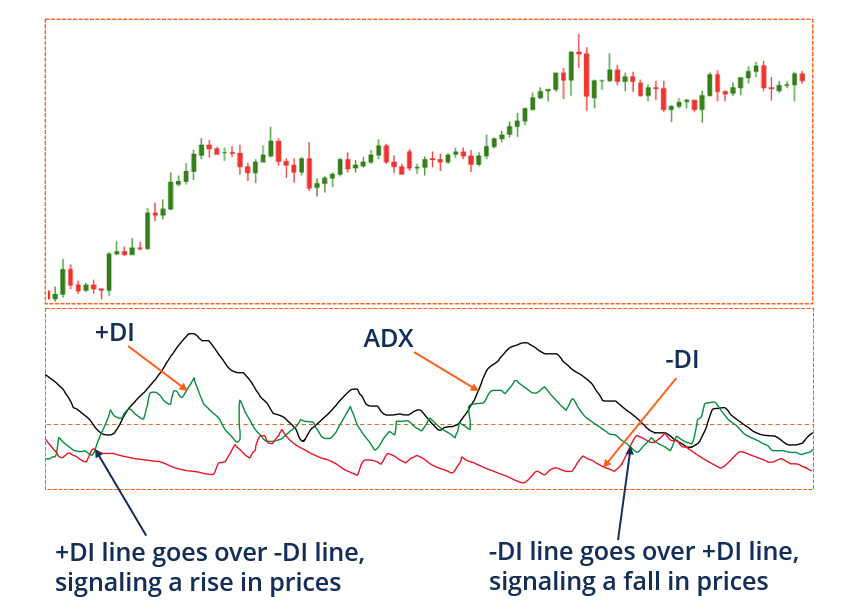
    Directional Movement Index (DMI) ek technical indicator hai jo market trends ko analyze karne mein madad karta hai. Ye indicator specifically trend strength aur direction ko measure karta hai. DMI, trend-following indicators ki family ka hissa hai aur traders ko market mein hone wale potential trend changes ke baare mein information provide karta hai.

    DMI Key Points:
    1. Components (اہم حصے):
      • DMI do components se mil kar bana hota hai: Positive Directional Movement Indicator (+DMI) aur Negative Directional Movement Indicator (-DMI).
      • In dono indicators ki madad se trend ki direction aur uski strength ko determine kiya jata hai.
    2. Trend Direction (ٹرینڈ کی سمت):
      • +DMI positive trends ko represent karta hai, jabki -DMI negative trends ko.
      • Agar +DMI -DMI se zyada hai, to market mein uptrend hone ke chances hote hain. Wahi agar -DMI +DMI se zyada hai, to downtrend hone ke chances hote hain.
    3. ADX (Average Directional Index) (ای ڈی ایکس):
      • ADX, DMI ke sath istemal hone wala ek aur important component hai.
      • Ye indicator trend ki strength ko measure karta hai. Agar ADX ki value zyada hai, to trend strong hai, aur agar kam hai to trend weak hai.

    DMI Ka Istemal (Usage):
    1. Trend Confirmation (ٹرینڈ کی تصدیق):
      • +DMI aur -DMI ke cross overs, yaani jab +DMI -DMI ko cross karta hai, trend ke changes ko signify kar sakte hain.
      • Agar +DMI ne -DMI ko upar cross kiya, to ye uptrend ki shuruat ho sakti hai, aur agar -DMI ne +DMI ko upar cross kiya, to ye downtrend ki shuruat ho sakti hai.
    2. ADX Ka Istemal (Use of ADX):
      • ADX ki value ka istemal trend ki strength ko evaluate karne mein hota hai.
      • Agar ADX zyada hai, to trend strong hai, aur agar kam hai to trend weak hai.
    3. Divergence Analysis (متنازعہ تجزیہ):
      • DMI ke istemal se traders trend ke divergence ko identify kar sakte hain, jo future trend changes ka indicator ho sakta hai.

    Conclusion (ختم): Directional Movement Index (DMI) ek powerful tool hai jo traders ko market trends ke baare mein behtareen insights deta hai. Iska istemal trend confirmation, strength measurement, aur potential reversals ke liye kiya ja sakta hai. Lekin, har ek indicator ki tarah, isko bhi dusre tools aur analysis ke saath istemal karna important hai.
  • <a href="https://www.instaforex.org/ru/?x=ruforum">InstaForex</a>
  • #2 Collapse

    Assalamu Alaikum Dosto!

    Directional Movement Index (DMI)


    Directional Movement Index (DMI) ek technical indicator hai jo J. Welles Wilder ne 1970s mein develop kiya tha. Ye security ki price movement ki strength aur direction ko measure karne ke liye istemal hota hai. DMI teen lines se bana hua hai:
    • Positive Directional Movement Index (+DI)
    • Negative Directional Movement Index (-DI)
    • Average Directional Index (ADX)


    DMI indicator ko interpret karne ke liye, +DI (Positive Directional Indicator) aur -DI (Negative Directional Indicator) ka istemal kiya jata hai. +DI bullish price movement ko indicate karta hai jabki -DI bearish price movement ko indicate karta hai. Dono indicators ki values 0 se 100 ke beech hoti hain. Jab +DI -DI se upar hota hai, ye bullish signal hai, aur jab -DI +DI se upar hota hai, ye bearish signal hai.
    DMI indicator ke signals ko interpret karne ke liye, traders often use crossovers, extremes, aur ADX ke saath confirmations. Crossovers, jab +DI -DI ko cross karta hai, buy ya sell signals generate karte hain. Extremes, jab +DI aur -DI ki values high levels tak pahunch jati hain, strong trend ka indication dete hain. ADX, trend strength ko measure karta hai aur ye bata sakta hai ki market mein trend kitna strong hai. DMI ka calculation nimnlikhit kadamon se kiya jata hai:
    1. Har period ke liye True Range (TR) calculate karen. TR maximum hai in teeno mein se:
      • Current high se current low ka difference
      • Current high se previous close ka difference
      • Previous close se current low ka difference
    2. Har period ke liye Positive Directional Movement (+DM) calculate karen. +DM current high aur previous high ka difference hota hai.
    3. Har period ke liye Negative Directional Movement (-DM) calculate karen. -DM current low aur previous low ka difference hota hai.
    4. +DI aur -DI lines calculate karen, +DM aur -DM lines ko ek specified number of periods ke liye average karke. Standard number of periods 14 hai.
    5. ADX line calculate karen, smoothed +DI aur -DI lines ka average karke.


    Explaination & DMI Calculation

    J. Welles Wilder k Directional Movement Index (DMI) banane ka maqsad traders ko price trend ki taraf aur uski taqat ki tajaweez karna hai. DMI is maqsad ko haasil karne ke liye pichli unchaiyon aur neechaiyon ko mawafiq karta hai aur do lines khich leta hai: aik positive directional movement line (+DI) aur aik negative directional movement line (-DI). Ek mawafiq taur par ismein aik teesri line bhi shamil ho sakti hai, jo ke average directional index (ADX) ke naam se makhsoos hoti hai. ADX, DX ka smoothed average hai, jo ke +DI aur -DI lines ke darmiyan mutlif farq ko darust karta hai. DMI ko asal taur par trend ki taraf tabdeelat ka andaza lagane aur trade signals farahem karne ke liye istemal kiya jata hai. +DI aur -DI lines ke darmiyan crossovers asal trade signals hote hain. Agar +DI -DI se behtareen taur par oopar hai, toh yeh ek mazboot uptrend ko tasdeeq karta hai, jabke agar -DI +DI se behtareen taur par oopar hai, toh yeh ek mazboot downtrend ko tasdeeq karta hai. ADX line trend ki taqat ko tasdeeq karne ke liye istemal hoti hai, jisme 25 ke upar ka value mazboot trend ko darust karta hai.
    Directional Movement Index (DMI) ek technical indicator hai jo kisi asset ki price movements ki taraf aur taqat ki pehchan karne mein madad karta hai. J. Welles Wilder k iss indicator mein teen mukhtalif hisse shamil hote hain: Positive Directional Indicator (+DI), Negative Directional Indicator (-DI), aur Average Directional Index (ADX).
    DMI is analysis ko tayar karne ke liye is tarah calculate hota hai:
    1. +DI aur -DI tayar karen:
      • Aaj aur kal ke highs aur lows ke darmiyan farq par based +DM (Positive Directional Movement) aur -DM (Negative Directional Movement) tayar karen.
      • In values ko Average True Range (ATR) aur chunayi gayi muddat (aam taur par 14 muddat) se hal karen.


      Phir, in values ko smooth karne ke liye inka istemal karen aur smooth True Range ke sath +DI aur -DI tayar karen.
    2. Directional Index (DX) tayar karen:
      • Directional Index (DX) ka calculation +DI aur -DI ke darmiyan farq ki absolute value hoti hai, jise +DI aur -DI ke sum se taqseem kar ke 100 se zarb karte hain.
      • Average Directional Index (ADX) tayar karen:
      • ADX, DX values ka ek mukhtasir average hota hai jo mukhtasir muddat par calculate kiya jata hai. Iska istemal trend ki taqat ko darust karne ke liye hota hai. 25 ke upar ka value aam taur par ek mazboot trend ko darust karta hai, jabke 20 ke neeche ka value ek kamzor ya non-trending market ko ishara karta hai.


    DMI ko asal taur par trend ki taraf tabdeelat ka andaza lagane aur trade signals farahem karne ke liye istemal kiya jata hai. +DI aur -DI lines ke darmiyan crossovers potential buy ya sell signals ko darust kar sakte hain, aur trend ki taqat ko +DI aur -DI lines ke darmiyan farq aur ADX ke level se tajaweez kiya ja sakta hai. Yeh zaroori hai ke DMI ko doosre technical indicators aur bunyadi analysis ke sath istemal kiya jaye taki maqool trading decisions li ja saken. Iske ilawa, traders DMI ke components ke period lengths ko apne khas trading strategies aur risk tolerance ke mutabiq adjust kar sakte hain.


    DMI ka Istemal


    DMI ka istemal trend ki direction, trend ki strength aur potential reversals ko identify karne ke liye kiya jaa sakta hai. Trend ki direction ko identify karne ke liye, +DI line ko -DI line se upar dekhein. Isse pata chalega ki ek upward trend hai. Agar -DI line +DI line se upar hai, to ek downward trend hai.
    Trend ki strength ko determine karne ke liye, ADX line ko dekhein. Jitni adhik ADX line hai, utni zyada strong trend hai. ADX readings 20 se kam weak trend indicate karte hain, 20 se 50 ke beech moderate trend indicate karte hain, aur 50 se upar strong trend indicate karte hain.
    Trend ki potential reversals ko identify karne ke liye, +DI aur -DI lines ke cross ko dekhein. +DI line se -DI line ke upar cross hone par potential reversal downward trend ki taraf indicate karta hai. -DI line se +DI line ke upar cross hone par potential reversal upward trend ki taraf indicate karta hai.
    DMI indicator ko sahi tarike se use karne ke liye, traders ko isko dusre indicators aur tools ke saath combine karna chahiye. Ye indicator trend direction aur trend strength ke liye useful hai, lekin iski signals ko confirm karne ke liye dusre technical indicators, jaise ki moving averages, support aur resistance levels ka istemal kiya ja sakta hai.
    DMI technical analysis ke liye ek useful tool hai, lekin isme kuch limitations bhi hain. Ek limitation ye hai ki ye trend ke changes ke liye slow ho sakta hai. Dusri limitation ye hai ki ye false signals ke subject ho sakta hai. False signals ke risk ko kam karne ke liye, DMI ko dusre technical indicators ke saath istemal karna mahatvapurn hai. Ye bhi yaad rakhna zaruri hai ki DMI sirf ek tool hai aur trading decisions lene ke liye sole basis ke roop mein istemal nahi hona chahiye.

    DMI Trading Strategy

    DMI traders ke liye ek qeemati tool hai jo market trends ko analyze karne mein madad karta hai, aur isay amooman doosre technical indicators aur bunyadi tajaweezat ke sath istemal kiya jata hai takay mumkinay trade signals ko tasdeeq kiya ja sake. Directional Movement Index (DMI) ke sath trading karne mein yeh kadam aur strategies madadgar ho sakti hain:
    1. Trend ki taraf ishara karen: DMI madad karta hai ke trend ki taraf ishara kiya jaye, mojooda price ko pichli highs aur lows ke sath muqabla karte hue.
      • Agar +DI line -DI line se oopar hai, toh market mein umeed hai ke trend upar ja raha hai, aur is par long trade kiya ja sakta hai.
      • Umum an mein, agar -DI line +DI line se oopar hai, toh price trend majbooti se neeche ja raha hai.
    2. Trend ki taqat ka andaza lagayen: +DI aur -DI lines ke darmiyan farq trend ki taqat ko darust kar sakta hai. Ziyada farq wala trend majbooti se ishara karega, jabke kam farq wala trend kamzor ko darust karega.
    3. Crossovers ko trade signals ke tor par istemal karen: +DI aur -DI lines ke darmiyan crossovers buy ya sell signals ke tor par istemal kiye ja sakte hain.
      • For example, agar -DI line +DI line se oopar chali jaye, toh yeh ek buy signal ho sakta hai, jabke agar +DI line -DI line se oopar chali jaye, toh yeh ek sell signal ho sakta hai.
    4. ADX ke value ko madde nazar rakhen: Average Directional Index (ADX) DMI ka aik optional hissa hai jo trend ki taqat ko maloom karne mein madad karta hai.
      • 25 ke upar ka value aam taur par ek majboot trend ko darust karta hai, jabke 20 ke neeche ka value ek kamzor ya non-trending market ko ishara karta hai.
    5. DMI ko doosre technical indicators ke sath joren: Trading signals ki sahiyat ko barhane ke liye, DMI ko doosre technical indicators jaise ke moving averages, RSI, ya MACD ke sath jorna faydahmand ho sakta hai.
      • Yeh tajaweezat trend ki taqat aur direction ko tasdeeq karnay mein madad karte hain, false signals ke imkan ko kam karte hain.
    6. Period lengths ko adjust karen: Traders DMI ke components ke period lengths ko apni khas trading strategies aur risk tolerance ke mutabiq adjust kar sakte hain.
      • Aam taur par, chhote period lengths short-term traders ke liye zyada munasib hote hain, jabke lambi period lengths long-term investors ke liye zyada munasib hote hain.
    7. Market ke halat ko monitor karen: DMI ko doosre technical indicators aur bunyadi analysis ke sath istemal karke maqool trading decisions lene mein madad hoti hai.
      • Hamesha yeh yaad rakhen ke market ke kul halat aur asset ke price ko asar andaz karne wale koi bhi maqbool khabrein ya waqiyat bhi madde nazar rakhen.


    Summery k taur par, Directional Movement Index (DMI) ke sath trading isay identifay karnay, trend ki taqat ko tashheer karnay, crossovers ko trade signals ke tor par istemal karnay, ADX ke value ko madde nazar rakhtay hue, DMI ko doosre technical indicators ke sath jornay, period lengths ko adjust karnay, aur market ke halat ko monitor karnay par mabni hoti hai. In strategies ko jor kar, traders maqool trading decisions le saktay hain aur unki kamiyabi ke imkanat ko barha saktay hain.

    • #3 Collapse


      DMI (Directional Movement Index) forex trading mein aik ahem technical indicator hai jo market ke trend ko samajhne aur trend ke direction ko determine karne mein madad deta hai. Yeh indicator market ke trend ki strength ko measure karta hai aur traders ko trend ke reversals ko anticipate karne mein madad karta hai. DMI ko J. Welles Wilder ne 1978 mein introduce kiya tha. Yahan DMI ke bare mein kuch ahem maloomat hain:

      DMI Kya Hai? DMI (Directional Movement Index) ek trend following indicator hai jo market ke trend ko analyze karta hai. DMI ko DMI line aur Signal line ke taur par dikhaya jata hai. DMI line market ke trend ki strength ko darust karta hai, jabke Signal line trend ke direction ko indicate karta hai.

      DMI Components:
      1. DMI Line (Directional Movement Index Line): DMI line market ke trend ki strength ko darust karta hai. Positive DMI line uptrend ki strength ko measure karta hai jabke negative DMI line downtrend ki strength ko measure karta hai.
      2. Signal Line: Signal line DMI line ko smooth karke ek signal provide karta hai. Is line ko DMI line ka 14-periods ka Exponential Moving Average (EMA) liya jata hai.

      DMI Ka Istemal:
      1. Trend Ki Strength Ka Pata Lagayein: Positive DMI line ka istemal karke uptrend ki strength ko measure kiya ja sakta hai aur negative DMI line ka istemal karke downtrend ki strength ko measure kiya ja sakta hai.
      2. Trend Direction Ka Pata Lagayein: Positive DMI line ka istemal karke uptrend ko confirm kiya ja sakta hai jabke negative DMI line ka istemal karke downtrend ko confirm kiya ja sakta hai.
      3. ADX Ka Istemal: DMI ke sath sath Average Directional Index (ADX) ka istemal kiya jata hai jo trend ki strength ko auratrend ke dynamics ko samajhne mein madad karta hai. ADX 20 ke upar hone par trend ki strength ko darust karta hai.

      DMI Trading Strategy:
      1. DMI Line Crossings: Jab DMI line Signal line ko upar se cross karta hai, to yeh bullish signal hai aur traders ko long positions ki entry ki talash karni chahiye. Jab DMI line Signal line ko neeche se cross karta hai, to yeh bearish signal hai aur traders ko short positions ki entry ki talash karni chahiye.
      2. ADX Levels: ADX 20 ke upar hone par trend ki strength ko confirm kiya jata hai. Agar ADX 20 ke upar hai aur DMI line Signal line ko upar se cross karta hai, to yeh strong trend ka confirmation hai aur traders ko trend ke sath trading karni chahiye.

      DMI (Directional Movement Index) ek mufeed technical indicator hai jo traders ko market ke trend aur trend ke direction ko samajhne mein madad karta hai. Lekin, iske istemal mein traders ko doosre confirmations aur risk management ka bhi khayal rakhna chahiye taake sahi trading decisions liye ja sakein.

      منسلک شدہ فائلیں
      • #4 Collapse


        DMI (Directional Movement Index) forex trading mein ek ahem technical indicator hai jo market ke trend ko samajhne aur trend ke direction ko determine karne mein madad deta hai. Yeh indicator market ke trend ki strength ko measure karta hai aur traders ko trend ke reversals ko anticipate karne mein madad karta hai. DMI ko J. Welles Wilder ne 1978 mein introduce kiya tha. Yahan DMI ke bare mein kuch ahem maloomat hain:

        DMI Kya Hai? DMI (Directional Movement Index) ek trend following indicator hai jo market ke trend ko analyze karta hai. DMI ko DMI line aur Signal line ke taur par dikhaya jata hai. DMI line market ke trend ki strength ko darust karta hai, jabke Signal line trend ke direction ko indicate karta hai.
        Click image for larger version

Name:	DMI-indicator-2.png
Views:	45
Size:	27.4 کلوبائٹ
ID:	12837731
        DMI Components:
        1. DMI Line (Directional Movement Index Line): DMI line market ke trend ki strength ko darust karta hai. Positive DMI line uptrend ki strength ko measure karta hai jabke negative DMI line downtrend ki strength ko measure karta hai.
        2. Signal Line: Signal line DMI line ko smooth karke ek signal provide karta hai. Is line ko DMI line ka 14-periods ka Exponential Moving Average (EMA) liya jata hai.

        DMI Ka Istemal:
        1. Trend Ki Strength Ka Pata Lagayein: Positive DMI line ka istemal karke uptrend ki strength ko measure kiya ja sakta hai aur negative DMI line ka istemal karke downtrend ki strength ko measure kiya ja sakta hai.
        2. Trend Direction Ka Pata Lagayein: Positive DMI line ka istemal karke uptrend ko confirm kiya ja sakta hai jabke negative DMI line ka istemal karke downtrend ko confirm kiya ja sakta hai.
        3. ADX Ka Istemal: DMI ke sath sath Average Directional Index (ADX) ka istemal kiya jata hai jo trend ki strength ko aur trend ke dynamics ko samajhne mein madad karta hai. ADX 20 ke upar hone par trend ki strength ko confirm kiya jata hai.

        DMI Trading Strategy:
        1. DMI Line Crossings: Jab DMI line Signal line ko upar se cross karta hai, to yeh bullish signal hai aur traders ko long positions ki entry ki talash karni chahiye. Jab DMI line Signal line ko neeche se cross karta hai, to yeh bearish signal hai aur traders ko short positions ki entry ki talash karni chahiye.
        2. ADX Levels: ADX 20 ke upar hone par trend ki strength ko confirm kiya jata hai. Agar ADX 20 ke upar hai aur DMI line Signal line ko upar se cross karta hai, to yeh strong trend ka confirmation hai aur traders ko trend ke sath trading karni chahiye.

        DMI (Directional Movement Index) ek mufeed technical indicator hai jo traders ko market ke trend aur trend ke direction ko samajhne mein madad karta hai. Lekin, iske istemal mein traders ko doosre confirmations aur risk management ka bhi khayal rakhna chahiye taake sahi trading decisions liye ja sakein.

        • #5 Collapse


          DMI Forex Trading Mein: Directional Movement Index

          DMI (Directional Movement Index) ek ahem technical indicator hai jo forex trading mein istemal hota hai. Yeh indicator market ke trend ko samajhne mein madad deta hai aur traders ko trend ke direction aur strength ka pata lagane mein help karta hai. DMI ko samajh kar, traders apni trading decisions ko improve kar sakte hain aur market movements ko samajhne mein asani ho sakti hai.
          Click image for larger version

Name:	DMI-indicator-8.png
Views:	47
Size:	28.0 کلوبائٹ
ID:	12837862
          DMI Kya Hai?

          DMI (Directional Movement Index) ek trend-following indicator hai jo market ke direction ko identify karta hai. Iska calculation market ke price movements ke based hota hai. DMI ek range-bound indicator hai jo 0 se 100 tak ke values ko represent karta hai.

          DMI Components:
          1. Positive Directional Movement (+DI): +DI line market ke bullish movement ko represent karta hai. Agar +DI upar move kar raha hai, to yeh bullish trend ko darust karta hai.
          2. Negative Directional Movement (-DI): -DI line market ke bearish movement ko represent karta hai. Agar -DI upar move kar raha hai, to yeh bearish trend ko darust karta hai.
          3. Average Directional Index (ADX): ADX line market ke trend ke strength ko measure karta hai. Agar ADX ki value zyada hai, to trend strong hai aur agar kam hai, to trend weak hai.

          DMI Ka Istemal:

          DMI ko istemal karte waqt, traders kuch points ka dhyan rakhte hain:
          1. Trend Detection: DMI ka istemal karke traders market ke trend ko identify karte hain. Agar +DI line -DI line se upar hai aur ADX ki value bhi zyada hai, to yeh bullish trend ko darust karta hai. Agar -DI line +DI line se upar hai aur ADX ki value bhi zyada hai, to yeh bearish trend ko darust karta hai.
          2. Entry Points: Jab trend confirm ho jata hai, to traders entry points tay karte hain. Agar uptrend hai, to long positions lete hain jab +DI line -DI line se upar hai aur ADX ki value bhi zyada hai. Agar downtrend hai, to short positions lete hain jab -DI line +DI line se upar hai aur ADX ki value bhi zyada hai.
          3. Exit Points: Traders DMI ka istemal karke exit points bhi tay karte hain. Jab trend change hone ka indication milta hai, ya phir ADX ki value kam ho jati hai, to traders apni positions ko close kar dete hain.

          DMI (Directional Movement Index) forex trading mein trend ko samajhne aur trend ke direction aur strength ka pata lagane mein madadgar sabit hota hai. Traders ko DMI ko samajh kar aur sahi tareeqe se istemal karke apni trading decisions ko improve kar sakte hain aur market movements ko sahi tareeqe se samajh sakte hain.

          • #6 Collapse

            1. DMI in Forex Trading: Trend Ko Samajhne Ka Zariya

            1.1 DMI Ka Taaruf: DMI, yaani Directional Movement Index, ek technical indicator hai jo traders ko market ke trend direction ko samajhne mein madad deta hai. Ye indicator market mein trend strength aur trend reversal ke signals ko detect karne mein istemal hota hai.

            1.2 DMI Ke Usool:
            • DMI, Wilder's Directional Movement System par mabni hai, jo ke market ke trend ko measure karne ke liye tajaweezat deti hai.
            • DMI indicator ko tijarat ke charts par add karke, traders ko trend strength aur potential trend reversal ke baray mein malumat milti hai.

            2. DMI Aur Trading Strategies:

            2.1 DMI Aur Trend Strength:
            • DMI indicator, traders ko market mein trend strength ko samajhne mein madad karta hai. Agar positive DMI line zyada ho, to ye bullish trend ko darust karta hai, aur agar negative DMI line zyada ho, to ye bearish trend ko darust karta hai.

            2.2 ADX Line Aur Trend Reversal:
            • DMI ka ek component hai ADX (Average Directional Index) line, jo trend reversal ko indicate karti hai.
            • Agar ADX line tezi se barh rahi hai, to ye indicate karta hai ke market mein trend strong hai, lekin agar ADX line kam ho rahi hai, to ye trend reversal hone ki indication hai.


            3. Pakistan Ki Chat Language Mein DMI:

            Pakistan ki chat language mein, traders ko ye samajhna zaroori hai ke DMI indicator kaise kaam karta hai aur iske kya faide hain. Chat language ka istemal karke, traders apne tajaweezat aur trading strategies ko aapas mein share karte hain.

            4. Muqabala Aur Faisla:

            4.1 DMI Aur Forex Trading:
            • DMI, traders ko market ke trend direction aur strength ke bare mein malumat farahem karta hai.
            • Traders ko chahiye ke wo is indicator ke signals ko sahi tareeqe se interpret karain aur apne trading decisions mein iska istemal karein.

            4.2 Faisla:
            • Pakistan ki chat language mein, traders ko ye malumat hasil karna zaroori hai ke DMI indicator kaise kaam karta hai aur iske sahi tareeqa se istemal kaise karna hai.
            • Is information ko samajhne ke liye traders ko constant learning aur apne experiences ko share karna chahiye, taki unki trading journey mein behtar taur par agay barha ja sake.


            5. Conclusion:

            Pakistan ki chat language mein, traders ko ye samajhna zaroori hai ke DMI indicator aur ADX line unke trading decisions mein kaise madadgar ho sakta hai. Is indicator ko samajh kar, traders apne trading strategies ko optimize karke market ke potential movements ko sahi taur par anticipate kar sakte hain.

            Last edited by ; 23-02-2024, 06:46 PM.
            • #7 Collapse

              **Forex Trading Mein DMI Kya Hai?**
              Forex trading mein, DMI (Directional Movement Index) ek powerful technical analysis tool hai jo market trends aur price movements ko analyze karne mein madad karta hai. Yeh indicator trend identification aur strength measurement ke liye use hota hai, aur traders ko market ke direction aur potential reversals ko samajhne mein help karta hai. Is post mein, hum DMI ke components aur iska forex trading mein istemal discuss karenge.

              **DMI Ka Basic Concept:**

              Directional Movement Index (DMI) ko J. Welles Wilder ne develop kiya tha aur yeh indicator trend strength aur direction ko measure karne ke liye design kiya gaya hai. DMI do main components par based hai: Positive Directional Indicator (DI+) aur Negative Directional Indicator (DI-). In components ko combine karke, DMI market ki overall trend aur momentum ko analyze karta hai.

              **DMI Ke Components:**

              1. **Positive Directional Indicator (DI+):** DI+ indicator market ki upward movement ko measure karta hai. Yeh component market ke bullish trend ke strength ko reflect karta hai aur price movements ke positive direction ko indicate karta hai.

              2. **Negative Directional Indicator (DI-):** DI- indicator market ki downward movement ko measure karta hai. Yeh component market ke bearish trend ke strength ko reflect karta hai aur price movements ke negative direction ko indicate karta hai.

              3. **Average Directional Index (ADX):** ADX indicator DMI ke components ke sath combine hota hai aur market ke trend strength ko measure karta hai. ADX ki value market ke trend ki strength ko quantify karti hai, jisse traders ko trend ke strong ya weak hone ka indication milta hai.

              **DMI Ka Analysis Aur Istamal:**

              1. **Trend Identification:** DMI ka primary use market ke trend ko identify karna hai. Jab DI+ line DI- line ko cross karti hai, to yeh bullish trend ko indicate karta hai, aur jab DI- line DI+ line ko cross karti hai, to yeh bearish trend ko indicate karta hai.

              2. **Trend Strength:** ADX indicator trend ki strength ko measure karta hai. High ADX value strong trend aur low ADX value weak trend ko reflect karti hai. Traders ADX ka use karke trend ke momentum aur sustainability ko evaluate karte hain.

              3. **Trading Signals:** DMI aur ADX ka combination trading signals generate karta hai. Jab DI+ line DI- line ke upar hoti hai aur ADX high value show karta hai, to yeh buy signal ho sakta hai. Conversely, jab DI- line DI+ line ke upar hoti hai aur ADX high value show karta hai, to yeh sell signal ho sakta hai.

              4. **Risk Management:** DMI ka use risk management mein bhi hota hai. Trend strength aur direction ko analyze karke, traders stop-loss aur take-profit levels ko set kar sakte hain, jo risk ko manage karne aur trading positions ko protect karne mein madad karta hai.

              **Nihayat Ahem:**

              DMI (Directional Movement Index) forex trading mein trend identification aur strength measurement ke liye ek valuable tool hai. DI+ aur DI- components ke saath ADX ka use karke, traders market ke trends aur momentum ko effectively analyze kar sakte hain. Isse trading decisions ko enhance kiya ja sakta hai aur market ke fluctuations se better cope kiya ja sakta hai. DMI ko apni trading strategy ka part banakar, traders market ke direction aur trend strength ko accurately gauge kar sakte hain.
              • #8 Collapse

                **Zigzag Pattern Forex Mein Kya Hai? - Roman Urdu Mein Tashreeh**
                1. **Introduction:**
                - Zigzag pattern ek technical analysis tool hai jo price movement ko filter karke significant trends aur reversals identify karne mein madad karta hai.
                - Yeh pattern traders ko market ke major swings aur correction phases ko samajhne mein help karta hai.

                2. **Zigzag Pattern Ki Definition:**
                - **Concept:** Zigzag pattern ek price movement ko simplify karta hai, jahan market ek direction mein move karta hai, phir reverse hota hai, aur phir dobara apne asli direction mein continue karta hai.
                - **Structure:** Is pattern mein ek series of connected lines hoti hain jo highs aur lows ko connect karte hain, aur price ka trend aur reversal points ko highlight karte hain.

                3. **Pattern Ki Formation:**
                - **Zigzag Lines:**
                - **Highs aur Lows:** Zigzag pattern mein, lines market ke highs aur lows ko connect karti hain taake overall trend ko depict kiya ja sake.
                - **Filtering Noise:** Is pattern ka main purpose market noise ko filter karna hota hai taake sirf significant price movements ko highlight kiya ja sake.
                - **Retracement Levels:**
                - **Measurement:** Zigzag pattern ko retracement levels ko measure karne ke liye bhi use kiya jata hai. Yeh levels typically 38.2%, 50%, aur 61.8% Fibonacci levels ke as-paas hote hain.

                4. **Pattern Ki Characteristics:**
                - **Trend Identification:** Zigzag pattern trending markets mein zyada effective hota hai, kyunki yeh clear trend direction ko show karta hai.
                - **Customizable Parameters:** Zigzag pattern mein parameters ko customize kiya ja sakta hai, jese ke percentage retracement ya point movement, taake yeh pattern specific market conditions ke liye suit ho jaye.
                - **No Lag:** Yeh pattern real-time price action par based hota hai, is liye yeh lag-free hai aur instant market feedback provide karta hai.

                5. **Trading Strategy with Zigzag Pattern:**
                - **Trend Following:**
                - **Bullish Trend:** Jab Zigzag pattern upward direction mein ho, to yeh bullish trend ka indication hota hai. Traders isko buy signal ke tor par use karte hain.
                - **Bearish Trend:** Agar Zigzag pattern downward direction mein ho, to yeh bearish trend ka signal hota hai. Traders isko sell signal ke tor par use karte hain.
                - **Reversal Identification:**
                - **Buying Opportunity:** Jab Zigzag pattern downward correction ke baad upward move kare, to yeh buying opportunity ho sakti hai.
                - **Selling Opportunity:** Agar Zigzag pattern upward correction ke baad downward move kare, to yeh selling opportunity ho sakti hai.
                - **Stop Loss Placement:** Stop loss ko last significant low (bullish case) ya high (bearish case) ke neeche set kiya jata hai taake risk ko control mein rakha ja sake.

                6. **Advantages of Zigzag Pattern:**
                - **Market Noise Reduction:** Zigzag pattern market noise ko filter karke clear trend ko highlight karta hai, jo trading decisions ko asaan banata hai.
                - **Trend Clarity:** Yeh pattern trends aur reversals ko simple aur visual way mein represent karta hai, jo beginners ke liye bhi understandable hota hai.
                - **Customizable:** Is pattern ke parameters ko customize karke different market conditions ke liye adjust kiya ja sakta hai.

                7. **Disadvantages of Zigzag Pattern:**
                - **False Signals:** Kabhi kabar Zigzag pattern chhoti price movements ko significant samajh leta hai, jo false signals ka sabab ban sakte hain.
                - **Lagging Indicator:** Yeh pattern real-time price action ko follow karta hai, lekin kabhi kabhi trend reversal ke baad signal de sakta hai, jo late entry ka risk badhata hai.
                - **Over-Optimization:** Parameters ko zyada customize karne se pattern ki effectiveness kam ho sakti hai, kyunki over-optimized pattern market reality se door ho sakta hai.

                8. **Conclusion:**
                - Zigzag pattern ek powerful tool hai jo forex trading mein trend aur reversal points ko identify karne mein madad karta hai.
                - Yeh pattern trading strategies ko enhance karne ke liye use hota hai, lekin isko dusre indicators aur analysis tools ke sath combine karna zaroori hai taake zyada accurate trading decisions liye ja sakein.
                - Zigzag pattern ke sath disciplined risk management practices ko follow karna important hai taake trading ke dauran losses ko minimize kiya ja sake.
                • #9 Collapse

                  DMI (Directional Movement Index) Kya Hai?


                  DMI (Directional Movement Index) ek technical analysis ka tool hai jo forex trading mein market ki trend ko pehchanne aur momentum ko samajhne ke liye istemal hota hai. Yeh indicator, J. Welles Wilder Jr. ne develop kiya tha aur yeh price action aur volatility ko analyse karta hai. Iska maksad yeh hai ke traders ko yeh samajh aay ke market bullish hai ya bearish.
                  DMI Ka Formula


                  DMI ka calculation do components par mabni hai: +DI (Positive Directional Indicator) aur -DI (Negative Directional Indicator). Iske alawa, DMI ko Average True Range (ATR) se bhi integrate kiya jata hai. Formula kuch is tarah hai:
                  • +DI = (Current High - Previous High) / ATR
                  • -DI = (Previous Low - Current Low) / ATR

                  Yeh formulas market ke trend ki strength aur direction ko samajhne mein madad karte hain.
                  DMI Ka Istemaal


                  Traders DMI ko trend ki direction aur strength ko identify karne ke liye istemal karte hain. Jab +DI -DI se upar hota hai, toh yeh bullish signal hota hai, aur jab -DI +DI se upar hota hai, toh yeh bearish signal hota hai. Iske ilawa, DMI ki value 20 se 25 ke beech hoti hai jab market stable hota hai aur 40 se zyada hoti hai jab market volatile hota hai.
                  DMI Indicator Ki Components


                  DMI ka indicator teen components par mabni hota hai:
                  1. +DI (Positive Directional Indicator): Yeh bullish trend ko dikhata hai.
                  2. -DI (Negative Directional Indicator): Yeh bearish trend ko dikhata hai.
                  3. ADX (Average Directional Index): Yeh trend ki strength ko measure karta hai. ADX ki value 20 se 25 ke beech stable market aur 40 se upar volatile market ko dikhata hai.
                  DMI Aur ADX Ki Importance


                  DMI ki performance ADX ke sath closely related hai. Jab ADX ki value 25 se upar hoti hai, toh iska matlab hai ke market mein strong trend hai. Isse traders ko clear direction milta hai ke unhe kis direction mein trade karna chahiye.
                  DMI Ka Trend Analysis


                  Trend analysis ke liye DMI ka istemal karte waqt, traders ko yeh dekhna chahiye ke kya +DI aur -DI ki crossovers ho rahe hain. Agar +DI -DI ko cross karta hai, toh yeh bullish signal hota hai, jabke agar -DI +DI ko cross karta hai, toh yeh bearish signal hota hai. Yeh crossovers trading opportunities create karte hain.
                  DMI Ka Use Strategy Mein


                  DMI ko trading strategy mein shamil karte waqt traders ko kuch chizein yaad rakhni chahiye. Sabse pehle, trend ki direction samajhna zaroori hai. Jab market mein strong trend ho, tab DMI ko dekhna behtar hota hai.
                  DMI Ki Limitations


                  Har technical indicator ki tarah, DMI ki bhi kuch limitations hain. Yeh kabhi kabhi false signals de sakta hai, khas taur par ranging markets mein. Isliye, traders ko hamesha DMI ke sath sath doosre indicators bhi istemal karne chahiye.
                  DMI Ko Kaise Interpret Karein


                  DMI ko interpret karne ke liye, traders ko +DI aur -DI ke crossovers par focus karna chahiye. Agar +DI -DI ko cross karta hai aur ADX ki value bhi 20 se zyada hai, toh yeh bullish signal hota hai. Aur agar -DI +DI ko cross karta hai toh yeh bearish signal hota hai.
                  DMI Ka Use Different Time Frames Mein


                  DMI ka istemal har time frame mein kiya ja sakta hai, lekin har time frame ki apni significance hoti hai. Short-term traders 5-minute ya 15-minute charts par DMI ka istemal kar sakte hain, jabke long-term traders daily ya weekly charts par isse dekh sakte hain.
                  DMI Aur Risk Management


                  Risk management trading ka ek important aspect hai. DMI ko risk management strategies mein shamil karne se traders ko better decision-making mein madad milti hai. Agar DMI bullish signal de raha hai, toh traders stop loss ko higher levels par rakh sakte hain.
                  DMI Ki Psychological Aspects


                  DMI ke psychological aspects bhi hote hain. Market participants ka reaction DMI ke signals par bhi depend karta hai. Agar traders ko lagta hai ke market mein trend hai, toh woh zyada trading karte hain, jo ke market ki volatility ko badha sakta hai.
                  DMI Ka Backtesting


                  Backtesting DMI ke signals ko analyse karne ka ek acha tareeqa hai. Traders historical data ko use karke dekh sakte hain ke DMI ke signals ne kis tarah se kaam kiya hai. Isse unhe apni strategy ko refine karne ka mauka milta hai.
                  DMI Ki Future Potential


                  DMI ka future potential bright hai, kyunki yeh market ki direction aur momentum ko samajhne ke liye ek effective tool hai. Isse na sirf forex trading mein, balki stocks aur commodities trading mein bhi istemal kiya ja sakta hai.
                  Conclusion


                  DMI (Directional Movement Index) forex trading ka ek aham tool hai jo traders ko market ki direction aur strength ko samajhne mein madad karta hai. Iska istemal karte waqt traders ko crossovers, ADX ki value, aur risk management strategies ko dhyan mein rakhna chahiye. DMI ka use karne se traders ko market ki better analysis karne aur profitable trades execute karne mein madad milti hai.

                  • #10 Collapse

                    What is dmi in forex trading?

                    DMI ka matlab hai Directional Movement Index, jo ek technical indicator hai jo forex trading mein price trends ko analyze karne ke liye use hota hai. Is indicator ka primary maqsad ye dekhna hota hai ke market mein trend ka rukh kis taraf hai aur kitni strength ke saath hai. DMI ko 1978 mein J. Welles Wilder ne introduce kiya tha, jo ek mashhoor technical analyst hain aur unhon ne bohot se ahem indicators diye hain, jaise ke RSI (Relative Strength Index) aur ATR (Average True Range).

                    DMI ka structure:

                    DMI actually teen lines par mushtamil hota hai:
                    1. +DI (Positive Directional Indicator): Ye line dikhati hai ke bullish trend (upar ka rukh) kitna mazboot hai. Jab price upar jati hai, to ye +DI line upar ki taraf move karti hai.
                    2. -DI (Negative Directional Indicator): Ye line bearish trend (neeche ka rukh) ko dikhati hai. Jab price neeche girti hai, to ye -DI line upar ki taraf move karti hai.
                    3. ADX (Average Directional Index): ADX DMI ka ahem hissa hai aur ye is baat ka ta'ayyun karta hai ke trend kitna mazboot ya kamzor hai, chahe wo bullish ho ya bearish. Agar ADX ka value 25 se zyada ho, to iska matlab hota hai ke market mein ek mazboot trend hai. Agar ADX ka value 20 se neeche ho, to iska matlab hai ke market mein koi khaas trend nahi hai.

                    DMI ko kaise use kiya jata hai:
                    1. Trend Identification: DMI traders ko madad deta hai ke wo market ka trend identify kar sakein. Jab +DI line -DI line se upar ho, to iska matlab hota hai ke bullish trend mazboot hai, aur jab -DI line +DI line se upar ho, to iska matlab bearish trend hai.
                    2. Trend Strength: ADX line use karke traders ye andaza lagate hain ke trend kitna strong hai. Agar ADX 25 se zyada ho, to wo signal deta hai ke trend significant hai aur trading ke laayak hai.
                    3. Entry aur Exit Points: DMI signals ko traders entry aur exit points ke liye use karte hain. Jab +DI line -DI ko cross kare upar ki taraf, to wo ek buy signal hota hai, aur jab -DI line +DI ko cross kare neeche ki taraf, to wo sell signal hota hai.

                    Conclusion:

                    DMI ek powerful tool hai jo forex traders ko market ke trends ko samajhne mein madad deta hai. Lekin, jaise har technical indicator, isko bhi doosray indicators ke saath use karna behtar hota hai taake ek complete trading strategy ban sake aur galat signals se bacha ja sake.
                    • #11 Collapse

                      DMI Forex Trading Mein Kya Hai?

                      DMI ka matlab hai Directional Movement Index. Yeh ek aisa technical indicator hai jo market ki trend strength ko measure karta hai. Forex trading mein, DMI ka use karna aapko yeh samajhnay mein madad deta hai ke market kis direction mein move kar raha hai aur kitni strength ke sath move kar raha hai. Is indicator ka use mostly trend-following traders karte hain, jo un trends ke sath trade karte hain jo mazid strong honay ki potential rakhte hain.

                      DMI ke Components

                      DMI ke 3 basic components hote hain:
                      1. +DI (Positive Directional Indicator): Yeh indicator market ki upward movement ko track karta hai. Jab yeh high hota hai, iska matlab hota hai ke buyers market mein dominate kar rahe hain aur price upward ja raha hai.
                      2. -DI (Negative Directional Indicator): Yeh downward movement ko track karta hai. Jab yeh high hota hai, iska matlab hota hai ke sellers dominate kar rahe hain aur price neeche ja raha hai.
                      3. ADX (Average Directional Index): ADX DMI ka ek bohat important hissa hai. Yeh trend ki strength ko measure karta hai, lekin yeh yeh nahi batata ke trend kis direction mein hai. ADX sirf yeh batata hai ke trend kitna strong ya weak hai.

                      DMI ka Kaam Kaise Hota Hai?

                      DMI ka main kaam yeh hai ke yeh +DI aur -DI ko compare karta hai. Agar +DI -DI se zyada hai, toh yeh signal hota hai ke bullish trend hai, yani price upar ja raha hai. Agar -DI +DI se zyada hai, toh yeh bearish trend ka signal hota hai, yani price neeche ja raha hai.

                      Iske ilawa, jab ADX ka value 25 se zyada hoti hai, toh yeh signal hota hai ke market mein strong trend hai, chahe woh bullish ho ya bearish. Agar ADX 25 se neeche hai, toh yeh weak trend ka signal hota hai, jisme market sideways ya choppy hoti hai.

                      DMI Forex Trading Mein Kyun Zaroori Hai?

                      DMI ko samajhna aur use karna aapko trading mein bohot faida de sakta hai, kyun ke yeh aapko market ke direction aur trend ki strength ka idea deta hai. Is se aap yeh samajh sakte hain ke kab market mein entry leni hai aur kab exit karni hai.

                      For example, agar aap dekhein ke +DI -DI se zyada hai aur ADX ka value bhi high hai, toh yeh ek bullish trend ka signal hota hai, aur yeh waqt ho sakta hai ke aap long position mein entry karein. Isi tarah, agar -DI zyada hai aur ADX ka value high hai, toh yeh bearish trend ka signal hota hai, aur yeh short sell ka waqt ho sakta hai.

                      DMI Ko Use Karne Ke Limitations

                      Lekin yaad rakhein ke DMI bhi kisi aur indicator ki tarah perfect nahi hota. Iska ek main limitation yeh hai ke yeh sideways market ya range-bound market mein sahi signals nahi deta. Jab market trend nahi kar rahi hoti, toh DMI ke signals misleading ho sakte hain. Is liye, DMI ko doosre indicators, jaise ke moving averages ya support and resistance levels ke sath use karna best practice hai.

                      Conclusively, DMI ek powerful tool hai, lekin isse sahi tareeqe se use karna trading success ka key hai.
                      • #12 Collapse

                        DMI in Forex Trading: Ek Tafseel

                        DMI Kya Hai?


                        DMI, yaani Directional Movement Index, ek technical analysis tool hai jo forex trading mein price trends ko identify karne ke liye istemal hota hai. Isay J. Welles Wilder ne develop kiya tha aur yeh traders ko price movements ki strength aur direction ka andaza lagane mein madad karta hai.
                        DMI Ki Buniyadi Components


                        DMI teen main components par mabni hota hai: +DI (Positive Directional Indicator), -DI (Negative Directional Indicator), aur ADX (Average Directional Index). In teen components ki madad se traders ko market ke bullish ya bearish trend ka pata chalta hai.
                        +DI Aur -DI Kya Hain?


                        +DMI price ki upward movement ki strength ko darshata hai jabke -DI downward movement ki strength ko. Jab +DI -DI se upar hota hai, toh yeh bullish signal hota hai, aur jab -DI +DI se upar hota hai, toh yeh bearish signal hota hai.
                        ADX Kya Hai?


                        ADX market ki trend ki strength ko measure karta hai. Iska score 0 se 100 tak hota hai, jahan 20 se kam score trendless market ko darshata hai, aur 25 se zyada score strong trend ko. Iska istemal trend ke strength ko evaluate karne ke liye hota hai.
                        DMI Ka Calculation Kaise Kiya Jata Hai?


                        DMI ka calculation thoda complex hai, lekin isay kuch steps mein simplify kiya ja sakta hai. Pehle, +DI aur -DI ko calculate kiya jata hai, phir ADX ka score tayyar kiya jata hai. Iske liye price movements ko analyze karna parta hai.
                        DMI Ka Istemal Trading Strategies Mein


                        DMI ka istemal alag-alag trading strategies mein kiya jata hai. Yahan kuch popular strategies hain:
                        1. Crossovers: Jab +DI -DI ko cross karta hai, yeh entry aur exit points ka indication hota hai.
                        2. ADX Trend Strength: Agar ADX 25 se upar hai, toh trader ko strong trend mein trade karna chahiye.
                        DMI Ke Saath Other Indicators Ka Istemal


                        DMI ko aur indicators ke saath istemal karna bhi faydemand ho sakta hai. Misal ke taur par, Moving Averages ya RSI ke sath combination use karke better signals generate kiye ja sakte hain.
                        DMI Ke Fayde
                        1. Trend Identification: DMI traders ko trend ko identify karne mein madad karta hai, jo unki trading decisions ko enhance karta hai.
                        2. Entry aur Exit Points: DMI clear entry aur exit points provide karta hai, jo profitable trades ke liye zaroori hai.
                        DMI Ke Nuqsan
                        1. Lagging Indicator: DMI ek lagging indicator hai, jo ke pehle se price movements ko analyze karta hai. Isliye, yeh kabhi kabhi late signals de sakta hai.
                        2. False Signals: Market ki volatility ke wajah se DMI false signals bhi de sakta hai, isliye isay dusre indicators ke sath confirm karna chahiye.
                        DMI Ki Limitations


                        DMI har market condition mein achha kaam nahi karta. Jab market sideway ya ranging hoti hai, toh DMI ke signals misleading ho sakte hain. Isliye, market ki overall condition ka analysis zaroori hai.
                        DMI Ka Psychological Aspect


                        Traders ke liye DMI ka psychological impact bhi hota hai. Jab traders DMI ka istemal karte hain, toh unki trading decisions pe confidence aur discipline barhta hai. Yeh unhe impulsive trading se bachata hai.
                        DMI Aur Risk Management


                        Risk management trading ka ek aham hissa hai. DMI ko risk management ke tools ke sath integrate karke traders apne losses ko minimize kar sakte hain. Stop-loss orders ka istemal DMI signals ke saath kiya ja sakta hai.
                        DMI Ki Practical Application


                        Forex trading mein DMI ka istemal kaise kiya jaye, iski ek practical example lete hain. Agar +DI -DI ko cross kar raha hai aur ADX bhi 25 ke upar hai, toh yeh strong buy signal hota hai. Is signal ko use karke traders entry le sakte hain.
                        DMI Ke Sath Backtesting


                        Backtesting DMI signals ko verify karne ka ek acha tareeqa hai. Historical data ka analysis kar ke traders jaan sakte hain ke DMI kis tarah se past trends ke sath behave kiya hai aur kya unke strategies effective rahe hain.
                        DMI Ki Conclusion


                        DMI forex trading ka ek powerful tool hai jo traders ko market trends aur movements ko samajhne mein madad karta hai. Iska sahi istemal karne se traders apne trades ki accuracy barha sakte hain. Lekin, isay hamesha dusre indicators ke sath milakar istemal karna chahiye taake false signals se bacha ja sake. DMI ko samajhne aur istemal karne se aap apni trading strategies ko behter bana sakte hain aur profitable trades hasil kar sakte hain.
                        • #13 Collapse

                          What is DMI in Forex Trading?


                          DMI ka full form hai Directional Movement Index, jo ek technical indicator hai. Is indicator ka use traders karte hain market ki trend strength ko measure karne ke liye. Yeh indicator price movement ka analysis karta hai aur batata hai ke market trend upward hai, downward hai ya phir koi clear trend nahi hai.

                          DMI ko J. Welles Wilder ne develop kiya tha, jo ek mashhoor technical analyst hain. DMI ka aik important hissa ADX (Average Directional Index) hota hai, jo trend ki strength ko quantify karta hai.
                          Components of DMI


                          DMI teen main components par mabni hota hai:
                          1. +DI (Positive Directional Indicator): Yeh indicator bullish trends ko measure karta hai. Jab +DI upar ho, to yeh indicate karta hai ke market mein upward movement hai.
                          2. -DI (Negative Directional Indicator): Yeh bearish trends ko measure karta hai. Jab -DI upar ho, to yeh batata hai ke market mein downward movement hai.
                          3. ADX (Average Directional Index): ADX yeh nahi batata ke market bullish hai ya bearish. Balki yeh sirf trend ki strength ko measure karta hai. ADX jab 25 se zyada hota hai, to yeh strong trend ko indicate karta hai, aur jab 20 se kam hota hai to yeh weak trend ya no trend ko batata hai.

                          How DMI Works


                          DMI price ke highs aur lows ko analyze karta hai aur unhe compare karta hai taake trend direction ka pata chale. Jab +DI -DI se zyada hota hai, to bullish trend hota hai, aur jab -DI +DI se zyada hota hai to bearish trend hota hai. ADX sirf yeh check karta hai ke jo trend hai wo kitna strong hai.

                          For example:
                          • Agar +DI -DI se cross kar jaye upar, aur ADX bhi 25 se zyada ho, to yeh confirmation hoti hai ke bullish trend strong hai.
                          • Agar -DI +DI se upar ho, aur ADX bhi high ho, to yeh bearish trend ki strength batata hai.

                          How to Use DMI in Trading


                          1. Identify the Trend: Jab +DI -DI ko cross kar jaye, to yeh signal hota hai ke market bullish trend mein hai. Aur agar -DI +DI ko cross kar jaye to yeh bearish trend ka signal hota hai.

                          2. Trend Strength: ADX ko dekha jata hai taake yeh pata chale ke trend kitna strong hai. Agar ADX 20 se kam hai, to market sideway move kar raha hota hai. Agar ADX 25 se zyada ho, to trend mazid strong hota jata hai.

                          3. Combine with Other Indicators: DMI ko akela use nahi kiya jata. Isay aur technical indicators ke sath mila kar trading decisions liye jate hain, jaise ke Moving Averages ya RSI (Relative Strength Index).
                          Example of DMI in Action


                          Agar market mein aapko lagta hai ke ek strong bullish trend shuru ho raha hai, to aap +DI aur -DI ko observe karenge. Agar +DI ne -DI ko cross kar diya hai aur ADX bhi high hai, to aapko confirmation mil jati hai ke bullish trend strong hai, aur yeh time ho sakta hai buy order lagane ka.

                          Isi tarah agar -DI ne +DI ko cross kiya ho, aur ADX 25 se upar ho, to yeh bearish trend ka signal hota hai, aur aap sell order place kar sakte hain.
                          Benefits of Using DMI
                          1. Trend Identification: DMI aapko jaldi se bata deta hai ke market mein koi trend hai ya nahi, aur agar hai to wo bullish hai ya bearish.
                          2. Trend Strength Measurement: ADX ke zariye aap yeh jaan sakte hain ke jo trend follow kar rahe hain wo kitna strong hai. Agar ADX 25 ya us se zyada ho, to aapko strong trend ka pata chalta hai.
                          3. Works Well in Trending Markets: DMI trending markets mein kaafi accurate hota hai. Yeh sideways ya choppy markets mein kam useful hota hai, lekin trending markets ke liye bohat effective hota hai.
                          4. Combines Well with Other Indicators: Aap DMI ko dusre indicators ke sath mila kar better trading signals hasil kar sakte hain, jaise ke Moving Averages, RSI ya Stochastic.

                          Limitations of DMI


                          1. Sideways Markets mein kamzor: Jahan tak trending markets ka taluq hai, wahan DMI kaafi useful hota hai. Lekin jab market sideways move karta hai, tab DMI se false signals mil sakte hain.

                          2. Lagging Indicator: DMI ek lagging indicator hai, matlab yeh price movement ke baad trend ko identify karta hai. Iska matlab yeh hai ke kabhi kabhi yeh late signals de sakta hai.

                          3. Requires Confirmation: DMI ko akela use karna risky ho sakta hai, is liye traders usually isay dusre indicators ke sath combine karte hain taake confirmation mil sake aur false signals se bacha ja sake.
                          Conclusion


                          DMI ek powerful tool hai jo market trends ko identify aur unki strength ko measure karta hai. Isay forex trading mein istamaal kar ke aap ko pata chal sakta hai ke market upward trend mein hai ya downward, aur us trend ki strength kitni hai. Lekin hamesha yaad rakhiye ke isay dusre indicators ke sath mila kar use karna zaroori hota hai, taake better trading decisions liye ja sake.

                          Agar aap DMI ko achi tarah samajh kar istemal karein, to yeh aapki trading strategy ko bohot improve kar sakta hai, khaaskar agar aap trending markets mein trade karte hain.


                          4o


                          What is DMI in Forex Trading? DMI ka full form hai Directional Movement Index, jo ek technical indicator hai. Is indicator ka use traders karte hain market ki trend strength ko measure karne ke liye. Yeh indicator price movement ka analysis karta hai aur batata hai ke market trend upward hai, downward hai ya phir koi clear trend nahi hai.

                          DMI ko J. Welles Wilder ne develop kiya tha, jo ek mashhoor technical analyst hain. DMI ka aik important hissa ADX (Average Directional Index) hota hai, jo trend ki strength ko quantify karta hai.

                          Components of DMI
                          DMI teen main components par mabni hota hai:

                          +DI (Positive Directional Indicator): Yeh indicator bullish trends ko measure karta hai. Jab +DI upar ho, to yeh indicate karta hai ke market mein upward movement hai.

                          -DI (Negative Directional Indicator): Yeh bearish trends ko measure karta hai. Jab -DI upar ho, to yeh batata hai ke market mein downward movement hai.

                          ADX (Average Directional Index): ADX yeh nahi batata ke market bullish hai ya bearish. Balki yeh sirf trend ki strength ko measure karta hai. ADX jab 25 se zyada hota hai, to yeh strong trend ko indicate karta hai, aur jab 20 se kam hota hai to yeh weak trend ya no trend ko batata hai.

                          How DMI Works
                          DMI price ke highs aur lows ko analyze karta hai aur unhe compare karta hai taake trend direction ka pata chale. Jab +DI -DI se zyada hota hai, to bullish trend hota hai, aur jab -DI +DI se zyada hota hai to bearish trend hota hai. ADX sirf yeh check karta hai ke jo trend hai wo kitna strong hai.

                          For example:

                          Agar +DI -DI se cross kar jaye upar, aur ADX bhi 25 se zyada ho, to yeh confirmation hoti hai ke bullish trend strong hai.
                          Agar -DI +DI se upar ho, aur ADX bhi high ho, to yeh bearish trend ki strength batata hai.
                          How to Use DMI in Trading
                          1. Identify the Trend: Jab +DI -DI ko cross kar jaye, to yeh signal hota hai ke market bullish trend mein hai. Aur agar -DI +DI ko cross kar jaye to yeh bearish trend ka signal hota hai.

                          2. Trend Strength: ADX ko dekha jata hai taake yeh pata chale ke trend kitna strong hai. Agar ADX 20 se kam hai, to market sideway move kar raha hota hai. Agar ADX 25 se zyada ho, to trend mazid strong hota jata hai.

                          3. Combine with Other Indicators: DMI ko akela use nahi kiya jata. Isay aur technical indicators ke sath mila kar trading decisions liye jate hain, jaise ke Moving Averages ya RSI (Relative Strength Index).

                          Example of DMI in Action
                          Agar market mein aapko lagta hai ke ek strong bullish trend shuru ho raha hai, to aap +DI aur -DI ko observe karenge. Agar +DI ne -DI ko cross kar diya hai aur ADX bhi high hai, to aapko confirmation mil jati hai ke bullish trend strong hai, aur yeh time ho sakta hai buy order lagane ka.

                          Isi tarah agar -DI ne +DI ko cross kiya ho, aur ADX 25 se upar ho, to yeh bearish trend ka signal hota hai, aur aap sell order place kar sakte hain.

                          Benefits of Using DMI
                          Trend Identification: DMI aapko jaldi se bata deta hai ke market mein koi trend hai ya nahi, aur agar hai to wo bullish hai ya bearish.

                          Trend Strength Measurement: ADX ke zariye aap yeh jaan sakte hain ke jo trend follow kar rahe hain wo kitna strong hai. Agar ADX 25 ya us se zyada ho, to aapko strong trend ka pata chalta hai.

                          Works Well in Trending Markets: DMI trending markets mein kaafi accurate hota hai. Yeh sideways ya choppy markets mein kam useful hota hai, lekin trending markets ke liye bohat effective hota hai.

                          Combines Well with Other Indicators: Aap DMI ko dusre indicators ke sath mila kar better trading signals hasil kar sakte hain, jaise ke Moving Averages, RSI ya Stochastic.

                          Limitations of DMI
                          1. Sideways Markets mein kamzor: Jahan tak trending markets ka taluq hai, wahan DMI kaafi useful hota hai. Lekin jab market sideways move karta hai, tab DMI se false signals mil sakte hain.

                          2. Lagging Indicator: DMI ek lagging indicator hai, matlab yeh price movement ke baad trend ko identify karta hai. Iska matlab yeh hai ke kabhi kabhi yeh late signals de sakta hai.

                          3. Requires Confirmation: DMI ko akela use karna risky ho sakta hai, is liye traders usually isay dusre indicators ke sath combine karte hain taake confirmation mil sake aur false signals se bacha ja sake.

                          Conclusion
                          DMI ek powerful tool hai jo market trends ko identify aur unki strength ko measure karta hai. Isay forex trading mein istamaal kar ke aap ko pata chal sakta hai ke market upward trend mein hai ya downward, aur us trend ki strength kitni hai. Lekin hamesha yaad rakhiye ke isay dusre indicators ke sath mila kar use karna zaroori hota hai, taake better trading decisions liye ja sake.

                          Agar aap DMI ko achi tarah samajh kar istemal karein, to yeh aapki trading strategy ko bohot improve kar sakta hai, khaaskar agar aap trending markets mein trade karte hain.


                          • <a href="https://www.instaforex.org/ru/?x=ruforum">InstaForex</a>
                          • #14 Collapse

                            ### DMI (Directional Movement Index) Kya Hai Forex Trading Mein?
                            **1. DMI Ki Bunyadi Samajh**
                            - DMI, yaani Directional Movement Index, ek technical analysis indicator hai jo market ki strength aur trend ki direction ko darshata hai.
                            - Is indicator ko J. Welles Wilder ne develop kiya tha aur yeh traders ko market ke trend ki analysis karne mein madad karta hai.
                            - DMI ko generally average true range (ATR) ke sath istemal kiya jata hai.

                            **2. DMI Ki Components**
                            - DMI teen components se mil kar bana hota hai:
                            - **+DI (Positive Directional Indicator):**
                            - Yeh indicator bullish movements ko darshata hai aur upward price movements ki strength ko measure karta hai.
                            - **-DI (Negative Directional Indicator):**
                            - Yeh bearish movements ko darshata hai aur downward price movements ki strength ko measure karta hai.
                            - **ADX (Average Directional Index):**
                            - ADX trend ki strength ko measure karta hai, lekin yeh trend ki direction nahi batata.

                            **3. DMI Ka Calculation**
                            - DMI ko calculate karne ke liye price movements ka analysis kiya jata hai.
                            - Pehle +DI aur -DI ki values ko calculate kiya jata hai, phir unka average nikaala jata hai.
                            - ADX ko 14-period ke liye calculate kiya jata hai.

                            **4. DMI Ke Signal Aur Interpretation**
                            - **Crossovers:**
                            - Jab +DI -DI ko upar se cross karta hai, to yeh bullish signal hota hai.
                            - Jab -DI +DI ko upar se cross karta hai, to yeh bearish signal hota hai.
                            - **ADX Ki Strength:**
                            - Agar ADX 20 se upar hai, to market mein strong trend hai.
                            - Agar ADX 20 se neeche hai, to market mein weak trend hai.

                            **5. Trading Strategies with DMI**
                            - DMI ko trading strategies mein istemal karne ke liye kuch techniques hain:
                            - **Trend Following:**
                            - Jab +DI upar ho aur ADX bhi strong ho, to long position kholen.
                            - Jab -DI upar ho aur ADX strong ho, to short position kholen.
                            - **Range Trading:**
                            - Agar ADX 20 se neeche hai, to traders support aur resistance levels par trade kar sakte hain.

                            **6. DMI Ke Faida**
                            - DMI market ki trend ki strength ko assess karne mein madad karta hai.
                            - Yeh traders ko accurate entry aur exit points identify karne mein madad deta hai.
                            - DMI ka istemal market ke volatility ko samajhne ke liye bhi hota hai.

                            **7. DMI Ke Challenges**
                            - DMI indicator kabhi-kabhi false signals bhi de sakta hai, khaaskar ranging markets mein.
                            - Isliye, isse doosre indicators ke sath combine karna behtar hota hai.
                            - Traders ko iski signals par reliance nahi karna chahiye, balki market ke fundamentals ko bhi consider karna chahiye.

                            **8. Conclusion**
                            - DMI Forex trading mein ek valuable tool hai jo market ki trend ki strength aur direction ko identify karne mein madad karta hai.
                            - Isse effectively istemal karne se traders apne trading decisions ko behtar bana sakte hain.
                            - Training aur practice se DMI ki effectiveness ko samajhna aur barhawa dena mumkin hai.

                            اب آن لائن

                            Working...
                            X