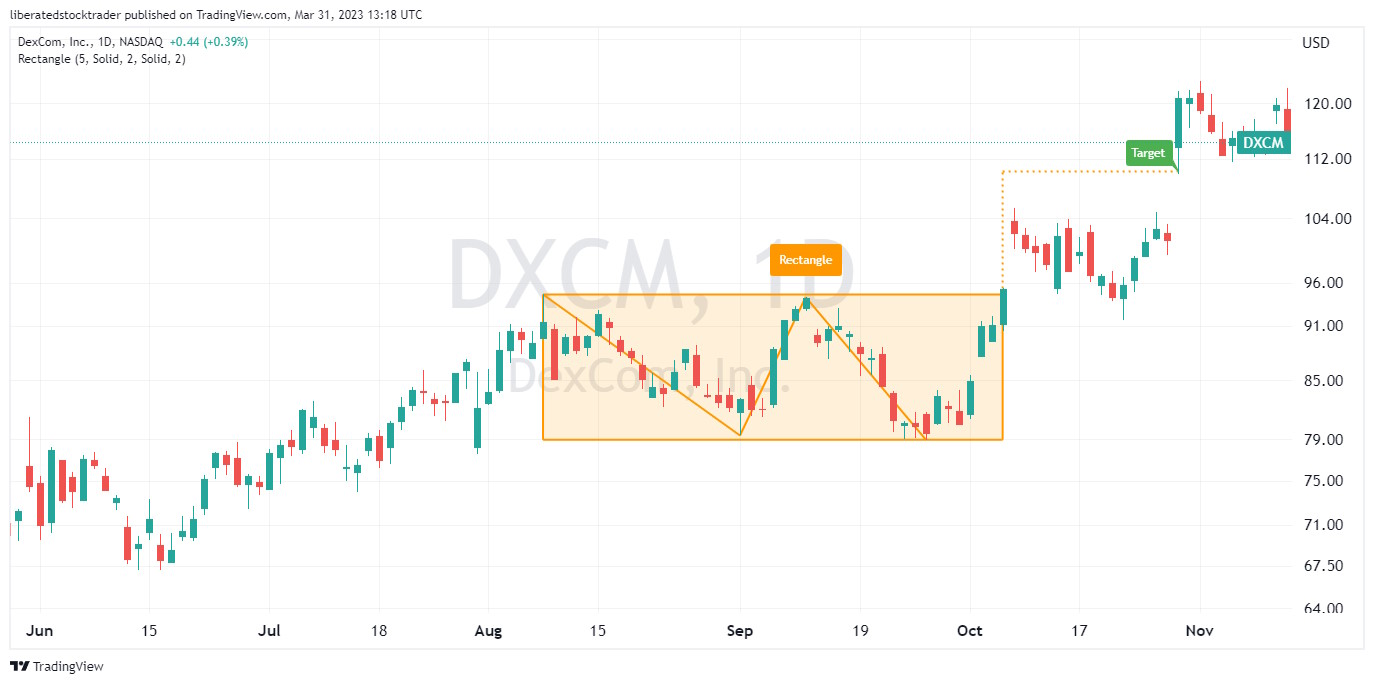
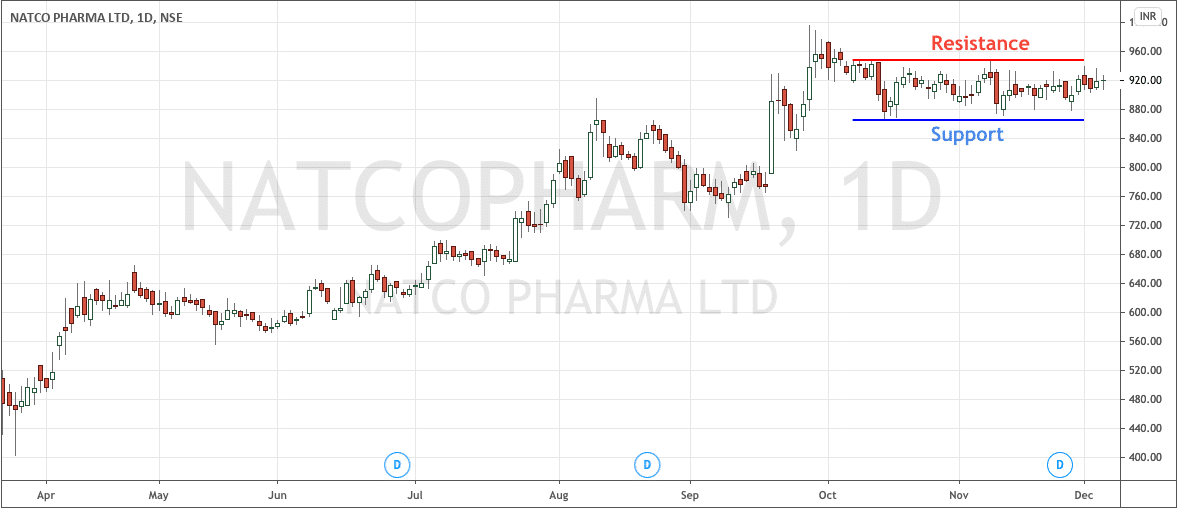
What's the Rectangle chart pattern.

No announcement yet.
`
X
  • وقت
  • دکھائیں
Clear All
new posts
  • #1 Collapse

    What's the Rectangle chart pattern.
    What's the Rectangle chart pattern


    Click image for larger version

Name:	images (5).jpeg
Views:	61
Size:	8.2 کلوبائٹ
ID:	12837321​​​​​​​
    Rectangle Chart Pattern (Chakor Chaart Naqsha)
    1. Mufasil Wazehat: Chakor chart pattern ek sideways trading range ko darust karta hai jahan price mein mazeed izafa ya kami nahi hoti. Yeh pattern typically bullish ya bearish trend ke doran paida hota hai jab price ek mukhtalif stage mein stagnant hoti hai.
    2. Shuruaati Nishan: Is pattern ki shuruaat mein, volume usually kam hoti hai aur price mein chand pataun ka chakor (rectangle) ban jata hai. Yeh dikhne mein ek flat aur stable trading range ko darust karta hai.
    3. Mukhtasir Nishan: Chakor chart pattern mein, price bars barabar lambay hote hain aur rectangle ki shakal ikhtiyaar karte hain. Yeh dikhne mein sideways movement ko darust karta hai jahan buyers aur sellers ke darmiyan equilibrium hota hai.
    4. Tasdiq: Jab price trading range se bahar nikalne ka intezar karta hai, volume ki tezi se iqrar hoti hai. Breakout ke baad, volume mein izafa hota hai jo price direction ki tasdiq karta hai. Agar breakout bullish hai, to volume ki tezi se izafa hota hai jo uptrend ko tasdiq karta hai. Agar breakout bearish hai, to volume ki tezi se izafa hota hai jo downtrend ko tasdiq karta hai.
    5. Trading Strategy: Chakor chart pattern ke breakout par traders ki strategy hoti hai ke woh price ke movement ki direction ko dekhte hue positions lein. Agar breakout bullish hai, to traders long positions le sakte hain. Agar breakout bearish hai, to traders short positions le sakte hain. Stop-loss aur take-profit levels ko bhi dhyan mein rakha jata hai.
    6. Muddaton Ka Maamla: Chakor chart pattern ke formation mein muddaton ka maamla hota hai, jisey samajhna traders ke liye zaroori hota hai. Kabhi kabhi trading range kafi lambi muddat tak bani rehti hai aur breakout ka intezar karna traders ko sabr ke sath rehne ki zaroorat hoti hai.
    Yeh sabhi factors mil kar ek traders ko chakor chart pattern ko samajhne aur us par trading karne mein madadgar hoti hain.


  • <a href="https://www.instaforex.org/ru/?x=ruforum">InstaForex</a>
  • #2 Collapse

    "Rectangle Chart Pattern" ---

    : Tafseel K Sath

    Rectangle chart pattern ek technical analysis tool hai jo market mein price consolidation aur future price movements ko identify karne ke liye istemal hota hai. Yeh pattern typically sideways trading range ko represent karta hai jahan buyers aur sellers ke darmiyan balance hota hai. Chaliye is pattern ke baare mein thoda aur tafseel se baat karte hain.

    Kya Hai Rectangle Chart Pattern

    Rectangle chart pattern ek continuation pattern hai jo market ke trend ka indication deta hai. Is pattern mein price ek horizontal trading range mein consolidate hota hai, jisse ek rectangle ya square shape ban jata hai. Yeh range usually kuch weeks ya months tak ho sakti hai. Rectangle pattern ke formation ke dauran, buyers aur sellers ke darmiyan ek tarah ka tug-of-war hota hai, jisme price stable rehta hai.

    Tafseel K Sath:

    1. Formation
    : Rectangle chart pattern ka formation market mein price consolidation ke baad hota hai jab market ke participants uncertain hote hain aur price ek range mein atak jata hai. Is pattern ke formation ke dauran, volume usually decrease hota hai, indicating ke market mein activity kam ho rahi hai.

    2. Breakout
    : Rectangle pattern ke breakout ka intezar kiya jata hai, jo usually ek directional movement ke saath hota hai. Agar price rectangle ke upper boundary ko break karta hai, toh ye bullish breakout kehlayega aur price kaafi zyada upar ja sakta hai. Agar price rectangle ke lower boundary ko break karta hai, toh ye bearish breakout kehlayega aur price niche ja sakta hai.

    3. Volume Confirmation
    Breakout ke saath volume ka confirmation bhi dekha jata hai. Agar breakout high volume ke saath hota hai, toh ye breakout ko strong aur reliable banata hai. Low volume breakout usually false signals ho sakte hain.

    Nuksanat:

    1. False Breakouts
    : Rectangle pattern mein false breakouts hone ka khatra hota hai, jisme price breakout ke baad bhi quickly reverse ho jata hai. Isliye, breakout ke confirmation ke liye volume ka dhyan dena zaroori hai.

    2. Market Volatility
    Rectangle pattern ke formation ke dauran market mein volatility kam hoti hai, jisse traders ko trading opportunities milne mein dikkat ho sakti hai.

    Nateeja:

    Rectangle chart pattern ek powerful technical tool hai jo traders ko market ke price movements ka direction samajhne mein madad karta hai. Magar iske istemal se pehle thorough analysis aur breakout confirmation ki zaroorat hoti hai. Saath hi, risk management ka bhi dhyan rakhna zaroori hai.

    ---
    .
    • #3 Collapse

      what is rectangle chart pattern

      forex market mein rectangle chart pattern aik kesam ka jaree chart pattern hota hey
      bhali kay badlay bhali
      • #4 Collapse

        What's the Rectangle chart pattern.

        Click image for larger version

Name:	download (30).png
Views:	54
Size:	3.4 کلوبائٹ
ID:	12837373

        Rectangle chart pattern ek technical analysis concept hai jo ke financial markets, jaise ke stock market ya forex market mein istemal hota hai. Yeh ek common price pattern hai jo traders aur investors ke liye market trends ko samajhne mein madad karta hai.

        Rectangle chart pattern ka naam iske shape se aaya hai, jo ki ek rectangle jaise dikhta hai jab aap market ki price action ko dekhte hain. Yeh pattern typically market mein consolidation phase ke doran ban sakta hai, jab price range-bound hoti hai aur kisi specific direction mein clear movement na ho.

        Rectangle chart pattern ko identify karne ke liye, aapko market ke price levels ko observe karna hota hai jo ek rectangle ya square ki shape mein form karte hain. Is pattern mein typically do parallel horizontal lines drawn kiye jaate hain jo support aur resistance levels ko represent karte hain. Price ek specific range mein consolidate hoti hai aur is pattern mein price swings typically kam hoti hain.

        Rectangle chart pattern ke mukhtalif variations hote hain, jaise ascending rectangle aur descending rectangle. Ascending rectangle mein, highs flat hote hain jabki lows gradually higher banate hain, jabki descending rectangle mein, lows flat hote hain aur highs gradually lower hote hain.

        Rectangle chart pattern ka ek mukhya maqsad hota hai market ka direction predict karna. Jab price rectangle ke andar move karta hai, traders support aur resistance levels ko observe karte hain. Agar price rectangle ke upper end se break karta hai, to yeh ek bullish signal hai aur traders long positions le sakte hain. Jab price rectangle ke lower end se break karta hai, to yeh ek bearish signal hai aur traders short positions le sakte hain.

        Rectangle chart pattern ka importance hai market trends ko identify karne mein. Jab market rectangle pattern mein hota hai, to yeh ek indication hota hai ke market range-bound hai aur kisi specific direction mein clear movement nahi hai. Traders is time mein caution maintain karte hain aur breakout ka wait karte hain jo ki price ke direction ko confirm karta hai.

        Rectangle chart pattern ke sath sath volume analysis bhi important hai. Breakout ke time volume ki increase hone se pattern ki strength confirm hoti hai. Agar breakout volume ke sath hota hai, to yeh ek strong indication hai ke market ka direction change ho sakta hai.

        Rectangle chart pattern ka istemal karne se pehle, traders ko dusre technical indicators aur market analysis tools ka bhi istemal karna chahiye. Iske alawa, stop-loss orders ka bhi istemal karna important hai taake losses ko minimize kiya ja sake agar trade galat direction mein chala gaya.

        Is tarah, rectangle chart pattern ek powerful tool hai market trends ko analyze karne aur trading decisions lene ke liye. Traders ko is pattern ko samajhna aur sahi tareeke se istemal karna chahiye taake woh market mein successful trading kar sakein.


        • #5 Collapse

          What's the rectangle chart pattern.

          Title: Rectangle Chart Pattern: Tijarat Mein Istemaal Hone Wala Banawat

          Rectangle chart pattern ek aham tijarat mein istemal hone wala banawat hai jo ke technical analysis ke zariye istemal hoti hai tijarat karne wale logon ki taraf se. Yeh ek muhim tool hai jise traders istemal karke market ki tijarat mein faida utha sakte hain. Rectangle pattern ek chart formation hai jise price action ke mutabiq tajaweezat ki jati hain.

          Banawat aur Tafseelat: Rectangle pattern ek aise chart formation ko darust karti hai jisme market mein ek mawafiq aur mutawazin faseel (range) banti hai. Is banawat mein, market ki qeemat (price) mein izafi tabdiliyon ke bawajood, aam taur par do mawafiqat (support aur resistance) rehti hain jo ek rectangle ya square ki surat mein zahir hoti hai.

          Aasani Se Pehchana Ja Sakta Hai: Rectangle pattern ko pehchana asan hota hai kyunki iska banawat seedha aur wazeh hota hai. Market mein qeemat mein izafi tabdiliyan hone ke bawajood, jab price ek aik level se doosre level tak chalti hai aur phir wapas pehle sey mutawazin level par wapas aati hai, to yeh rectangle pattern qaim hota hai.

          Trading Strategies: Rectangle pattern ko istemal karke traders apni tijarat ke liye tajaweezat bana sakte hain. Jab price rectangle ke andar hoti hai, toh traders mawafiqat ke level par khareedari ya farokht kar sakte hain. Agar price rectangle ke bahar nikal jati hai, toh yeh ek indication ho sakti hai ke market mein izafi rukawat (breakout) ho sakti hai, jo ke traders ke liye naye mauqe paida kar sakti hai.

          Hedging Aur Risk Management: Rectangle pattern ka istemal hedging aur risk management mein bhi hota hai. Agar trader dekhe ke market rectangle ke andar mutawazin hai, toh woh apne positions ko mawafiqat ke andar set karke apne nuqsaanat ko kam karne ke liye tayyar ho sakta hai.

          Akhri Khyal: Rectangle chart pattern ek asan aur mufeed tool hai jise traders istemal karke market ke rukh aur tajaweezat ko samajh sakte hain. Iske zariye, tijarat karne wale log market ke hawale se behtareen faislay kar sakte hain. Lekin, yaad rahe ke kisi bhi chart pattern ki kamyabi ke liye sahi waqt par sahi faisla lena zaroori hai.

          In conclusion, rectangle chart pattern tijarat karne wale logon ke liye aik ahem aur mufeed tool hai jo market ke rukh aur tajaweezat ko samajhne mein madad karta hai. Traders ko chahiye ke isay sahi taur par samajhein aur istemal karne ke liye tayyar rahein takay woh behtareen tijarat ke faide utha saken.
          • #6 Collapse

            What's the Rectangle chart pattern?
            The Rectangle chart pattern, also known as a trading range or congestion zone, is a technical analysis pattern that forms on a price chart when the price of an asset moves within a horizontal range or channel. This pattern typically occurs after a significant price movement and represents a period of consolidation or indecision in the market.

            Here is an explanation of the Rectangle chart pattern:
            1. Formation: The Rectangle pattern is characterized by parallel horizontal lines that represent the upper and lower boundaries of the trading range. These lines connect the highs and lows of the price action within the pattern. The price tends to oscillate between these boundaries without making significant progress in either direction.
            2. Duration: The Rectangle pattern can last for various durations, ranging from a few days to several weeks or even months, depending on the timeframe of the chart being analyzed. The longer the pattern persists, the more significant the potential breakout or breakdown from the pattern may be.
            3. Volume: During the formation of the Rectangle pattern, trading volume tends to diminish as market participants become indecisive. This decrease in volume indicates a lack of conviction from buyers and sellers and suggests that a potential price breakout or breakdown may be imminent.
            4. Breakout: The Rectangle pattern is considered a continuation pattern, meaning that it often leads to a continuation of the previous trend. Traders look for a breakout above the upper boundary (bullish breakout) or below the lower boundary (bearish breakout) of the pattern to confirm the direction of the next price movement.
            5. Target: The price target for the Rectangle pattern is typically measured by the height of the pattern added to the breakout point. For a bullish breakout, the target is calculated by adding the height of the pattern to the breakout level, while for a bearish breakout, the target is calculated by subtracting the height of the pattern from the breakout level.

            In summary, the Rectangle chart pattern is a consolidation pattern that indicates a period of indecision in the market. Traders often use this pattern to anticipate potential breakouts or breakdowns and adjust their trading strategies accordingly. By recognizing the Rectangle pattern and understanding its implications, traders can make informed decisions and capitalize on price movements following the pattern's resolution.

            ​​​​​​​
            • #7 Collapse

              What Is Rectangle Chart Pattern In Forex?

              Rectangle chart pattern ek ahem technical analysis tool hai jo forex market mein istemal hota hai. Ye pattern price action ko represent karta hai aur traders ko potential price movements ke baray mein maloomat faraham karta hai.

              Click image for larger version

Name:	images (1).png
Views:	44
Size:	3.4 کلوبائٹ
ID:	12837435

              Rectangle Pattern Ki Tashkeel

              Rectangle pattern ek price consolidation phase hai jahan market mein price range mein kami hoti hai aur buyers aur sellers ke darmiyan ek horizontal boundary ban jati hai. Ye boundary support aur resistance levels ke tor par kaam karti hai.

              Rectangle Pattern Ki Pehchan
              Rectangle pattern ko pehchanne ke liye do important lines ki zaroorat hoti hai jo price range ko define karte hain. Ye lines price highs aur price lows ko connect karte hain, jisse rectangle shape ban jata hai.

              Rectangle Pattern Ki Mukhtalif Qisamain
              Rectangle pattern ki mukhtalif qisamain hoti hain jese symmetrical rectangle, ascending rectangle, aur descending rectangle. Har qisam ki shape aur dynamics mein farq hota hai jo traders ko alag-alag trading opportunities faraham karta hai.

              Symmetrical Rectangle Pattern
              Symmetrical rectangle pattern mein, price highs aur price lows ek dusre ke nazdeek hote hain, jis se ek symmetric rectangle shape ban jata hai. Ye pattern often indecision ko darust karta hai aur breakout ki possibility ko indicate karta hai.

              Ascending Rectangle Pattern
              Ascending rectangle pattern mein, price highs constant rehti hain jabke price lows dheere dheere barhate hain. Ye bullish continuation pattern hota hai jiska matlab hai ke uptrend mein price ka mazeed barhna mumkin hai.

              Descending Rectangle Pattern
              Descending rectangle pattern mein, price highs constant rehti hain lekin price lows dheere dheere ghatate hain. Ye bearish continuation pattern hota hai jiska matlab hai ke downtrend mein price ka mazeed girna mumkin hai.

              Trading Strategies with Rectangle Patterns
              Rectangle patterns ke saath trading strategies istemal karte waqt, traders breakout ki taraf tawajju dena pasand karte hain. Breakout ke baad, price typically aik direction mein tezi se move karta hai, jo traders ke liye faida mand hota hai.

              Stop Loss aur Take Profit Levels
              Rectangle pattern ke trading mein stop loss aur take profit levels ka tayun bohot ahem hota hai. Stop loss ko typically rectangle ke opposite side se set karte hain, jabke take profit level ko price target ke hisab se set kiya jata hai.

              Risk aur Reward ka Tawazun
              Rectangle pattern ke trading mein risk aur reward ka tawazun rakhna zaroori hai. Achhi risk management ke sath, traders apni trades ko efficiently manage kar sakte hain aur potential profits ko maximize kar sakte hain.
              • #8 Collapse


                Rectangle Chart Pattern: Ek Market Structure Ke Bare Mein

                Rectangle chart pattern forex trading mein ek aham chart pattern hai jo market ka structure darust karne mein madad deta hai. Yeh pattern market mein consolidation ke dauran dekha jata hai jab prices horizontal lines ke darmiyan range bound hoti hain. Rectangle chart pattern traders ko future price movements ka andaza lagane mein madad deta hai aur sahi waqt par entry aur exit points ka intekhab karne mein madadgar sabit hota hai.
                Click image for larger version

Name:	rectangle-pattern-for-trading-breakouts_body_BEARISHRECTANGLE.png.full.png
Views:	38
Size:	8.3 کلوبائٹ
ID:	12837497
                Rectangle Chart Pattern Ki Pehchan:

                Rectangle chart pattern ko pehchanne ke liye kuch khas alaamaat hain:
                1. Horizontal Lines: Rectangle pattern mein prices horizontal lines ke darmiyan range bound hoti hain jinhein support aur resistance ke roop mein dekha ja sakta hai.
                2. Consolidation Period: Rectangle pattern ki pehchan consolidation period ke dauran hoti hai jab prices ek specific range mein oscillate karte hain.
                3. Equal Highs aur Lows: Rectangle pattern mein highs aur lows aapas mein barabar hote hain, jisse ek rectangle ya square shape banta hai.

                Rectangle Chart Pattern Ka Istemal:

                Rectangle chart pattern ka istemal kar ke traders market ke movements ko samajh sakte hain aur sahi waqt par trade kar sakte hain. Is pattern ke mukhtalif tareeqay hain jaise ke:
                1. Breakout Trading: Rectangle pattern mein breakout trading aham hoti hai, jismein traders price ke breakout ke baad enter karte hain. Agar price rectangle ke upper boundary ko break karta hai toh yeh bullish signal hota hai aur agar lower boundary ko break karta hai toh yeh bearish signal hota hai.
                2. Range Bound Trading: Rectangle pattern mein range bound trading bhi ki ja sakti hai jahan traders prices ke andar aur uske qareeb trading karte hain.

                Rectangle Chart Pattern Ke Fayde:

                Rectangle chart pattern ke istemal se traders ko mukhtalif fayde hote hain:
                1. Price Movement Ka Andaza: Rectangle pattern traders ko future price movements ka andaza lagane mein madad deta hai.
                2. Entry Aur Exit Points Ka Intekhab: Is pattern ke istemal se traders sahi waqt par entry aur exit points ka intekhab kar sakte hain.
                3. Risk Management: Rectangle pattern traders ko risk management mein madadgar sabit hota hai kyun ke unhein pata hota hai ke prices kis range ke andar move kar rahe hain.

                Rectangle chart pattern forex trading mein ek mufeed tool hai jo traders ko market ke structure ko samajhne aur sahi waqt par trade karne mein madad deta hai. Is pattern ka istemal kar ke traders apni trading strategies ko behtar bana sakte hain aur munafa kamane mein kamiyab ho sakte hain.

                • #9 Collapse


                  Rectangle chart pattern ek mukhtalif chart pattern hai jo forex trading mein istemal hota hai. Ye pattern ek sideways market condition ko darust karta hai, jahan prices horizontal trading range mein ghoomte hain aur koi clear trend nahi hota. Rectangle pattern ko samajh kar traders range-bound markets mein trading opportunities ko pehchan sakte hain. Yahan rectangle chart pattern ke ahem features hain:

                  Rectangle Chart Pattern Kya Hai? Rectangle chart pattern ek technical analysis tool hai jo market ke price action ko darust karta hai. Is pattern mein prices horizontal trading range mein atke rehte hain aur support aur resistance levels ke darmiyan ghoomte hain. Yeh pattern typically ek rectangle ya square shape mein zahir hota hai jahan prices consolidation ya range-bound hoti hai.
                  Click image for larger version

Name:	images.png
Views:	40
Size:	2.8 کلوبائٹ
ID:	12837645
                  Rectangle Chart Pattern Ka Matlab Kya Hai? Rectangle pattern ka zahir hona darust karta hai ke market mein consolidation ya range-bound movement hai. Yeh pattern market mein pause ya indecision ko darust karta hai jabke buyers aur sellers ke darmiyan equilibrium hota hai. Jab prices support level pe girte hain to traders ko buying opportunities ka intezar hota hai, jabke prices resistance level pe pohanchte hain to selling opportunities ka intezar hota hai.

                  Rectangle Chart Pattern Ki Tafseelat:
                  • Rectangle pattern mein prices horizontal trading range mein ghoomte hain aur koi clear trend nahi hota.
                  • Is pattern mein support aur resistance levels ko define karna asaan hota hai jisse traders ko entry aur exit points tay karne mein madad milti hai.
                  • Rectangle pattern ko zahir hone ke baad, traders ko breakout ya breakdown ka intezar karna chahiye. Agar prices range ke bahar move karte hain to yeh trend continuation ya reversal ka signal ho sakta hai.

                  Rectangle Chart Pattern Ka Istemal: Rectangle pattern ko samajh kar traders range-bound markets mein trading opportunities ko talash sakte hain:
                  • Jab prices support level ke qareeb hote hain, to traders ko buying opportunities ki talash karni chahiye.
                  • Jab prices resistance level ke qareeb hote hain, to traders ko selling opportunities ki talash karni chahiye.
                  • Rectangle pattern ke breakout ya breakdown ke baad, traders ko trend ka direction samajh kar uske mutabiq trading karna chahiye.

                  Rectangle chart pattern ek mufeed tool hai jo traders ko range-bound markets mein trading opportunities ko samajhne mein madad karta hai. Lekin, iske istemal mein traders ko doosre confirmations aur risk management ka bhi khayal rakhna chahiye taake sahi trading decisions liye ja sakein.

                  • #10 Collapse


                    Rectangle Chart Pattern: Forex Trading Mein Ek Ahem Chart Pattern

                    Rectangle chart pattern forex trading mein ek mukhtalif aur ahem chart pattern hai jo market analysis mein istemal hota hai. Yeh pattern market mein price consolidation ko darust karta hai aur traders ko future price movements ke bare mein andaza lagane mein madad deta hai. Chaliye, roman Urdu mein rectangle chart pattern ke bare mein mazeed guftagu karte hain:
                    Click image for larger version

Name:	rectangle-trading-strategy.png
Views:	37
Size:	88.4 کلوبائٹ
ID:	12837771
                    Rectangle Chart Pattern Kya Hai?

                    Rectangle chart pattern ek continuation pattern hai jo market mein price consolidation ko darust karta hai. Is pattern mein price ek rectangle shape ke andar band hoti hai, jahan price ke upar aur neeche define kiye gaye resistance aur support levels hote hain. Yeh pattern market mein volatility kam hone ki wajah se hota hai jab market kisi trend mein consolidate hota hai.

                    Rectangle Chart Pattern Ki Pehchan:

                    Rectangle chart pattern ki pehchan karne ke liye kuch ahem points hain:
                    1. Price Consolidation: Rectangle pattern mein price consolidation hoti hai, yaani ke prices ek specific range mein ghoomte hain aur kisi specific trend mein nahi rehte hain.
                    2. Horizontal Support aur Resistance Levels: Rectangle pattern mein horizontal support aur resistance levels clear taur par dekhe ja sakte hain. Support level price ke neeche se define hota hai jabke resistance level price ke upar se define hota hai.
                    3. Volume Kam Hota Hai: Rectangle pattern ke doran volume kam hota hai kyun ke market mein kisi specific trend ki kami hoti hai.

                    Rectangle Chart Pattern Ka Istemal:

                    Rectangle chart pattern ka istemal karke traders market ke future price movements ke bare mein andaza laga sakte hain aur trading strategies tayyar kar sakte hain. Agar market mein rectangle pattern nazar aata hai toh traders ko breakout ka intezar karna chahiye, yaani ke jab price rectangle ke boundary ko cross karta hai. Breakout ke baad, price mein tezi ya mandi ka trend shuru hota hai jo traders ko trading opportunities deta hai.

                    Rectangle Chart Pattern Ke Fayde:

                    Rectangle chart pattern ke istemal se traders ko kuch faidey milte hain:
                    1. Price Action Ko Samajhna: Rectangle pattern traders ko market ke price action ko samajhne mein madad deta hai aur future price movements ke bare mein andaza lagane mein madad karta hai.
                    2. Trading Strategies Banane Mein Madad: Rectangle pattern traders ko trading strategies banane mein madad deta hai. Breakout ke baad, traders apni positions ko enter kar sakte hain aur profit hasil kar sakte hain.
                    Rectangle chart pattern forex trading mein ek ahem chart pattern hai jo traders ko market ke price consolidation aur future price movements ke bare mein andaza lagane mein madad deta hai. Is pattern ko samajh kar, traders apni trading strategies ko improve kar sakte hain aur market ke movements ko sahi taur par analyze kar sakte hain. Rectangle pattern ke istemal se traders ko trading opportunities milte hain jo unhein trading mein kamiyabi hasil karne mein madadgar sabit ho sakti hai.

                    • #11 Collapse


                      Rectangle chart pattern

                      ek technical analysis tool hai jo traders ko market trends aur price movements ke samajhne mein madad karta hai. Ye pattern typically ek consolidation phase ko represent karta hai, jisme prices ek range ke andar trade karte hain aur clear trend ka pata nahi chalta. Rectangle chart pattern traders ko price range aur potential breakouts ka pata lagane mein madad karta hai.
                      Click image for larger version

Name:	28823b03d2a445b687ad2465c632da8f.jpeg
Views:	34
Size:	40.3 کلوبائٹ
ID:	12837835
                      Rectangle Chart Pattern Ka Tareeqa Kar:


                      Rectangle chart pattern typically do parallel horizontal lines se define hota hai jo price range ko represent karte hain. Ek line prices ki resistance level ko indicate karta hai, jabki doosri line support level ko indicate karta hai. Jab prices ek samanta (consolidation) phase mein hote hain aur horizontal lines ke darmiyan trade karte hain, to ye ek rectangle chart pattern form karte hain.
                      Rectangle Chart Pattern ke Mukhtalif Halaat:
                      1. Consolidation Phase: Rectangle chart pattern market mein consolidation phase ko represent karta hai, jahan prices ek defined range mein trade karte hain aur clear trend ka pata nahi chalta. Is phase mein buyers aur sellers ke beech mein balance hota hai aur market indecision mein hota hai.
                      2. Price Range Identification: Rectangle chart pattern traders ko price range identify karne mein madad karta hai. Resistance aur support lines se traders ko pata chalta hai ke prices kis range mein fluctuate kar rahe hain. Ye information traders ko trading decisions lene mein madadgar hoti hai.
                      3. Breakout Opportunities: Rectangle chart pattern ke ek important aspect ye hai ke ye breakout opportunities provide karta hai. Jab prices rectangle ke boundaries se bahar move karte hain, to ye breakout ka signal ho sakta hai. Traders is breakout ka faida utha kar apne positions ko enter ya exit kar sakte hain.
                      4. Stop Loss Aur Target Levels Ka Tayaar Karna: Rectangle chart pattern ke istemal se traders apne stop loss aur target levels tay karte hain. Support aur resistance lines ke zarieye, traders apne positions ke liye appropriate stop loss aur target levels set kar sakte hain.


                      Rectangle chart pattern ek useful tool hai jo traders ko market trends samajhne aur trading decisions lene mein madad karta hai. Is pattern ke istemal se traders price range identify kar sakte hain aur potential breakouts ka pata lagakar trading opportunities ko maximize kar sakte hain. Magar yaad rahe ke har ek technical indicator ki tarah, rectangle chart pattern ka bhi istemal cautiousness ke saath karna chahiye aur sirf ek indicator ke adhar par trading decisions na lena chahiye.

                      • #12 Collapse

                        What's the rectangle chart pattern.


                        Rectangular chart pattern, jise aam tor par "rectangle pattern" ke naam se bhi jana jata hai, ek tijarat mein istemal hone wala mahir tajaweez chart hai. Yeh chart pattern ek makhsoos shakhsiyat ki makhsoosiyat ko darust karta hai aur market mein tijarat karne walon ke liye ahem hota hai.


                        Makhtoot Banao: Rectangle chart pattern ek makhtoot banao ko darust karta hai jo ke chart par ek rectangle ya square ki shakal mein nazar aata hai. Yeh rectangle price range ko darust karta hai jise market mein istemal hota hai. Is pattern mein high aur low prices aapas mein qareeb hote hain, jo ek darust aur mazboot resistance aur support level tay karte hain.


                        Istemal aur Faida: Rectangle chart pattern ko tajaweezat aur qeemat ko tehqiq karne ke liye istemal kia jata hai. Is pattern ke zariye traders aur investors market ke future trends ko samajh sakte hain. Rectangle pattern ka istemal market mein hone wale mawafiqat ko samajhne ke liye hota hai, jo ke trading aur investing ke maamle mein madadgar sabit ho sakta hai.


                        Breakout aur Breakdown: Rectangle chart pattern ke aam taur par do mukhtalif scenarios hote hain: breakout aur breakdown. Breakout mein prices rectangle ke upper boundary se bahar nikal jati hain, jabke breakdown mein prices rectangle ke lower boundary se nichay chali jati hain. Yeh do situations market mein naye trends ki shuruwat ko darust karte hain.


                        Trading Strategies: Rectangle pattern ko samajh kar traders apni trading strategies banate hain. Agar breakout hota hai toh traders khareedari (buying) ka faisla kar sakte hain, jabke agar breakdown hota hai toh traders farokht (selling) ka faisla kar sakte hain. Iske ilawa, volume analysis aur dusre technical indicators ka istemal bhi rectangle pattern ke saath hota hai.


                        Conclusion: Rectangle chart pattern ek ahem tijarat tool hai jo ke market mein hone wale mawafiqat ko samajhne mein madad karta hai. Traders aur investors ko is pattern ko samajh kar apni tijarat mein behtari aur hoshiyari ke sath kaam karne mein madad milti hai. Yeh chart pattern ek aham tool hai jo market analysis mein istemal hota hai aur tijarat karne walon ko behtareen faislay lene mein madad deta hai.
                        • #13 Collapse

                          What's the Rectangle Chart Pattern:
                          Rectangle chart pattern ek technical analysis tool hai jo forex trading mein istemal hota hai. Ye pattern price action ko analyze karne ka ek tareeqa hai jisse traders market trends aur possible price movements ka andaza lagate hain. Rectangle chart pattern ko define karne ke liye, ek range-bound market condition ki shakal mein hota hai, jahan price ke ek horizontal support aur resistance level ke darmiyan consistent trading hoti hai. Ye pattern typically sideways movement ko represent karta hai, jahan price ki movement horizontal lines ke darmiyan confined hoti hai.

                          Rectangle chart pattern ko identify karne ke liye, traders price ke multiple peaks aur troughs ko dekhte hain jo ek horizontal line se banaye gaye rectangle ki shakal mein hoti hain. Support aur resistance levels ko establish karne ke liye, traders high aur low points ko connect karte hain. Jab price support level ko touch karta hai, traders expect karte hain ke price phir se upar jayega. Jab price resistance level ko touch karta hai, traders expect karte hain ke price phir se neeche jayega. Rectangle chart pattern typically range-bound market conditions mein dekha jata hai aur traders ko potential entry aur exit points provide karta hai.

                          Forex trading karna ek detailed process hai jismein traders currencies ke exchange rate movements ka analysis karte hain aur unke basis par trading decisions lete hain. Yeha mukhtalif factors jaise economic indicators, geopolitical events, aur market sentiment ko bhi consider kiya jata hai. Forex trading mein kuch asool hain jinhe traders follow karte hain:
                          1. Research and Analysis: Traders ko regular basis par market research aur analysis karna hota hai taake woh sahi trading decisions le sakein. Technical analysis, fundamental analysis, aur sentiment analysis jaise tareeqe istemal kiye jate hain.
                          2. Risk Management: Har trade ke liye risk ko manage karna zaroori hai. Traders apne trading capital ka ek hissa har trade mein lagakar apne loss ko control karte hain.
                          3. Trading Plan: Ek trading plan banana zaroori hai jo traders ko help karta hai unke trading goals ko set karne mein aur unhe discipline maintain karne mein.
                          4. Patience aur Discipline: Forex trading mein patience aur discipline bahut zaroori hain. Traders ko apne plan ke mutabiq wait karna chahiye aur emotionally-driven decisions se bachna chahiye.
                          5. Education aur Learning: Forex market dynamics ko samajhne ke liye traders ko regular learning aur education par focus karna chahiye. Naye strategies aur techniques sikhne ka samay nikalna bhi zaroori hai.

                          Overall, forex trading ek challenging lekin rewarding activity hai jismein traders ko dedication aur hard work ki zaroorat hoti hai.


                          Rectangle chart pattern ka istemal karke, traders stock market ya anya financial markets mein price movements ka analysis karte hain. Rectangle chart pattern ek sideways trading range ko darust karta hai, jismein price ek horizontal support aur resistance level ke darmiyan ghoomta hai. Is pattern ko trade karne ke liye, trader ko rectangle ke upper boundary (resistance) aur lower boundary (support) ko identify karna hota hai. Jab price upper boundary ko touch karta hai, traders sell positions open kar sakte hain, aur jab price lower boundary ko touch karta hai, traders buy positions open kar sakte hain. Rectangle chart pattern ka istemal karke, traders market mein price movements ka trend samajh sakte hain aur trading strategies develop kar sakte hain. Lekin, is pattern ka istemal karne se pehle thorough analysis aur risk management ka dhyan rakhna zaroori hai.
                          1. Trend Identification: Rectangle pattern trend direction ko identify karne mein madad karta hai. Agar price rectangle ke andar hai, toh market sideways ho sakta hai. Agar price rectangle ke bahar ja raha hai, toh trend change hone ki possibility hoti hai.
                          2. Entry aur Exit Points: Rectangle pattern traders ko entry aur exit points provide karta hai. Traders support level par buy aur resistance level par sell kar sakte hain.
                          3. Stop Loss Placement: Rectangle pattern ke saath traders apne stop loss orders ko place kar sakte hain. Agar price breakout karta hai rectangle ke andar se, toh stop loss lagaya ja sakta hai opposite side par.
                          4. Risk Management: Rectangle pattern traders ko risk management mein madad karta hai, kyunki woh defined support aur resistance levels ke basis par apne trades plan kar sakte hain.
                          5. Volatility ka Pata: Rectangle patterns volatility ki absence ya presence ko dikhata hai. Jab price rectangle ke andar hai, toh volatility kam hoti hai, jabki breakout ke time par volatility badh jaati hai.

                          Rectangle chart pattern traders ke liye ek powerful tool hai jisse woh market trends ko samajh sakte hain aur sahi samay par trades execute kar sakte hain. Lekin, jaise har trading strategy mein, yeh bhi apne limitations aur false signals ke sath aata hai, isliye proper risk management aur technical analysis zaroori hai.


                          ​​​​​​​
                          • #14 Collapse


                            1. Rectangle Chart Pattern: Price Aur Moving Average Ki Milti Julti Dastaan

                            1.1 Rectangle Chart Pattern Ki Tafseel: Rectangle chart pattern ek technical analysis tool hai jo market ke charts par hone wale mubadalaat ko represent karta hai. Is patran mein, price range mein hone wale consolidation ko dikhaya jata hai jisme price ek rectangle ke andar ghira hota hai.

                            1.2 Rectangle Chart Pattern Ki Pechan:
                            • Rectangle chart pattern ka pehchan karne ke liye, traders ko market ke price levels par dhyan dena chahiye jahan price bar-bar ek range mein phansa rehta hai.
                            • Yeh pattern sideways market conditions ko darust karta hai jahan price ka koi clear trend nahi hota.


                            2. Rectangle Chart Pattern Aur Trading Strategies:

                            2.1 Range Trading Ke Liye Mufeed:
                            • Rectangle chart pattern range-bound market conditions ko identify karne mein mufeed hai.
                            • Traders is pattern ki madad se price ke upper aur lower levels ko pehchan kar range trading strategies bana sakte hain.

                            2.2 Breakout Aur Breakdown Points Ka Faisla:
                            • Rectangle pattern ki madad se traders breakout aur breakdown points ko pehchan sakte hain.
                            • Breakout point par traders long positions le sakte hain jabke breakdown point par short positions le sakte hain.


                            3. Pakistan Ki Chat Language Mein Rectangle Chart Pattern:

                            3.1 Trading Mein Rectangle Pattern Ka Istemal:
                            • Pakistan ki chat language mein, traders ko chahiye ke rectangle chart pattern ko samajh kar market ke movements ko predict karein.
                            • Is pattern ko istemal karke, traders apni trading strategies ko mazeed behtar bana sakte hain.


                            4. Muqabala Aur Faisla:

                            4.1 Rectangle Chart Pattern Aur Trading:
                            • Rectangle chart pattern, traders ko market ke consolidation aur range-bound movements ko samajhne mein madad karta hai.
                            • Traders ko is pattern ko istemal karke, breakout aur breakdown points ko pehchanne mein aur sahi trading decisions lene mein madad milti hai.

                            4.2 Faisla:
                            • Pakistan ki chat language mein, traders ko rectangle chart pattern ko apni trading toolkit mein shamil karne ke liye market ko acche se samajhna hoga.
                            • Is information ko istemal karke, traders mazeed tajaweez hasil kar sakte hain aur apne trading skills ko barha sakte hain.


                            5. Conclusion:

                            Pakistan ki chat language mein, rectangle chart pattern traders ke liye ek ahem tool hai jo market ke consolidation aur range-bound conditions ko pehchanne mein madad karta hai. Traders ko chahiye ke is pattern ko samajh kar sahi waqt par trading decisions lene mein maharat hasil karein.


                            Last edited by ; 21-02-2024, 07:57 PM.
                            • <a href="https://www.instaforex.org/ru/?x=ruforum">InstaForex</a>
                            • #15 Collapse

                              **Rectangle Chart Pattern Kya Hai?**
                              Forex trading mein, technical analysis patterns market ke price movements aur trends ko samajhne ke liye use kiye jate hain. Rectangle Chart Pattern ek aisa pattern hai jo price consolidation aur range-bound markets ko indicate karta hai. Yeh pattern traders ko market ke sideways movement aur potential breakouts ko identify karne mein madad karta hai. Is post mein, hum Rectangle Chart Pattern ke features, identification aur iska trading pe asar discuss karenge.

                              **Rectangle Chart Pattern Ki Pehchan:**

                              Rectangle Chart Pattern ek technical chart pattern hai jo price consolidation ko represent karta hai. Is pattern mein, price ek defined range ke andar oscillate karti hai, jahan support aur resistance levels clear hote hain. Yeh pattern generally market ke range-bound behavior ko show karta hai aur trend ke absence ko indicate karta hai.

                              **Pattern Ka Structure:**

                              1. **Support Aur Resistance Levels:** Rectangle pattern ke dauran, price ek specific support aur resistance levels ke beech move karti hai. Support level wo point hota hai jahan price decline karne ke bawajood rukti hai, aur resistance level wo point hota hai jahan price rise hone ke bawajood limit hoti hai. Yeh levels pattern ke boundaries ko define karte hain.

                              2. **Consolidation Phase:** Rectangle pattern tab develop hota hai jab market ek prolonged period ke liye consolidation phase mein hoti hai. Is phase mein, price ek narrow range ke andar trade karti hai aur significant trend nahi hota. Consolidation phase market ke indecision aur equilibrium ko reflect karta hai.

                              3. **Breakout:** Rectangle pattern ke completion ke baad, price ek breakout ke through support ya resistance level ko break karti hai. Breakout bullish ya bearish trend ke indication hota hai aur market ke next direction ko determine karta hai.

                              **Pattern Ka Analysis Aur Istamal:**

                              1. **Range-Bound Trading:** Rectangle Chart Pattern ko identify karke, traders range-bound trading strategies ko implement kar sakte hain. Support aur resistance levels ke beech price movements ko capitalize karke, traders buy aur sell positions ko align kar sakte hain.

                              2. **Breakout Trading:** Jab price rectangle pattern ke support ya resistance level ko break karti hai, to yeh breakout trading opportunity ko signal karta hai. Traders breakout ke direction ke hisaab se positions open karte hain aur potential trends ko capture karne ki koshish karte hain.

                              3. **Risk Management:** Rectangle pattern trading ke dauran risk management ka bhi dhyan rakhna zaroori hota hai. Traders support aur resistance levels ko stop-loss aur take-profit levels set karne ke liye use karte hain, jo trading positions ko protect karte hain aur risk ko manage karte hain.

                              4. **Volume Analysis:** Volume analysis bhi Rectangle Chart Pattern ke effectiveness ko enhance kar sakta hai. Pattern ke dauran volume spikes ko monitor karna zaroori hai, jisse breakout ke confirmation ko validate kiya ja sakta hai.

                              **Nihayat Ahem:**

                              Rectangle Chart Pattern forex trading mein range-bound markets aur price consolidation ko analyze karne ke liye ek useful tool hai. Pattern ke structure aur analysis ko samajh kar, traders market ke potential breakouts aur trading opportunities ko identify kar sakte hain. Effective use of Rectangle Chart Pattern se traders apni trading strategies ko optimize kar sakte hain aur market ki fluctuations se fayda utha sakte hain.

                              اب آن لائن

                              Working...
                              X