What is Triangle Chart Pattern:
A triangle chart pattern is a technical analysis pattern that is formed on a price chart when the price of an asset consolidates within a converging range, creating a triangular shape. Triangle patterns are considered continuation patterns, as they typically occur in the middle of a trend and suggest that the price is likely to continue in the same direction after the pattern is resolved.
There are three main types of triangle chart patterns:
Traders use triangle chart patterns to identify potential trading opportunities based on the expected price direction after the pattern is resolved. Breakouts from triangle patterns are often accompanied by increased volatility and trading volume, providing confirmation of the breakout direction. It is important for traders to wait for a confirmed breakout and consider using stop-loss orders to manage risk when trading triangle patterns
A triangle chart pattern is a technical analysis pattern that is formed on a price chart when the price of an asset consolidates within a converging range, creating a triangular shape. Triangle patterns are considered continuation patterns, as they typically occur in the middle of a trend and suggest that the price is likely to continue in the same direction after the pattern is resolved.
There are three main types of triangle chart patterns:
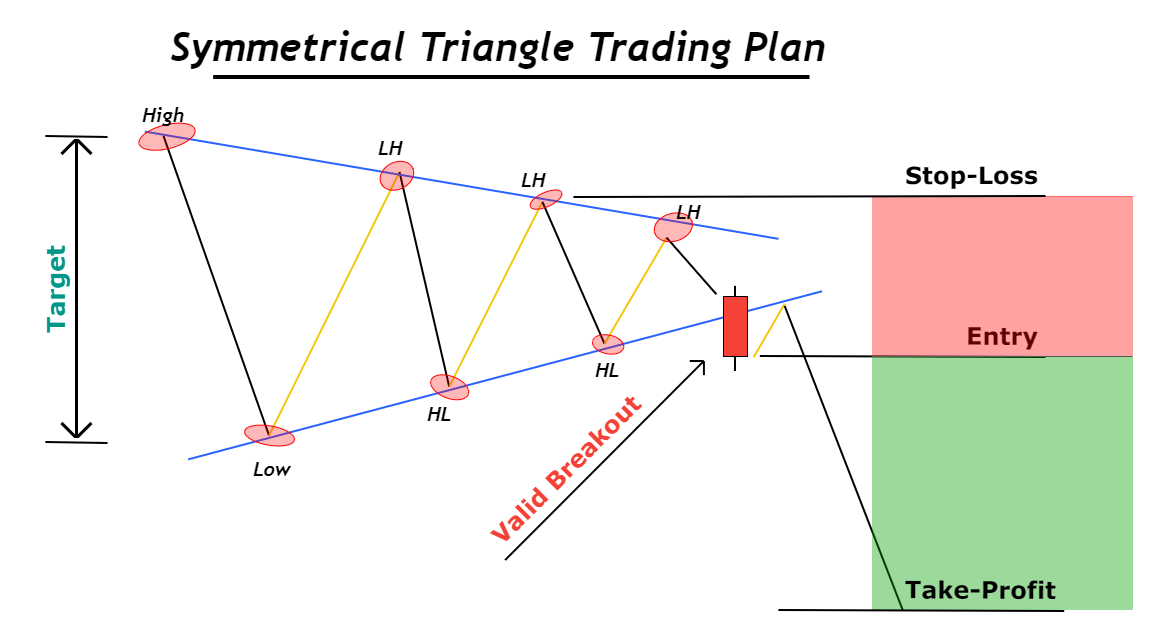
- Symmetrical Triangle:
- A symmetrical triangle is formed when the price consolidates between two converging trendlines, with lower highs and higher lows. The pattern creates a symmetrical triangle shape on the chart.
- Symmetrical triangles do not indicate a bias towards an upward or downward breakout, as they represent a period of indecision in the market. Traders typically wait for a breakout above or below the trendlines to confirm the direction of the next price movement.
- Ascending Triangle:
- An ascending triangle is characterized by a horizontal resistance level and an ascending trendline as support. The pattern creates a triangle shape with a flat top and rising bottom.
- Ascending triangles are considered bullish patterns, as they suggest that buyers are becoming more aggressive and the price is likely to break out to the upside. Traders often look for a breakout above the horizontal resistance level to enter long positions.
- Descending Triangle:
- A descending triangle features a horizontal support level and a descending trendline as resistance. The pattern forms a triangle shape with a flat bottom and declining top.
- Descending triangles are considered bearish patterns, as they indicate that sellers are gaining control and the price is likely to break out to the downside. Traders typically wait for a breakout below the horizontal support level to enter short positions.
Traders use triangle chart patterns to identify potential trading opportunities based on the expected price direction after the pattern is resolved. Breakouts from triangle patterns are often accompanied by increased volatility and trading volume, providing confirmation of the breakout direction. It is important for traders to wait for a confirmed breakout and consider using stop-loss orders to manage risk when trading triangle patterns


تبصرہ
Расширенный режим Обычный режим