What is Bearish Kicker Pattern:
X
  • وقت
  • دکھائیں
Clear All
new posts
  • #1 Collapse

    What is Bearish Kicker Pattern:
    What is Bearish Kicker Pattern:


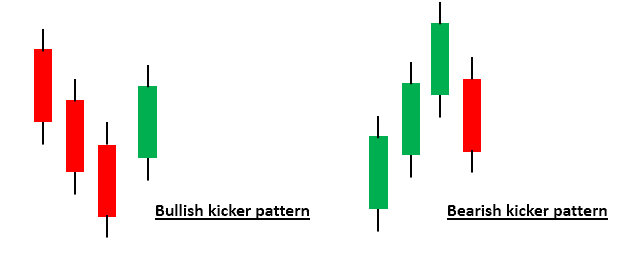
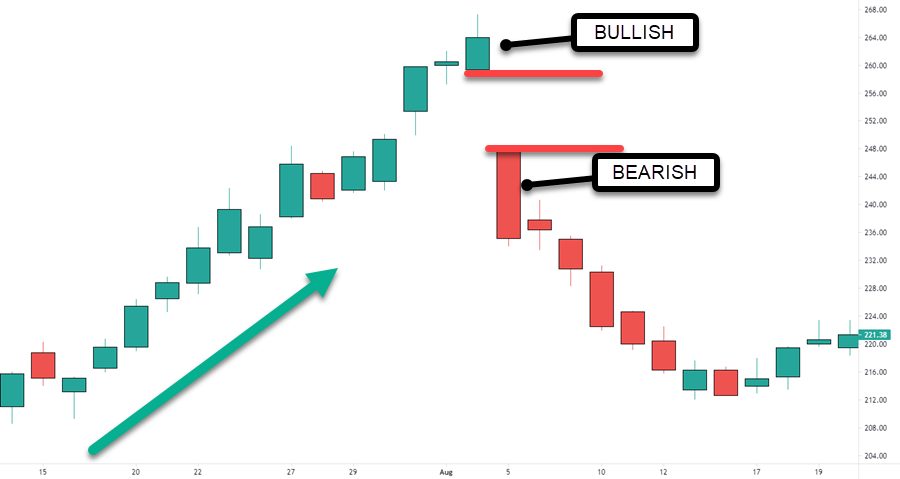
    Bearish kicker patteren aik mo-asar candle stick reversal namona hai jo salahiyat ke rujhan ko taizi se mandi ki taraf mornay se khabardaar karta hai. yeh namona mom btyon par mushtamil hota hai, jis mein pehli mom batii aik barri 2 d taizi wali mom batii ki madad se mushahida ki jati hai jo pehli mom batii ke frame ko bilkul lapait layte hai, jo aaj ke nichale aur aakhri din se aik din pehlay shuru hoti hai. raftaar mein yeh herat angaiz aur faisla kin tabdeeli market ke jazbaat mein aik mazboot tabdeeli ko zahir karti hai, kyunkay sarfeen farokht knndgan par ghalib hotay hain, aur do mom btyon ke darmiyan khultay jatay hain. Bearish kicker patteren aam tor par up trained ke stop par nazar aata hai aur is se pata chalta hai ke bear ne control sambhaal liya hai, jis ki wajah se charge mein salahiyat neechay ki taraf harkat hoti hai.


    Identifying the Bearish Kicker Pattern:


    Bearish kicker patteren ki muaser tareeqay se shanakht karne ke liye, sarmaya karon ko namoonay bananay wali do mom btyon ki khususiyaat par gehri dilchaspi dainay ki zaroorat hai. pehli mom batii aik lambi, mandi wali mom batii honi chahiye jis mein kaafi kharabi gardish ho, jo farokht ke dabao ki nishandahi karti hai. doosri mom batii aik taiz mom batii honi chahiye jo is kam honay se aik din pehlay ke muqablay mein kam khulti hai aur is ziyada honay se aik din pehlay ke muqablay mein behtar band hoti hai, pehli mom batii ke jism ko mukammal tor par lapait deti hai. yeh namona ziyada qabil aetmaad hai jabkay doosri mom batii pichlle mom batii se neechay khulti hai. hajam ki tashkhees ka istemaal patteren ki sadaqat ki tasdeeq ke liye bhi kya ja sakta hai, jis mein hajam mein izafay se ulat jane walay nishaan ki madad hoti hai.


    Click image for larger version

Name:	bearish-kicking-1.png
Views:	37
Size:	6.8 کلوبائٹ
ID:	12836010

    Confirmation and Entry Signals in Bearish Kicker Pattern:


    Aik baar Bearish kicker patteren ki tashkhees ho jane ke baad, sarmaya karon ko tabdeeli daakhil karne se pehlay tasdeeq ka intzaar karna parta hai. yeh namona bananay ke baad sharah ki harkat par nazar rakhnay, neez mandi ke intabahat talaash karne ke zariye kya ja sakta hai jis mein down trained ka tasalsul ya kaleedi imdadi sthon se neechay toar shaamil hain. mazeed bar-aan, tajir mandi ke taasub ki tasdeeq ke liye mutaliqa taaqat index ( are s aayi ) ya moving average ke sath takneeki alamaat ka istemaal kar satke hain. dakhlay ke isharay is waqt peda kiye ja satke hain jab fees doosri mom batii ke nichale hissay se neechay toot jati hai, jo aik mazboot mandi ki raftaar aur isi terhan ki kharabi ki harkat ki salahiyat ki nishandahi karti hai.


    Risk Management and Stop Loss Placement in bearish Kicker Pattern:


    Bearish kicker patteren ki tijarat karte waqt, sarmaye ki hifazat aur nuqsanaat ko mehdood karne ke liye rasd control zaroori hai. taajiron ko market ke ulat jane ki soorat mein mumkina nuqsanaat ko mehdood karne ke liye doosri mom batii ke oopar nuqsaan ko rokna nahi bhoolna chahiye. mazeed bar-aan, kirdaar ki pemaiesh ko ahthyat se munazzam kya jana chahiye taakay yeh yakeeni banaya ja sakay ke khatrah aur inaam ka tanasub sazgaar hai. khatray par qaboo panay ki munasib technical ko shaamil karkay, tajir apni alamgir tijarti karkardagi ko sajh satke hain aur mumkina nuqsanaat ke asraat ko kam kar satke hain.


    Click image for larger version

Name:	image-3.png
Views:	33
Size:	13.5 کلوبائٹ
ID:	12836011

    Profit Targets and Exit Strategies in Bearish Kicker Pattern:


    Bearish kicker patteren kharidne aur farokht karte waqt ziyada se ziyada munafe haasil karne ke liye, sarmaya car kaleedi madad ke darjay, Fibonacci Retracement ki satah, ya pichlle soyng lovs ki bunyaad par aamdani ke ahdaaf tay kar satke hain. un sthon ki shanakht karkay, sarmaya car aamdani ko band karne aur sharah ki mumkina naqal o harkat par qabza karne ke liye taaqatwar hikmat e amli qaim kar satke hain. mazeed bar-aan, jab tabadlah tajir ke haq mein hota hai to trailing prevent las orders ka itlaq mustahkam aamdani par kya ja sakta hai. Bearish kicker patteren ko sahih tareeqay se kharidne aur farokht karne ke liye aik nazam o zabt ki hikmat e amli ko barqarar rakhnay ke liye kharidaron ke liye yeh zaroori hai ke woh har munafe lainay aur harnay wali tijarat se bahar niklny ke liye aas paas aik saaf mansoobah rakhen.
  • <a href="https://www.instaforex.org/ru/?x=ruforum">InstaForex</a>
  • #2 Collapse

    Assalamu Alaikum Dosto!

    Bearish Kicking Pattern


    Bearish Kicker Pattern ek do-bar candlestick pattern hai jo kisi aset ki keemat ke trend mein aik ahem tabdeeli ko set karti hai, jo ke market mein aik group ki trend reversal ka ishara deta hai. Bearish Kicker aik aisi structure hai jo ke finansiyal modeling mein pehchaani gayi hai jahan par aik khaas do-bar candlestick formation ke doran keemat mein tezi se kami hoti hai. Traders isey samajhte hain ke kon sa market segment play mein hai.
    Bearish Kicker pattern Japanese candlestick charting ke pehle dinon se mojood hai, jo ke 1990s mein Western dunya mein pehli martaba mutarif kiya gaya tha. Jab yeh pattern pehli martaba introduce kiya gaya tha, to ise "abandoned baby" pattern kehte thay, lekin baad mein ise "bearish kicker" pattern keh diya gaya.
    Bearish Kicker ka asal faida yeh hai ke yeh keemat ke trend mein tabdeeli ka saaf ishara deta hai. Traders jo ke lambi positions se nikalna ya market ko aur niche giraane se pehle shorting karna chahte hain, wo is maloomat se faida uthate hain.

    Click image for larger version

Name:	images (496).png
Views:	42
Size:	2.7 کلوبائٹ
ID:	12836017

    Explaination

    Bearish Kicker ek candlestick pattern hai jo ke do candlesticks ke doran hota hai ek keemat ke uptrend mein. Bearish Kicker pattern tab pehchana jata hai q ke is khaas do-bar candlestick formation mein keemat mein tezi se tabdeeli hoti hai. Traders ko bearish kicker pattern par ziada itminan hota hai ek bearish trend ke indicator ke tor par, jo unhein assets khareedne ya bechne ke baray mein maloomat hasil karne mein qabil banata hai.
    Yeh pattern tab hota hai jab aik lamba white ya green candlestick ke baad aik gap up hota hai aur phir doosri black ya red candlestick hoti hai jo pehle din ke high ke ooper open hoti hai lekin pehle din ke low ke neechay close hoti hai. Dusra candlestick pehli ko poori tarah se gher leta hai, ek bearish engulfing pattern banate hue.
    Bearish Kicker pattern ka maqam ko wazeh karne ka aham tareeqa yeh hai ke jab yeh overbought ya oversold territories mein hota hai, to is ka ahmiyat barh jati hai. Yeh ishara karta hai ke market ne ek intehai ko chhoo liya hai aur ek reversal karwaah hone wala hai. Yeh daleelon ki taraf ishara karta hai ke market participants ne control hasil kiya hai, aur jab aise market shorowat mein aata hai, to yeh ek strong bearish momentum ki zyada shiddat ki indication deta hai. Traders is pattern ko ek confirmation signal ke tor par istemal karte hain short positions mein dakhil hone ke liye, as further decline in asset price ki tawaqqu me rakhte hue.
    Bearish Kicker candlestick pattern ek munasib risk-to-reward ratio established karta hai jab yeh kisi ahem level ke qareeb ek palat mein ishara karta hai. Kyunki Bearish Kicker candlestick pattern aksar ek lambi downtrend ya uptrend ki zaroorat nahi hoti hai, isey bearish tasawwur karna chahiye agar haal ki chat apni buland, neechi ya mustaqil taur par hai.

    Bearish Kicker Pattern ki Hososeyat


    Bearish Kicker pattern ek tezi se palat mein ishara hai ek uptrend mein. Is mein do candlesticks shamil hote hain, pehla lamba white ya green candlestick hota hai, aur doosra lamba black ya red candlestick hota hai jo pehle candlestick ke high ke ooper open hota hai aur pehle candlestick ke low ke neechay close hota hai.
    Yeh pattern aksar ek mazboot uptrend ke baad hota hai aur iski pehchan yeh hoti hai ke pehle aur doosre candlesticks ke darmiyan aik gap hota hai, jo ke ek sudden market sentiment ka tabadla darust karta hai. Dono candlesticks lambi hote hain, jo ke mazboot farokht dabao ko darust karte hain, aur doosri candlestick pehle din ke low ke neechay band hoti hai, jo ke yeh darust karta hai ke bear market ne market ka control hasil kiya hai. Iske ilawa, yeh pattern munsil farokht volume ke sath hota hai, jo ke mazboot market shirkat ko darust karta hai. Halankeh traders bearish kicker pattern ko aam tor par aik mazboot farokht ya short positions mein dakhil hone ka ishara samajhte hain, lekin trading faislay se pehle is pattern ko doosri technical indicators aur analysis ke sath tasdeeq karna zaroori hai.

    Bearish ki Explaination

    "Bearish" ko forex market mein ek neechay ki trend ya jazbat ka ishara samjha jata hai. Bearish jazbat ko kisi khaas stock ya security ki keemat mein kami ko laata hai. Yeh bearish jazbat ek khaas stock ya market se jude hote hain. Yeh darust karta hai ke investors ko market par ek manfi nazar hai aur woh yeh tawaqo rakhte hain ke bearish trends jari rahenge. "Bearish" market, prices mein ek kami ka ishara karta hai.
    "bear" ka lafz pehli martaba stock market mein 18th century mein aaya jab isey stock jobbers ke amal ko bayaan karne ke liye istemal kiya gaya tha jahan par apni hisse ko faqa hone ke tawaqo se bechna. Stock jobbers pairs mein kaam karte thay, jin ka rawiya bear apne shikaar ko kaise girta hai us ki tarah tasweer kiya gaya tha. Bearish jazbat mein izafa hone ke sath sath stock market mein bear lafz nichli keemat ko darust karta tha. "Bearish" aur "bullish" lafz trading business ke mukhtalif sectors mein istemal kiye jaate hain market ke halat aur investors ke jazbat ko darust karne ke liye.
    Bearish kicker sirf mazeed bearish patterns mein se ek hai. Neeche panch main bearish patterns ke baare mein maloomat di gayi hai bearish kicker ke ilawa.
    • Hanging Man: Hanging Man pattern aik bearish candlestick pattern hai jo ke ek uptrend ke peak par nazar aata hai. Hanging Man aksar trend ka palat hone ka ishara deta hai. Hanging Man candlestick mein aik choti haqiqi body hoti hai jo ke choti hoti hai, lambi lower shadow hoti hai, aur kisi upper shadow ki kami hoti hai. Pattern ek choti body ko lambi patli line se latka hua dikhta hai. Pattern dikhata hai ke buyers pehle mein control mein thay lekin baad mein sellers unhein maat de gaye, jo ke keemat ko neeche daba gaye, aur ho sakta hai ke koi bhi maayne ki keemat nahin dikhayi gayi ho.
    • Dark Cloud Cover: Dark Cloud Cover aik bearish reversal candlestick pattern hai jo ke ek uptrend ke akhir mein hota hai. Dark Cloud Cover do alag alag candlesticks se mushtamil hota hai: pehla aik lamba bullish candlestick hota hai, aur doosra aik lamba bearish candlestick hota hai jo pehle candlestick ke high ke ooper open hota hai lekin dono candlesticks ke darmiyan close hota hai. Ye do candlesticks pattern ko banate hain. Pattern dikhata hai ke bullish momentum ka dabao kam ho gaya hai, aur bear market control hasil kar raha hai. Traders is pattern ko mukhtalif tareeqon se istemal kar sakte hain jaise ke unhein market mein jo lambi positions hain unhein hold kar sakte hain aur wo doosre traders ke signals ko tasdeeq kar sakte hain.
    • Bearish Engulfing: Bearish Engulfing pattern aik bearish candlestick pattern hai jo ke ek choti bullish candlestick se musalsal ek bara bearish candlestick ke baad hota hai jo ke pehle candlestick ko poori tarah se gher leta hai. Ye pattern aam tor par bullish se bearish trend mein palat ka darust ishara ke tor par liya jata hai. Bearish Engulfing pattern tab hota hai jab market pehle din ke close ke ooper open hota hai lekin phir din ke doran bohot zyada farokht dabao hota hai jo ke keemat ko neeche daba deta hai. Yeh tab hota hai jab aik bearish candlestick candlestick chart par pehle candlestick ko poori tarah gher leti hai. Traders aur investors aksar is pattern ko istemal karte hain, short selling opportunities dhoondhte hue, kyunke yeh ishara deta hai ke trend mein badalne ke imkaanat bohot zyada hain.
    • The Evening Star: The Evening Star pattern yeh dikhata hai ke ek uptrend khatam ho gaya hai. The Evening Star teen candlesticks se mushtamil hota hai: pehla ek bara bullish candlestick hota hai, doosra aik choti candlestick gap ke saath hoti hai, aur teesra aik bara bearish candlestick hota hai jo ke gap ke saath neeche hota hai. Pehla candlestick dikhata hai ke bohot zyada farokht dabao hai, ishara karte hue ke bulls market control mein hain. Dusra candlestick dikhata hai ke market mein indecision hai, jahan par bulls aur bears ek doosre se ladh rahe hain. Teesra candlestick saaf tor par yeh dikhata hai ke palat ka darust hone wala hai, jahan par bulls market ka control chhod rahe hain aur keemat ko neeche daba rahe hain. Traders is pattern ko istemal karte hain apne lambi positions ko exit karne ke liye ya short positions mein dakhil hone ke liye. Wo apni position establish karte hain is pattern ko doosre bullish momentum ko dobara samajhne ke liye.
    • The Three Black Crows: The Three Black Crows ek bearish candlestick pattern hai jo ke ek uptrend mein palat ka ishara deta hai. Pattern teen musalsal black candlesticks se mushtamil hota hai jinmein har candlestick ka lamba body hota hai, aur har candlestick mein bohot hi kam ya koi bhi upper wick nahin hoti. Yeh pattern tab hota hai jab har candlestick ka opening price pehle din ke close ke ooper hota hai, aur jab har candlestick ka closing price pehle din ke opening price ke neeche hota hai. The Three Black Crows pattern ek mazboot bearish palat ka saaf ishara hai aur isey usi tarah samjha jana chahiye. Traders aksar is pattern ko ek stock ko bechne ya short positions mein dakhil hone ke liye istemal karte hain. Kyunki pattern dikhata hai ke stock ko neeche jaane ka imkaan hai, isey aksar downtrend ka intezar karne ke liye istemal kiya jata hai.


    Traders bearish patterns ko samajhne ke liye mukhtalif technical analysis tools ka istemal karte hain. Magar yaad rakhen ke trading ke kisi bhi faislay se pehle, pattern ko hamesha doosre indicators ke saath tasdeeq kiya jana chahiye.

    Click image for larger version

Name:	images (512).jpeg
Views:	31
Size:	52.0 کلوبائٹ
ID:	12836018

    Bearish Kicker Pattern ka Kaam

    Bearish kicker patterns darust karte hain ke market sentiment mein achanak tabdeeli aayi hai, jahan par bears ne keemat ko neeche daba diya hai. Pattern tab hota hai jab aik lamba bullish candlestick ko ek lamba bearish candlestick follow karta hai jo pehle din ke high ke ooper open hota hai lekin pehle din ke low ke neeche close hota hai. Traders aksar is pattern ko ek mazboot bearish signal ke tor par samajhte hain aur isey lambi positions mein bechna ya short positions mein dakhil hone ke liye istemal kar sakte hain mazeed kami ki tawaqqu.
    Bearish Kicker pattern aik do-candlestick pattern hai jo ke market mein aik bearish palat ko darust karta hai. Is pattern mein, aik lambi safed ya green candlestick pehle aati hai, jo ke mazboot khareedari ki lehar ko darust karti hai. Phir, kala candlestick ooper pehle din ke high ke ooper open hota hai. Kala candlestick phir neeche jaata hai, do candlesticks ke darmiyan ek gap paida karte hue. Ye gap achanak market sentiment mein tabdeeli ka ishara hai, jahan par bears ka control ban gaya hai.
    Bearish Kicker pattern ko pehchanne ke liye, keemat ke chart par do candlestick pattern ko dekhein. Pehli candlestick aik safed (bullish) candlestick honi chahiye, jo mazboot khareedari ki raftar ko dikhata hai. Dusra candlestick aik kaala (bearish) candlestick hona chahiye jo pehle candlestick ke high ke ooper open hota hai, chart par ek bara gap banate hue. Kaale candlestick ka opening price pehle din ke closing price ke neeche hona chahiye. Ye darust karta hai ke pehle din dekhi gayi mazboot khareedari daba di gayi hai mazboot farokht dabao ne, bearish palat ka ishara dete hue.

    Trading

    Bearish kicker pattern market mein bearish jazbat ko darust karta hai. Yahan do mukhya strategies hain jo investors ko maloom faislay karne aur unke kamiyabi ke chances barhane mein madad karti hain.
    • Short Selling: Short selling mein, investors umeed karte hain ke share keemat mein kami hone ki umeed hai. Investors phir share ko bechne ki umeed rakhte hain, jahan par share keemat mein kami hone ki umeed hai. Investors phir share keemat mein kami ki umeed rakhte hain. Phir wo umeed rakhte hain ke share ki keemat mein kami hogi. Phir wo share ko sasta karidna chahte hain aur broker ko share waapis kar dete hain. Bechne aur khareedne ke beech ka farq investor ke liye munafa hota hai, koi bhi fees ya biaaj ke saath.
    • Analysis : Analysis bhi trading mein risk kam karne ka asar daar tareeqa hai. Investors apni psychological aspects ko kisi khaas company ya market ke exposure ko kam kar ke alag alag asset classes aur sectors mein taqseem karte hain.
    • Stop-loss: Stop-loss orders lagane ka maqsad nuqsanain mehdood karna hota hai. Investor apne stock ko ek pehle tay ki gayi keemat par mehfooz karta hai. Wo ek pehle tay ki gayi keemat par apne stock ko mehfooz karne ka ek pehle tay ki gayi keemat tay karte hain taake wo kisi bhi ziada situation se mehfooz rahein, aur yeh bhi khaas situation ko zyada hone se pehle tay ki gayi hoti hai. Expert traders ko bearish market mein is tarah ki trading challenging lagti hai, lekin jab yeh trading strategy yaad rakhi jati hai to yeh nihayat munafa bakhsh hoti hai.


    • #3 Collapse

      Forex market apni wusat aur liquidity ke liye mashhoor hai, jo traders ko mukhtalif moqo par munafa kamaane ka moka deta hai. Lekin, is mein kamiyabi ke liye mukhtalif chart patterns aur indicators ka gehra samajh zaroori hai taake behtareen faislay kiye ja sakein. In patterns mein se, Bearish Kicker Pattern ek ahem reversal signal hai jo traders ko market ke downturn ko pehlay se pehchaanne mein madad deta hai.

      Bearish Kicker Pattern ka Banana
      Bearish Kicker Pattern do-candle pattern hai jo ek achanak aur tez reversal ko darshata hai, jahan ek uptrend se downtrend ka rukh hota hai. Is pattern mein pehli candle aksar bullish hoti hai, jo ek mazboot upward movement ko zahir karti hai, aur yeh aksar apni high ke kareeb close hoti hai. Yeh candle market mein prevailing bullish sentiment ko reflect karti hai, jahan buyers dominate kar rahe hote hain aur prices ko upar le ja rahe hote hain.

      Dusri candle kicker hoti hai jo ek bearish candle hoti hai aur pehli bullish candle ke close par ya iske neeche open hoti hai aur phir niche ki taraf jati hai. Is pattern ko khas banane wali cheez yeh hai ke bullish aur bearish candles ke darmiyan gap hota hai. Yeh gap market sentiment mein dramatic shift ko darshata hai, jahan sellers fori tor par control mein aa jaate hain aur prices ko neeche le jate hain.


      Bearish Kicker Pattern ki Ahmiyat
      Bearish Kicker Pattern ko technical analysis mein ek sab se reliable reversal pattern mana jata hai kyunki isme market sentiment ka ek achanak aur wazeh tabadla hota hai. Bullish aur bearish candles ke darmiyan gap ek powerful indicator hota hai ke market dynamics optimism se pessimism ki taraf shift ho gaye hain. Yeh pattern aksar ek bearish trend ya ek significant correction ka aghaz darshata hai.

      Kayi factors hain jo Bearish Kicker Pattern ki reliability mein hissa dalte hain:
      1. Market Psychology: Yeh pattern trader sentiment mein achanak tabadla reflect karta hai. Pehli bullish candle traders ke confidence ko represent karti hai, lekin agle din ki bearish candle fori tor par fear ya uncertainty ko zahir karti hai. Yeh psychological shift selling pressure ko barha sakta hai, jo bearish trend ko mazid mazboot kar sakta hai.
      2. Volume Confirmation: Bearish Kicker Pattern ka signal tab aur reliable ho jata hai jab yeh high trading volume ke sath hota hai. Bearish candle ke formation ke doran high volume yeh confirm karta hai ke sentiment mein shift substantial market participation ke sath hai, jo pattern ki credibility ko barhata hai.
      3. Location in Trend: Yeh pattern tab khas taur par significant hota hai jab yeh ek prolonged uptrend ke baad nazar aaye. Ek prolonged rise ke baad, sudden bearish kicker yeh indicate kar sakta hai ke market overbought hai aur ek correction nazdik hai.
      Practical Application in Forex
      Bearish Kicker Pattern ko forex trading mein effectively use karne ke liye, traders ko pattern ke ilawa aur bhi mukhtalif factors ko madde nazar rakhna hota hai. Yehan ek step-by-step guide hai ke is pattern ko trading strategy mein kaise incorporate kiya jaye:
      1. Pattern Ki Pehchaan: Pehla qadam yeh hai ke Bearish Kicker Pattern ko chart par sahi tarah identify kiya jaye. Ek bullish candle ko dekhen jo ek bearish candle ke sath hai jisme gap ho. Ensure karein ke bearish candle bullish candle ke close par ya iske neeche open ho aur decisively neeche move kare.
      2. Indicators Ke Sath Confirm Karein: Pattern khud mein strong hai, lekin additional technical indicators ka istimaal signal ki reliability ko barha sakta hai. Indicators jaise ke Relative Strength Index RSI, Moving Averages, aur Bollinger Bands further confirmation de sakte hain. Misal ke taur par, agar RSI overbought territory mein ho, to yeh bearish reversal signal ko aur weight deta hai.
      3. Volume Analysis: Pehle se bataya gaya hai ke volume Bearish Kicker Pattern ki confirmation mein crucial role play karta hai. Bearish candle ke formation ke doran high trading volume strong selling interest ko zahir karta hai, jo reversal ke sustain hone ke chances ko barha deta hai.
      4. Entry aur Exit Points Set Karein: Jab pattern identify aur confirm ho jaye, to traders ko apne entry aur exit points set karne hote hain. Aksar traders agle candle ke opening par short position enter karte hain jo bearish kicker ke baad hoti hai. Stop-loss orders ko bullish candle ke high ke upar place karein taake risk ko manage kiya ja sake. Profit targets ko key support levels, Fibonacci retracement levels, ya ek predetermined risk-reward ratio ke basis par set karein.
      5. Market Conditions Ka Monitoring Karein: Forex markets mukhtalif factors se mutasir hote hain, jin mein economic data releases, geopolitical events, aur central bank policies shamil hain. Traders ko in factors se agah rehna chahiye kyunke yeh technical patterns ki effectiveness ko mutasir kar sakte hain. Misal ke taur par, ek major economic announcement ek Bearish Kicker Pattern ko invalid kar sakta hai agar yeh significant market sentiment ko badal de.


      Bearish Kicker Pattern in Action
      Bearish Kicker Pattern ke amli istimaal ko illustrate karne ke liye, chaliye ek hypothetical scenario ko dekhte hain jo EUR/USD currency pair se mutaliq hai. Samjhiye ke pair ek strong uptrend mein raha hai, jo Eurozone se aane wale positive economic data ki wajah se driven hai. Lekin, traders cautious hain kyunke pair ek significant resistance level ke qareeb hai.

      Ek daily chart par, ek bullish candle banti hai, jo ongoing uptrend ko reflect karti hai. Agle din, lekin, ek bearish candle pehli bullish candle ke close ke neeche open hoti hai aur sharp niche jati hai, jo Bearish Kicker Pattern ko banati hai. Bearish candle ke formation ke doran volume significantly high hai, jo sentiment ke shift ko confirm karta hai.

      Is information ka use karte hue, ek trader agle candle ke opening par short position enter kar sakta hai. Risk ko manage karne ke liye, ek stop-loss order bullish candle ke high ke bilkul upar place kiya jata hai. Trader ek profit target ek key support level par set karta hai, jo recent uptrend ka 50% Fibonacci retracement bhi ho sakta hai.

      Jese jese din guzar rahe hain, EUR/USD pair decline hota hai, support level tak pohanchta hai, aur trader apni position ko profit ke sath exit karta hai. Yeh case study Bearish Kicker Pattern ko technical analysis aur risk management ke sath combine karne ki importance ko underscore karti hai.

      Limitations aur Considerations
      Bearish Kicker Pattern ek robust tool hai trader ke arsenal mein, lekin yeh infallible nahi hai. Kuch limitations aur considerations hain jo madde nazar rakhnay chahiye:
      1. False Signals: Kisi bhi technical pattern ki tarah, Bearish Kicker bhi false signals produce kar sakta hai. Sabhi patterns ek significant downtrend ka sabab nahi bante, aur kabhi kabhi market jaldi se phir se reverse ho sakta hai. Isliye confirmation with other indicators aur volume zaroori hai.
      2. Market Conditions: Pattern ki effectiveness market conditions par depend karti hai. Highly volatile ya news-driven markets mein patterns kam reliable ho sakte hain. Traders ko broader market context se aware rehna chahiye jab Bearish Kicker Pattern ko interpret kar rahe hon.
      3. Risk Management: Kisi bhi pattern ko trade karte waqt proper risk management essential hai. Yeh appropriate stop-loss levels aur position sizing ko set karna shamil hai taake potential losses manageable hon. Over-leveraging ya risk management principles ko nazarandaz karna significant losses ka sabab ban sakta hai, chahe pattern sahi identify hi kyun na kiya gaya ho.
      4. Time Frame: Bearish Kicker Pattern ki reliability mukhtalif time frames par vary kar sakti hai. Daily aur longer-term charts par yeh effective ho sakta hai, lekin shorter time frames, jaise 5-minute ya 15-minute charts par iski reliability kam ho sakti hai noise aur volatility ki wajah se.
      Bearish Kicker Pattern ek powerful reversal signal hai jo forex traders ko market ke potential turning points identify karne mein madad deta hai. Iske formation, ahmiyat aur amli istimaal ko samajhne se traders apni ability ko enhance kar sakte hain bearish reversals ko anticipate karne aur informed trading decisions lene ke liye. Lekin, is pattern ko dusre technical indicators, volume analysis, aur sound risk management practices ke sath use karna zaroori hai taake iski effectiveness ko maximize kiya ja sake. Yeh pattern ek valuable tool hai, lekin yeh ek comprehensive trading strategy ka hissa hona chahiye jo broader market context aur individual trader objectives ko madde nazar rakhe.
      Believe in yourself and your abilities. When you fight for your dreams, you can achieve anything.
      • #4 Collapse

        Bearish Kicker Pattern: Ek Jame Article

        Trading aur technical analysis mein candlestick patterns kaafi important hote hain, aur in patterns ko samajhna successful trading ke liye zaroori hai. Aaj hum ek aise pattern ke bare mein baat karenge jo ek strong trend reversal ko indicate karta hai - Bearish Kicker Pattern.
        Bearish Kicker Pattern Kya Hai?


        Bearish Kicker Pattern ek candlestick pattern hai jo typically do candles se milkar banta hai. Yeh pattern tab hota hai jab market sentiment abruptly bullish se bearish mein convert ho jata hai. Yeh pattern market mein ek sudden aur significant change ko show karta hai.
        Bearish Kicker Pattern Kaise Pehchanein?


        Is pattern ko pehchanne ke liye humein do consecutive candles ko dekhna hota hai:
        1. First Candle: Pehli candle ek bullish candle hoti hai jo market ka upward movement show karti hai. Yeh green color ki hoti hai aur us din ka close price opening price se zyada hota hai.
        2. Second Candle: Dusri candle ek bearish candle hoti hai jo pehli candle ke open price se neeche open hoti hai aur us din ka close price opening price se kaafi neeche hota hai. Yeh red color ki hoti hai aur yeh strong bearish sentiment ko show karti hai.
        Is Pattern Ka Kya Matlab Hai?


        Bearish Kicker Pattern ka yeh matlab hota hai ke market sentiment mein ek sudden aur significant change aya hai. Jab yeh pattern form hota hai, to yeh indicate karta hai ke buyers ki strength kam ho gayi hai aur sellers ne control le liya hai. Yeh pattern ek strong signal hota hai ke market trend reverse ho gaya hai aur prices neeche jaane ki sambhavana hai.
        Bearish Kicker Pattern Ka Significance
        • Trend Reversal: Yeh pattern ek strong trend reversal ko indicate karta hai, jo traders ko apni trading strategy ko adjust karne ka signal deta hai.
        • High Volume: Yeh pattern usually high trading volume ke sath aata hai jo market participants ke strong conviction ko show karta hai.
        • Strong Bearish Sentiment: Yeh pattern strong bearish sentiment ko represent karta hai, jo potential selling opportunity ko highlight karta hai.
        Bearish Kicker Pattern Ko Kaise Trade Karein?


        Agar aapko Bearish Kicker Pattern dikhta hai, to yeh ek strong signal hai ke market trend neeche jaane wala hai. Traders is signal ko use kar ke short selling ya selling positions le sakte hain. Lekin, hamesha yaad rakhein ke technical analysis ke sath-sath aapko fundamental analysis aur market conditions ko bhi consider karna chahiye.
        Conclusion


        Bearish Kicker Pattern ek powerful candlestick pattern hai jo ek significant trend reversal ko indicate karta hai. Is pattern ko samajhne aur identify karne se traders ko market trends ko better samajhne mein madad milti hai aur profitable trading decisions lene ka mauka milta hai. Trading mein successful hone ke liye, technical patterns ke sath-sath market ki overall dynamics ko samajhna bhi zaroori hai.


        • #5 Collapse

          Bearish Kicker Pattern kya hy?

          Bearish Kicker Pattern aik candlestick pattern hota hai jo trading charts par bearish reversal signal ko indicate karta hai. Yeh pattern do candlesticks par mabni hota hai aur iska mukhtasir bayan kuch is tarah se hai:
          Click image for larger version

Name:	5.jpg
Views:	27
Size:	32.4 کلوبائٹ
ID:	12966875
          Bearish Kicker Pattern Ki Tafseel:
          1. Pehli Candlestick:
            • Pehli candlestick bullish hoti hai.
            • Yeh positive trend ko show karti hai.
            • Iski body solid aur green hoti hai.
          2. Doosri Candlestick:
            • Doosri candlestick bearish hoti hai.
            • Yeh negative trend ko show karti hai.
            • Iski body solid aur red hoti hai.
            • Yeh pehli candlestick ke close hone ke baad shuru hoti hai aur bina kisi gap ke niche open hoti hai.
            • Yeh pehli candlestick ke open level ke kareeb open hoti hai ya usse bhi niche.
          Pattern Ki Shakal:
          • Yeh pattern bilkul seedha ulta hota hai Bullish Kicker Pattern ke, jahan bullish candlestick ke baad seedha bearish candlestick shuru hoti hai.
          • Yeh pattern indicate karta hai ke market mein bearish sentiment strong ho gaya hai aur price action ab neeche ki taraf move karega.
          Bearish Kicker Pattern Ka Analysis:
          • Reversal Signal: Yeh pattern ek strong bearish reversal signal hota hai. Iska matlab yeh hai ke agar market pehle uptrend mein tha to ab downtrend mein shift ho sakta hai.
          • Volume Confirmation: Agar doosri candlestick high volume ke sath banti hai to is pattern ki authenticity aur bhi barh jati hai.
          • Trading Strategy: Jab yeh pattern dekhne ko milta hai, traders ko apne long positions ko close karne aur short positions ko open karne par ghaur karna chahiye. Stop loss pehli candlestick ke upper shadow ke thoda upar lagana chahiye.
          Misal:

          Agar aapko daily chart par Bearish Kicker Pattern dekhne ko milta hai aur aap ek bullish trend mein trading kar rahe hain, to yeh signal de raha hai ke trend ab reverse ho raha hai. Aap apni bullish position ko close kar sakte hain aur bearish position khol sakte hain.

          Bearish Kicker Pattern ke Characteristics:

          Bearish Kicker Pattern ke kuch khas characteristics hain jo is pattern ko pehchanne aur samajhne mein madadgar hote hain. Yeh characteristics nimnalikhit hain:
          Bearish Kicker Pattern ke Characteristics:
          1. Do Candlesticks Par Mabni:
            • Yeh pattern do candlesticks par mabni hota hai: pehli bullish candlestick aur doosri bearish candlestick.
          2. Pehli Candlestick:
            • Pehli candlestick bullish hoti hai.
            • Iski body solid aur green hoti hai.
            • Yeh candlestick uptrend ko reflect karti hai.
          3. Doosri Candlestick:
            • Doosri candlestick bearish hoti hai.
            • Iski body solid aur red hoti hai.
            • Yeh candlestick pehli candlestick ke close hone ke baad bilkul opposite direction mein shuru hoti hai.
          4. Gapless Transition:
            • Doosri candlestick pehli candlestick ke close hone ke baad bina kisi gap ke niche open hoti hai.
            • Yeh usually pehli candlestick ke open level ya usse bhi niche open hoti hai.
          5. Strong Reversal Signal:
            • Yeh pattern ek strong bearish reversal signal hota hai.
            • Yeh indicate karta hai ke bullish trend khatam ho gaya hai aur bearish trend shuru ho raha hai.
          6. Volume Confirmation:
            • Agar doosri candlestick high volume ke sath banti hai to is pattern ki strength aur bhi barh jati hai.
            • High volume confirm karta hai ke market participants is reversal ko support kar rahe hain.
          7. No Upper Shadow (Optional):
            • Doosri candlestick mein upper shadow bohot choti ya bilkul na ho to yeh pattern aur bhi strong hota hai.
            • Yeh indicate karta hai ke selling pressure bohot zyada hai.
          8. Psychological Impact:
            • Yeh pattern traders aur investors ke liye psychological impact rakhta hai.
            • Bullish sentiment ke baad suddenly bearish sentiment strong ho jana market mein panic ya sudden shift ko show karta hai.
          Summary:

          Bearish Kicker Pattern market mein significant trend reversal ka indication deta hai. Yeh pattern pehchanna asaan hota hai agar aap in characteristics ko dhyan mein rakhein:
          1. Pehli bullish candlestick.
          2. Doosri bearish candlestick.
          3. Doosri candlestick ka gapless transition.
          4. Strong volume confirmation.
          5. No upper shadow in the second candlestick (optional but stronger signal).
          Is pattern ko dekh kar traders apne trading decisions ko adjust kar sakte hain aur potential downtrend ke liye prepare ho sakte hain.

          Conclusion:
          Bearish Kicker Pattern ek powerful tool hai jo aapko market ke trend reversal ke signals de sakta hai. Is pattern ko samajhna aur effectively use karna Forex trading mein faydemand ho sakta hai. Trading decisions lete waqt hamesha additional confirmations aur market conditions ko bhi madde nazar rakhna zaruri hai.


          • #6 Collapse

            Bearish Kicker Pattern Forex Trading Mai:

            Forex trading mai, Bearish Kicker Pattern ek trend reversal pattern hai. Is pattern ko samajhna aur use karna forex traders ke liye bahut zaroori hai.

            Kicker Pattern Ka Introduction.

            Click image for larger version

Name:	images (19).jpeg
Views:	29
Size:	55.7 کلوبائٹ
ID:	12966945

            Kicker pattern ek candlestick pattern hai jisme do consecutive candles hote hai jinmein pehle candle ka close higher hota hai aur dusre candle ka open lower hota hai. Ye pattern trend reversal ke liye bahut powerful hai.

            Bearish Kicker Pattern Kya Hai?

            Bearish Kicker Pattern me pehla candle bullish hota hai aur dusra candle bearish hota hai. Dusra candle pehle candle ke close se below open hota hai. Ye pattern bearish trend ki shuruwat batata hai aur traders is pattern ko sell signal ke liye use karte hai.

            Click image for larger version

Name:	images (24).png
Views:	19
Size:	5.3 کلوبائٹ
ID:	12966946

            Bearish Kicker Pattern Ka Use Kaise Kare?

            Bearish Kicker Pattern ko use karne ke liye traders ko pehle trend ko identify karna hoga. Agar trend bullish hai to bearish kicker pattern ka use karna risk yukt hai. Agar trend bearish hai to traders is pattern ko sell signal ke liye use kar sakte hai.

            Click image for larger version

Name:	images (20).jpeg
Views:	23
Size:	64.0 کلوبائٹ
ID:	12966947

            Traders is pattern ko confirm karne ke liye volume aur price action ka bhi dhyan rakhte hai. Agar volume aur price action bhi bearish hai to traders is pattern ko confirm kar sakte hai.

            Conclusion:

            Bearish Kicker Pattern ek powerful pattern hai jo bearish trend ki shuruwat batata hai. Traders ko is pattern ko identify karna aur use karna sikhna chahiye. Is pattern ko confirm karne ke liye volume aur price action ka bhi dhyan rakha jana chahiye.


            • #7 Collapse

              What is Bearish Kicker Pattern

              Bearish Kicker Pattern ek candlestick pattern hai jo bearish reversal ko darust karta hai. Ye pattern typically uptrend ke dauraan dekha jata hai aur bearish trend ka signal deta hai. Yeh kaise hota hai:
              Formation

              Bearish kicker pattern jab banega, pehle ek uptrend hona chahiye. Phir ek large bullish candlestick aati hai jo higher open aur higher close ke saath hoti hai. Uske baad ek doosri candlestick aati hai, typically smaller in size, jo bearish hoti hai aur pehli candlestick ke upper half ke andar open hoti hai. Iska close bhi pehli candlestick ke lower half ke andar hota hai, indicating a complete reversal of the previous bullish momentum.

              Confirmation

              Bearish kicker pattern ko dekhne ke baad traders usually wait karte hain for confirmation, jaise ke ek aur bearish candlestick ya phir bearish indicators jaise ke RSI ya MACD ki bearish divergence. Confirmation ke bina, ye pattern kam reliable hota hai.

              Volume

              Ideal scenario mein, bearish kicker pattern ke formation ke waqt volume increase hota hai, indicating strong selling pressure aur higher probability of a bearish reversal.

              Target

              Bearish kicker pattern ka target usually previous uptrend ke starting point ya phir support level ke paas hota hai. Traders is pattern ko dekhte hue selling positions enter karte hain, stop-loss ko high of the bullish candlestick ke above rakhte hain, aur target ko support level ke near rakhte hain.

              Risk Management

              Jaise ke har trading strategy mein, bearish kicker pattern ko trade karte waqt bhi risk management ka dhyaan rakhna zaroori hai. Traders ko apni position size ko manage karna chahiye aur stop-loss ka istemal karke apne losses ko control mein rakhna chahiye.

              Overall, bearish kicker pattern ek powerful bearish reversal signal hai, lekin iska istemal karne se pehle traders ko confirmatory signals aur risk management ko bhi madde nazar rakhna chahiye.
              • #8 Collapse

                ### Bearish Kicker Pattern: A Powerful Bearish Reversal Signal

                The Bearish Kicker Pattern is a significant tool in the realm of technical analysis, used to predict a potential reversal in a stock's price direction from an upward trend to a downward trend. Recognized for its strong indication of a sudden shift in market sentiment, this candlestick pattern is essential for traders aiming to anticipate market turns and make informed decisions.

                #### Characteristics of the Bearish Kicker Pattern

                1. **First Candlestick**: The pattern starts with a solid bullish candlestick. This candlestick usually indicates continued upward momentum, marked by a long body that opens near its low and closes near its high. This movement suggests that buyers have strong control over the market.

                2. **Second Candlestick**: The following day, a bearish candlestick appears, which opens significantly lower than the close of the first candlestick, creating a gap down. This bearish candlestick also has a long body and closes near its low, reflecting strong selling pressure. The sharp gap down indicates a dramatic shift in market sentiment.

                3. **No Overlap**: A critical feature of the Bearish Kicker Pattern is the lack of overlap between the bodies of the two candlesticks. The opening price of the second candlestick is much lower than the closing price of the first candlestick, underscoring the abrupt change in investor sentiment from bullish to bearish.

                #### Interpretation

                The Bearish Kicker Pattern serves as a potent signal of a sudden and decisive change in investor sentiment. The gap down on the second day highlights that sellers have taken control, pushing the price down significantly. This pattern is typically observed after an uptrend and can indicate the beginning of a downward trend. For traders, this pattern is a signal to exit long positions or enter short positions in anticipation of continued downward movement.

                #### Example in Practice

                Consider a stock that has been in an uptrend, closing with a strong bullish candlestick on the first day. On the second day, the stock opens significantly lower than the previous day's close, forming a bearish candlestick that closes near its low, without overlapping the body of the first day's candlestick. This abrupt change in direction signifies a strong bearish sentiment, indicating that sellers are now in control.

                #### Practical Usage in Trading

                While the Bearish Kicker Pattern is a robust signal by itself, traders often look for additional confirmation from other technical indicators or chart patterns before making trading decisions. For instance, high trading volume on the second candlestick can add further validity to the pattern, showing strong participation by sellers. This pattern can also be confirmed by other indicators such as moving averages, relative strength index (RSI), or trend lines.

                **Risk Management**: When trading based on the Bearish Kicker Pattern, it is crucial to implement proper risk management strategies. This includes setting stop-loss orders to protect against unexpected price movements and determining position sizes that align with the trader's risk tolerance.

                **Context Matters**: Traders should also consider the broader market context when interpreting the Bearish Kicker Pattern. Factors such as overall market trends, economic indicators, and sector performance can impact the pattern's reliability and the subsequent price movement.

                #### Conclusion

                The Bearish Kicker Pattern is a reliable and powerful bearish reversal signal that indicates a significant change in market sentiment. By understanding and recognizing this pattern, traders can identify potential shorting opportunities and better anticipate market movements. However, it is essential to confirm this pattern with other technical indicators and to implement sound risk management practices. This approach ensures that traders can make more informed decisions and effectively navigate the complexities of the financial markets.
                • #9 Collapse

                  Bearish Kicker Pattern: Roman Urdu Mein Samjhaani


                  Bearish Kicker Pattern aik technical analysis ka tool hai jo stock market mein price reversal ko indicate karta hai. Yeh pattern bohot important hai traders aur investors ke liye kyunki yeh unhein market ke trend ke baare mein pehle se aagaah kar deta hai.
                  Bearish Kicker Pattern Kya Hai?


                  Bearish Kicker Pattern do candlesticks ka combination hota hai. Pehli candlestick bullish hoti hai, jo ke green ya white color mein hoti hai aur yeh price increase ko represent karti hai. Doosri candlestick bearish hoti hai, jo ke red ya black color mein hoti hai aur yeh price decline ko show karti hai. Important baat yeh hai ke doosri candlestick pehli candlestick ke closing price se neeche open hoti hai aur poora din decline karti rehti hai.
                  Pattern Ki Shakal
                  1. Pehli Candlestick: Yeh bullish hoti hai, iska matlab yeh hai ke opening price low aur closing price high hota hai. Yeh is baat ka indication hoti hai ke market mein bullish sentiment hai.
                  2. Doosri Candlestick: Yeh bearish hoti hai, aur yeh pehli candlestick ke closing price se neeche open hoti hai. Iska matlab yeh hota hai ke market mein bearish sentiment hai aur investors price ko neeche le ja rahe hain.
                  Interpretation Aur Importance


                  Bearish Kicker Pattern yeh signal deta hai ke market sentiment suddenly change ho gaya hai. Yeh pattern aksar market ke top par banta hai jab bullish trend bearish trend mein convert hota hai. Is pattern ke aane ke baad price aksar aur neeche girti hai, is liye yeh pattern sell signal provide karta hai.
                  Strategy Aur Trading Tips
                  1. Confirmation: Jab Bearish Kicker Pattern bane, toh aapko doosre technical indicators jaise ke volume aur moving averages bhi check karne chahiye taake confirmation mil sake.
                  2. Stop Loss: Jab aap trade enter karein, toh stop loss zaroor set karein takay aapke losses limited rahein. Yeh stop loss pehli candlestick ke high ke upar set karna chahiye.
                  3. Risk Management: Aapko apne portfolio ka sirf chhota hissa is trade mein lagana chahiye. Yeh ensure karega ke agar trade unsuccessful bhi ho, toh bhi aapke overall portfolio par bohot zyada negative impact nahi padega.
                  Example


                  Suppose karein ke aik stock $100 par trade kar raha tha aur pehli bullish candlestick ke baad yeh $105 par close hua. Agle din, yeh stock $95 par open hota hai aur wahan se aur neeche gir kar $90 par close hota hai. Yeh typical Bearish Kicker Pattern hai.
                  Conclusion


                  Bearish Kicker Pattern aik powerful tool hai jo aapko market ke trend reversal ke baare mein pehle se aagaah kar sakta hai. Is pattern ko samajhna aur iske signals ko effectively use karna trading mein bohot madadgar sabit ho sakta hai. Lekin hamesha yaad rakhein ke trading risky hoti hai, is liye hamesha proper risk management aur strategy ko follow karein.

                  Bearish Kicker Pattern ka theek tareeke se istemal aapko market ke bearish phases se bacha sakta hai aur aapke trading returns ko improve kar sakta hai.
                  • <a href="https://www.instaforex.org/ru/?x=ruforum">InstaForex</a>
                  • #10 Collapse

                    **Bearish Kicker Pattern Kya Hai?**
                    Bearish Kicker Pattern ek technical analysis pattern hai jo price charts par bearish trend reversal ka indication deta hai. Yeh pattern traders ko market ke potential downward movements ke baare mein signal provide karta hai. Is pattern ko samajhna aur identify karna trading decisions ko enhance kar sakta hai. Aaiye, detail mein samjhte hain ke Bearish Kicker Pattern kya hai aur iska trading mein kya role hota hai.

                    **1. Bearish Kicker Pattern Ki Tashreeh**

                    Bearish Kicker Pattern ek two-candlestick pattern hota hai jo market ke uptrend ke baad form hota hai. Is pattern ki khasiyat yeh hai ke pehli candlestick ke baad agle din ek strong bearish gap open hota hai, jo market ke bearish reversal ko indicate karta hai.

                    - **Pehli Candlestick**: Pehli candlestick ek strong bullish candlestick hoti hai jo market ke uptrend ko represent karti hai. Is candlestick ka closing price high hota hai aur market ke positive sentiment ko dikhata hai.

                    - **Doosri Candlestick**: Doosri candlestick ek strong bearish candlestick hoti hai jo pehli candlestick ke closing price se niche open hoti hai. Is candlestick ka opening price pehli candlestick ke closing price ke niche hota hai, jise gap down kaha jata hai. Yeh gap bearish sentiment aur market ke potential reversal ko indicate karta hai.

                    **2. Pattern Ki Significance**

                    - **Bearish Reversal**: Bearish Kicker Pattern market ke existing uptrend ke baad bearish reversal signal provide karta hai. Jab doosri candlestick gap down ke saath open hoti hai aur strong bearish momentum ko show karti hai, to yeh signal hai ke buyers ki strength kam ho gayi hai aur sellers dominate kar rahe hain.

                    - **Confirmation**: Pattern ke confirmation ke liye, doosri candlestick ke closing price ke niche break hona zaroori hai. Isse pattern ki validity confirm hoti hai aur traders ko selling positions open karne ka signal milta hai.

                    **3. Trading Strategy**

                    - **Entry Point**: Trading ke liye, pattern ke complete hone ke baad entry point consider kiya jata hai. Jab doosri candlestick bearish gap ke saath open hoti hai aur market downward move karti hai, to selling positions open ki ja sakti hain.

                    - **Stop-Loss Orders**: Risk management ke liye, stop-loss orders ko pehli candlestick ke high ke upar place karna chahiye. Yeh unexpected price movements se bachne ke liye zaroori hai aur potential losses ko limit karta hai.

                    - **Target Setting**: Target setting ke liye, traders ko market ke support levels aur previous price actions ko analyze karna chahiye. Yeh potential downside targets ko estimate karne mein madad karta hai.

                    **4. Limitations**

                    - **False Signals**: Bearish Kicker Pattern kabhi kabhi false signals bhi generate kar sakta hai. Isliye, pattern ko validate karne ke liye additional technical indicators aur volume analysis ka use karna zaroori hai.

                    - **Market Conditions**: Pattern ki effectiveness market conditions ke hisaab se vary kar sakti hai. Trending aur high volatility markets mein pattern ka performance different ho sakta hai.

                    In conclusion, Bearish Kicker Pattern forex trading mein ek useful tool hai jo bearish trend reversals ko identify karne mein madad karta hai. Is pattern ki sahi pehchaan aur confirmation ke saath, traders market ke potential downward movements ko effectively predict kar sakte hain aur apni trading strategies ko optimize kar sakte hain.

                    اب آن لائن

                    Working...
                    X