Rectangle Patterns Trading Strategy Guide
X
  • وقت
  • دکھائیں
Clear All
new posts
  • #1 Collapse

    Rectangle Patterns Trading Strategy Guide

    Introduction

    Rectangle patterns trading strategy ek popular technical analysis tool hai jo traders ko market trends aur price movements ka analysis karne mein madad karta hai. Ye patterns rectangle ya box shape mein hoti hain aur market mein consolidation period ko darust karti hain. Is guide mein, rectangle patterns trading strategy ke mool concepts aur istemal ke tareeqay ke bare mein bataya gaya hai.Rectangle patterns trading strategy ek powerful tool hai jo traders ko market mein price movements ka analysis karne mein madad karta hai. Is guide mein, rectangle pattern ki pehchan, istemal aur trading strategy ke mool tareeqay ko samjha gaya hai. Ye strategy traders ke liye ek ahem tool hai jo unhe market mein trading opportunities ka pata lagane mein madad karta hai.

    Click image for larger version

Name:	images (1).png
Views:	50
Size:	16.3 کلوبائٹ
ID:	12833923

    Rectangle Pattern Kya Hai

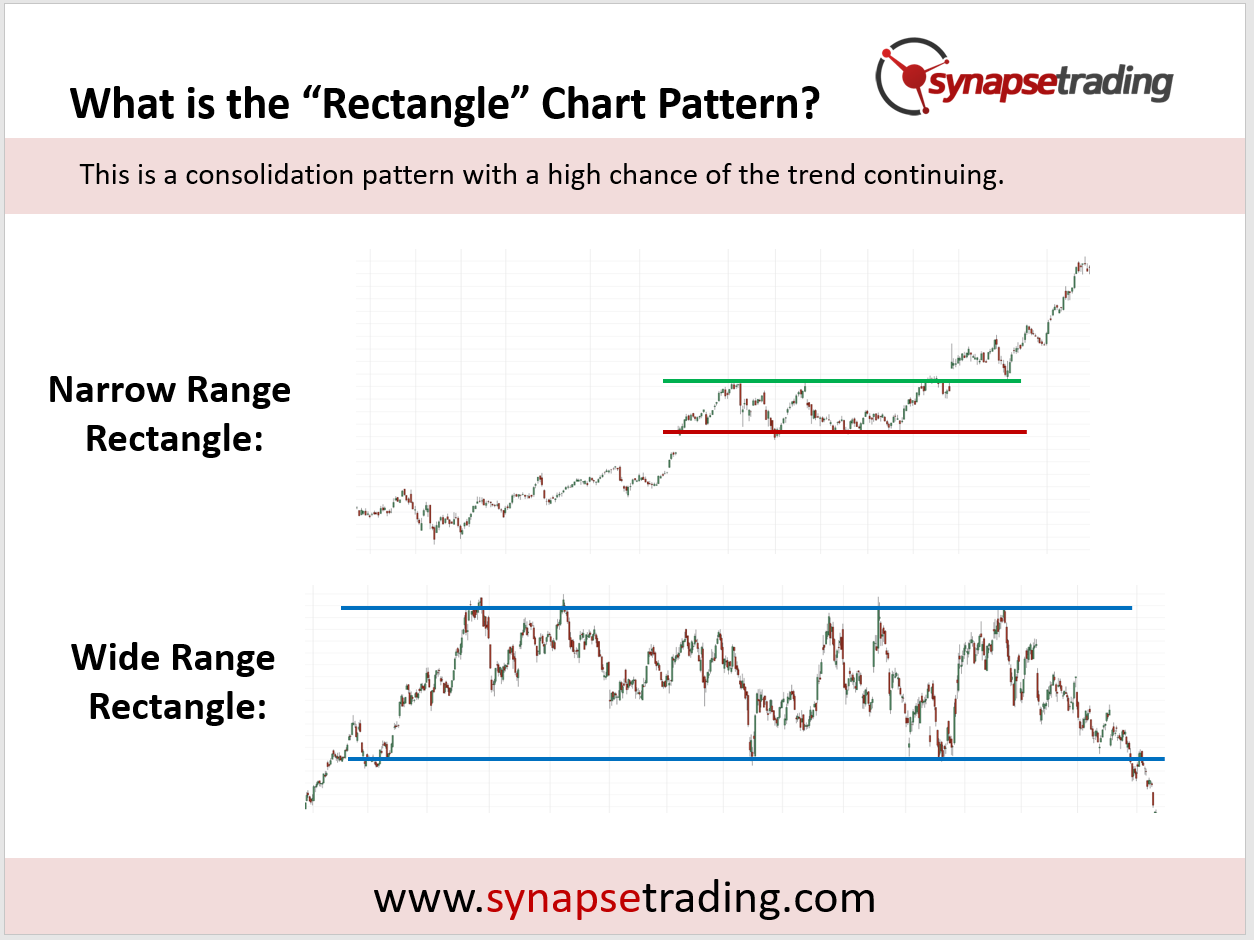
    Rectangle pattern ek price action pattern hai jo price movement ko rectangle ya box shape mein darust karta hai. Ye pattern market mein consolidation period ko darust karta hai jab prices ek range mein trade karte hain.

    Rectangle Pattern Ki Identification

    Rectangle pattern ki pehchan karne ke liye, aapko horizontal support aur resistance lines ko identify karna hota hai jo price range ko define karte hain. Rectangle pattern mein, prices range mein trade karte hain aur support aur resistance levels barabar hote hain.

    Click image for larger version

Name:	images (2).png
Views:	35
Size:	2.0 کلوبائٹ
ID:	12833924

    Rectangle Pattern Ka Istemal

    Rectangle pattern ka istemal karne ke liye, aapko entry aur exit points ko identify karna hota hai. Entry point usually rectangle pattern ke breakout ke baad hota hai jab price support ya resistance level ko cross karta hai. Exit point support aur resistance levels ke paas rakha jata hai.

    Rectangle Pattern Trading Strategy

    Rectangle pattern trading strategy ka istemal karne ke liye, aapko ye steps follow karne hote hain.
    1. Rectangle Pattern Ki Peahchan: Pehle rectangle pattern ko identify karen.
    2. Support Aur Resistance Levels Ka Pata Lagana: Rectangle pattern ke support aur resistance levels ko identify karen.
    3. Entry Point Ka Intezar Karna: Entry point ka intezar karen jab price support ya resistance level ko cross karta hai.
    4. Stop Loss Aur Take Profit Levels Set Karna: Stop loss aur take profit levels ko set karen support aur resistance levels ke nazdeek.
    Click image for larger version

Name:	images.jpeg
Views:	41
Size:	44.9 کلوبائٹ
ID:	12833925

    Rectangle Pattern Trading Ka Example

    Maan lijiye aap ek stock ka chart dekh rahe hain aur aapne rectangle pattern identify kiya hai. Support level $50 aur resistance level $60 hai. Agar price $60 ko break kar ke upar jata hai, to aap long position le sakte hain with a stop loss of $55 aur take profit target of $70.

    Rectangle Pattern Trading Ki Ahmiyat

    Rectangle pattern trading strategy ki ahmiyat ye hai ke ye traders ko entry aur exit points ka pata lagane mein madad karta hai jab market mein consolidation hoti hai. Is strategy ke istemal se traders ko potential profit opportunities mil sakti hain.


  • <a href="https://www.instaforex.org/ru/?x=ruforum">InstaForex</a>
  • #2 Collapse

    Introduction


    forex market mein rectangle chart pattern aik kesam ka pattern hota hey jo keh forex markt mein honay wale movement ko he identify karta hey yeh forex market kay anay walay pattern mein trend mein gap ke khasoseyat ko he identify karta hey jo keh forex market mein support or resistance ke aik he movement hote hey pattern aa tor par forex market kay asal trend ke strength ko he increase karta hey pattern aamm tor par majodah trend ke asal direction ko increase karnay kay ley stable price ko he identify karta hey
    Click image for larger version

Name:	rectangle-pattern-for-trading-breakouts_body_SidewaysGraphes_02.png
Views:	122
Size:	11.0 کلوبائٹ
ID:	12833953
    forex market kay upper or lower bound kay out ho janay kay bad confirmation wale candlestick he rectangle pattern he ho sakte hey upper trend jare breakout ke direction ko he indicate kar sakta hey jaree trend breakout ke direction ke taraf he eshara kar sakte hey forex market kay overall chart ka analysis kartayhovay forex mumkana level ko he identify keya ja sakta hey

    Types of rectangle chart pattern

    1 Bullish rectangle pattern
    2 Bearish rectangle pattern

    Bullish Rectangle Pattern

    Forex market mein yeh aik jare pattern hota hey jes kay tahat trader long position ke taraf ennter honay kay ley daikh saktay hein jes mein forex market ke price support mein he break ho jate hey breakout zone kay inside kay zone men he chale jate hey
    Click image for larger version

Name:	rectangle-pattern-for-trading-breakouts_body_BULLISHRECTANGLE.png
Views:	35
Size:	10.4 کلوبائٹ
ID:	12833954

    Bearish Rectangle Pattern

    Bearish rectangle pattern aik downtrend ka jare pattern hota hey jes kay tahat forex market ke price support say he break ho jate hey breakout zon kay inside mein close honay kay bad traderr short position mein enter hotay naar atay hein
    Click image for larger version

Name:	rectangle-pattern-for-trading-breakouts_body_BEARISHRECTANGLE.png.full.png
Views:	35
Size:	8.3 کلوبائٹ
ID:	12833955


    Trading example

    forex market ka nechay AUD/USD ka chart nechay deya geya jo keh forex market kay effective chart pattern ka estamal keya jata hey
    Click image for larger version

Name:	rectangle-pattern-for-trading-breakouts_body_tradingtherectangle.png
Views:	38
Size:	15.9 کلوبائٹ
ID:	12833956
    forex market ke oper de gay mesal mein aik bearish rectangle chart pattern ke mesal de gay hey jes ko nellay rang ke trend line say wazah kar deya geya hey jo keh forex market ke lower level or lower highs ko break karta hey rectagle chart pattern os time banana start karta hey jab price zamne movement start kar dayte hey yeh side way movement support or resistance say he attached hote hey
    Last edited by ; 18-02-2024, 09:25 AM.
    bhali kay badlay bhali
    • #3 Collapse

      Rectangle Pattern Trading Strategy Guide


      Rectangle pattern ek mukhtalif trading strategy hai jo chart analysis par mabni hai aur traders ko potential trading opportunities provide karti hai. Ye pattern typically sideways market conditions mein dekha jata hai jab price ek specific range mein move karta hai.

      Rectangle pattern ko identify karne ke liye, traders ko price chart par horizontal support aur resistance levels ko dekhna hota hai jo price ke around develop hote hain. Ye levels typically ek rectangle shape create karte hain.

      Rectangle pattern ki trading strategy ko samajhne ke liye, traders ko niche diye gaye steps ko follow karna chahiye:

      1. **Rectangle Pattern Identification**: Sab se pehle, traders ko rectangle pattern ko identify karna hota hai. Iske liye, price chart par horizontal support aur resistance levels ko dekhna hota hai jo price ke around form hote hain.

      2. **Entry Point Determine Karna**: Rectangle pattern mein entry point determine karna important hai. Entry point typically rectangle ke upper resistance level ke breakout ya lower support level ke breakdown ke baad hota hai.

      3. **Stop Loss Aur Target Levels Set Karna**: Har trading strategy mein stop loss aur target levels set karna zaroori hota hai. Agar trader buy position le raha hai to stop loss typically rectangle ke neeche aur target level rectangle ke upper side set kiya jata hai. Agar trader sell position le raha hai to stop loss rectangle ke upper side aur target level rectangle ke neeche set kiya jata hai.

      4. **Risk Management**: Har trading strategy mein risk management ka khayal rakhna zaroori hai. Rectangle pattern trading mein bhi risk management keya jana chahiye. Jitna ho sake, sirf ek chhota portion of trading account per trade kiya jana chahiye.

      5. **Confirmation Ke Liye Indicators Use Karna**: Rectangle pattern ko confirm karne ke liye, traders technical indicators jaise ki volume, RSI, ya MACD ka istemal kar sakte hain.

      6. **Trade Execution**: Rectangle pattern ko identify karne ke baad, entry point determine karne ke baad, aur stop loss aur target levels set karne ke baad, traders trade execute karte hain.

      7. **Trade Management**: Trade ko manage karna bhi important hai. Agar price expected direction mein move nahi kar raha hai, ya phir opposite direction mein move kar raha hai, to traders ko apni strategy ko adjust karna chahiye.

      Rectangle patterns trading strategy ek effective aur reliable method ho sakti hai trading ke liye, lekin ye bhi yaad rakhna zaroori hai ke har trading strategy mein risk involved hota hai aur kisi bhi trading decision se pehle thorough analysis aur research ki zaroorat hoti hai.

      Is strategy ko successfully implement karne ke liye, traders ko patience, discipline, aur continuous learning ki zaroorat hoti hai. Aur hamesha yaad rahe ke risk management aur capital preservation trading ke liye bohot ahem hai.
      • #4 Collapse


        Rectangle Patterns Trading Strategy Guide: Ek Mahir-e-Tijarat ka Rehnuma

        Mukhtasir Tareef: Rectangle Patterns ek mufeed technical analysis tool hain jo traders ko market ke consolidation phases mein trading opportunities dhoondhne mein madad deta hai. Ye pattern market mein range-bound movement ko indicate karta hai jab prices kisi specific range ke andar ghoomte hain.
        Click image for larger version

Name:	rectangle-pattern-trading-strategy-1.png
Views:	31
Size:	192.0 کلوبائٹ
ID:	12834015
        Rectangle Patterns Ka Matlab: Rectangle Patterns ka zikar karte hue, "rectangle" shabd ka matlab hota hai aik geometric shape jo do horizontal lines ke darmiyan bana hota hai. Is pattern mein, prices ek specific price range ke andar aik muddat tak rehti hain, jo ek rectangle ke jaise dikhai deti hai. Ye pattern market mein consolidation ko darust karta hai jab ki traders ka wait hota hai ke market ek specific direction mein move kare.

        Rectangle Patterns Trading Strategy Guide:
        1. Rectangle Ki Shanakht: Sab se pehle, traders ko rectangle pattern ko pehchaanne ki zaroorat hoti hai. Iske liye, wo high aur low prices ko connect kar ke horizontal lines draw karte hain jo ek range ko darust karte hain jahan prices ghoom rahi hain.
        2. Breakout Ki Talaash: Rectangle pattern ke baad, traders breakout ka wait karte hain. Agar price range ko break karte hain aur ek taraf move karte hain, to ye ek potential trading opportunity hai.
        3. Entry Aur Stop Loss Points Ka Taein: Breakout ke baad, traders entry aur stop loss points taein karte hain. Agar price upside break karta hai, to traders long positions enter karte hain aur stop loss ko rectangle ke neechay set karte hain. Agar price downside break karta hai, to traders short positions enter karte hain aur stop loss ko rectangle ke upar set karte hain.
        4. Target Prices Ka Taein: Target prices taein karne ke liye, traders range ki height ko breakout point se mila kar istemal karte hain. Is tarah, wo potential profit targets taein kar sakte hain.
        5. Risk Aur Reward Ka Imtehan: Rectangle pattern trading strategy mein, traders ko hamesha risk aur reward ka imtehan lena chahiye. Agar risk reward ratio behtar hai, to traders position enter karte hain.
        6. Confirmatory Indicators Ka Istemal: Rectangle pattern ke saath confirmatory indicators ka istemal karna bhi ahem hai. Jaise ke volume, momentum oscillators, ya trend indicators jo trading signals ko confirm karte hain.
        Rectangle Patterns Trading Strategy Guide ek aham resource hai jo traders ko market mein consolidation phases mein trading karne mein madad deta hai. Mere tajurbaat ke mutabiq, is strategy ko samajh kar aur sahi tajwezat le kar traders apni trading skills ko improve kar sakte hain aur consistent profits hasil kar sakte hain. Magar, hamesha zaroori hai ke traders apni analysis ko confirmatory indicators ke saath istemal karein taake sahi trading decisions liye ja sakein.

        • #5 Collapse


          Rectangle Patterns Trading Strategy Guide: Ek Aham Technical Analysis Tool

          Rectangle pattern ek aham aur common technical analysis tool hai jo traders ko market ke price movements ke patterns ko samajhne mein madad karta hai. Is article mein hum rectangle patterns ke trading strategy guide ke roman Urdu mein tafseel se bayan karenge.
          Click image for larger version

Name:	bearish-rectangle-pattern.png
Views:	36
Size:	13.3 کلوبائٹ
ID:	12834068
          Rectangle Patterns Kya Hote Hain?

          Rectangle patterns market mein price consolidation ko darust karte hain. Yeh pattern ek rectangle ke andar price movement ko represent karta hai jahan price ek specific range mein consolidate hota hai. Rectangle pattern mein price horizontal support aur resistance lines ke darmiyan trade karta hai.

          Rectangle Patterns Ka Istemal

          Rectangle patterns ko identify karne ke liye traders ko kuch points ka khayal rakhna chahiye:
          1. Support aur Resistance Lines: Rectangle pattern ko pehchanne ke liye traders ko horizontal support aur resistance lines draw karni chahiye. Yeh lines price ke movement ko limit karte hain aur rectangle shape ko define karte hain.
          2. Volume: Rectangle pattern ke andar volume ki observation bhi important hai. Agar volume rectangle ke andar kam hota hai, to yeh indicate karta hai ke market mein interest kam hai aur breakout hone ke chances zyada hote hain.
          3. Price Consolidation: Rectangle pattern mein price ek specific range mein consolidate hota hai, jahan support aur resistance levels ko respect kiya jata hai. Traders ko price ke movement ko closely monitor karna chahiye, khaaskar jab price rectangle ke andar trade kar raha hota hai.

          Rectangle Patterns Trading Strategy

          Rectangle patterns ki trading strategy ko samajhne ke liye traders ko kuch points ka khayal rakhna chahiye:
          1. Breakout Trading: Rectangle pattern ke breakout ko trade karne ki strategy popular hai. Jab price rectangle ke upper ya lower boundary ko break karta hai, to traders long ya short positions lete hain, depending on the direction of the breakout.
          2. Stop Loss Aur Take Profit Levels: Breakout trading ke doran stop loss aur take profit levels ko define karna important hai. Stop loss levels ko support aur resistance lines ke pass rakha jata hai, jabke take profit levels ko based on previous price movements aur resistance/support levels par rakha jata hai.
          3. Confirmation: Rectangle pattern ke breakout ko confirm karne ke liye traders ko aur technical indicators ka istemal karna chahiye jaise ke volume, RSI, aur moving averages.
          Rectangle patterns trading mein ahem role ada karte hain aur traders ko price movements ko samajhne mein madad karte hain. Lekin yeh patterns akela hi nahi kaafi hote, aur traders ko aur bhi technical analysis ke tools aur indicators ka istemal karna chahiye. Sahi tareeqay se samjha aur istemal kiya gaya, rectangle patterns ek valuable tool ho sakta hai trading mein.

          • #6 Collapse

            Rectangle Patterns Trading Strategy Guide


            Click image for larger version

Name:	download - 2024-02-18T105744.824.png
Views:	42
Size:	3.4 کلوبائٹ
ID:	12834098


            ​​​​​​​
            ​​​​​​​مقدمہ (Introduction):

            Rectangle patterns are a significant aspect of technical analysis in trading. Yeh patterns market mein price movements ko samajhnay mein madadgar hotay hain aur traders ko future price trends ka andaza lagane mein help karte hain. Is trading strategy guide mein, hum rectangle patterns aur unka istemal kar ke trading karne ka tareeqa discuss karenge.

            1. تعارف (Introduction to Rectangle Patterns):

            Rectangle patterns market charts par horizontal lines ki tarah dikhai detay hain. Ye patterns indicate karte hain ke market mein consolidation phase hai, jahan price ek range mein move kar rahi hoti hai. Rectangle patterns mein do parallel lines hoti hain jo price range ko define karti hain.

            2. خصوصیات (Characteristics of Rectangle Patterns):

            Rectangle patterns ke kuch ahem characteristics hain jo traders ko inhe identify karne mein madad deti hain. Inmein shamil hain:
            • Equal Highs and Lows: Rectangle patterns mein price ek horizontal range mein move karta hai, jismein highs aur lows barabar hote hain.
            • Consolidation: Ye patterns market mein consolidation ko represent karte hain, jismein buyers aur sellers ki fight hoti hai lekin koi clear winner nahi hota.

            3. تشخیص (Identifying Rectangle Patterns):

            Rectangle patterns ko identify karna trading ke liye critical hai. Inhein pehchanne ke liye traders ko price chart par dhyan dena chahiye aur do equal highs aur lows ko connect karna chahiye. Agar ye lines parallel hoti hain, toh ye ek rectangle pattern ko represent karti hain.

            4. ٹریڈنگ سٹریٹیجی (Trading Strategy):

            Rectangle patterns trading ke liye versatile hote hain aur traders inhein alag alag tareeqon se istemal kar sakte hain. Kuch common trading strategies hain:
            • Breakout Trading: Jab price rectangle pattern ke upper ya lower boundary ko break karta hai, toh ye breakout signal hota hai. Traders is breakout par trading karte hain expecting ke price trend continue hoga.
            • Range-Bound Trading: Agar price rectangle pattern ke andar hi rehti hai, toh traders range-bound strategy istemal kar sakte hain. Buy near the support line aur sell near the resistance line.

            5. ریسک اور انعامات (Risk and Rewards):

            Har trading strategy mein risk aur rewards ka andaza hona zaroori hai. Rectangle patterns trading mein bhi ye apply hota hai. Agar breakout sahi direction mein hota hai, toh traders ko achi profit mil sakti hai. Lekin agar false breakout hota hai, toh loss bhi ho sakta hai.

            6. مثالوں کے ساتھ تجربہ (Practical Examples):

            Rectangle patterns ko samajhne ke liye kuch practical examples dekhte hain. Suppose ek stock ka price $50 se $60 ke beech mein consolidate ho raha hai, aur ye range rectangle pattern banata hai. Agar price $60 ko breakout karta hai, toh traders ko buy karne ka signal milta hai.

            7. ٹپس اور ہنڈیلنگ (Tips and Guidelines):

            Rectangle patterns trading mein successful hone ke liye kuch tips aur guidelines hain:
            • Confirmation: Always wait for confirmation before entering a trade. Breakout hone ke baad bhi confirmation ke liye thori der ka wait karna important hai.
            • Risk Management: Apne trades ko manage karein aur har ek trade mein kitna risk lena hai ye decide karein.

            8. ختم (Conclusion):

            Rectangle patterns trading mein useful hote hain aur traders ko market trends ka better understanding dete hain. In patterns ko identify karna aur un par trading karna, risk aur rewards ko manage karne mein madad karta hai. Is strategy guide ko follow kar ke, traders rectangle patterns ka istemal karke apne trading skills ko improve kar sakte hain.
            • #7 Collapse

              Introduction of Rectangle Patterns,

              Rectangle Patterns ek ahem technical analysis ka hissa hain jo trading mein istemal hota hai. Yeh patterns market mein hone wale mawafiqat aur takrarat ko darust karti hain aur traders ko trading opportunities faraham karti hain. Iss guide mein, hum Rectangle Patterns Trading Strategy ko samajhenge, jo ke traders ko apni trades ko behtar taur par manage karne mein madadgar sabit ho sakti hai.Rectangle patterns ek tarah ka chart pattern hai jise traders use karte hain market ke movements ko predict karne mein. Yeh patterns market mein hone wale sideways movement ko darust karte hain jab prices ek specific range mein ghoomte hain. Rectangle patterns ek rectangular shape mein dikhte hain aur support aur resistance levels ko define karte hain.

              Click image for larger version

Name:	How-to-Use-Rectangle-Chart-Patterns-to-Trade-Breakouts.png
Views:	43
Size:	107.5 کلوبائٹ
ID:	12834171

              Types of Rectangle Patterns,

              Rectangle patterns do mukhtalif types ke hote hain: Ascending rectangles aur Descending rectangles. Ascending rectangle mein, prices ke peaks constant rehte hain jabke bottoms higher hote hain. Descending rectangle mein, peaks lower hote hain aur bottoms constant rehte hain.

              Rectangle Patterns Formation,

              Rectangle patterns ki tashkeel market mein consolidation ke dauran hoti hai, jab prices ek specific range mein ghoomte hain. Is phase mein, traders ko attentive rehna chahiye kyunki breakout hone wala hota hai. Breakout ke baad, prices mein tezi ya mandi dekhi ja sakti hai.

              Click image for larger version

Name:	grade7-bullish-rectangle-before.png
Views:	30
Size:	9.1 کلوبائٹ
ID:	12834172

              Rectangle Patterns Trading Strategy,

              Rectangle patterns trading strategy ka maqsad yeh hai ke traders ko sahi waqt pe entry aur exit points milen. Is strategy mein, traders rectangle ke andar price ke fluctuations ko closely observe karte hain aur breakout hone par trade karte hain.

              Trade Entry Points,

              Rectangle pattern ke breakout hone par trade entry points ka tay karna bohot zaroori hai. Agar rectangle ascending hai, toh trader long position le sakta hai jab price upper trend line ko break karta hai. Jabke descending rectangle mein, short position le sakte hain jab price lower trend line ko break kare.

              Stop Loss and Take Profit Levels & Risk Management,

              Rectangle patterns trading strategy mein stop loss aur take profit levels ko tay karna bhi ahem hai. Stop loss, trade ki suraksha ke liye hota hai jabke take profit level, traders ko munafa kamane mein madad karta hai. In levels ko sahi taur par tay karna, risk management mein madad karta hai.Rectangle patterns trading strategy mein risk management ka khaas khayal rakhna zaroori hai.

              Click image for larger version

Name:	rectangle.png
Views:	32
Size:	40.7 کلوبائٹ
ID:	12834173

              Traders ko apne trades ke liye tay kardah risk tolerance ke mutabiq position size decide karna chahiye. Isse nuksan se bacha ja sakta hai.Rectangle patterns trading strategy mein kuch caveats bhi hote hain. Yeh strategy sirf ek tool hai aur iska istemal keval technical analysis ke saath hi kiya jana chahiye. Market mein hamesha uncertainty hoti hai, is liye har trade ko carefully plan karna zaroori hai.

              Practice and Continuous Learning,

              Rectangle patterns trading strategy ko behtar taur par samajhne ke liye, practice aur continuous learning ka bhi ahem role hai. Traders ko market trends ko observe karte hue apni skills ko improve karna chahiye.Rectangle patterns trading strategy, market mein mawafiqat aur takrarat ko samajhne mein madad karti hai. Yeh traders ko behtar decision lene mein madad karti hai aur unhe sahi waqt par entry aur exit points milte hain. Lekin, hamesha yaad rahe ke market mein risk hota hai aur har trade ko dhyan se plan karna zaroori hai. Is strategy ko sahi taur par samajhne ke liye, practice aur continuous learning ka hona bhi zaroori hai.

              Click image for larger version

Name:	rsz_rectangle-pattern-bullish.png
Views:	31
Size:	26.9 کلوبائٹ
ID:	12834174
              • #8 Collapse


                Rectangle Patterns Trading Strategy: Trading Mein Mukammal Kamiyabi ke Raaz

                Forex trading mein mukhtalif price patterns ka istemal trading decisions lene ke liye kia jata hai, aur rectangle pattern ek aham aur mufeed pattern hai jo traders ke liye ahem hota hai. Rectangle pattern ek consolidation phase ko darust karta hai, jahan price ek horizontal range mein trade karta hai. Is pattern ko sahi tareeke se samajh kar aur istemal karke traders mukammal kamiyabi tak pohanch sakte hain. Chaliye rectangle patterns trading strategy ke baray mein mazeed tafseelat se guftagu karte hain:
                Click image for larger version

Name:	forex-rectangle-top-pattern.png
Views:	30
Size:	10.8 کلوبائٹ
ID:	12834186
                Rectangle Pattern Kya Hai? Rectangle pattern ek technical analysis tool hai jo market mein price consolidation ko darust karta hai. Is pattern mein price ek horizontal range mein trade karti hai jise support aur resistance levels define karte hain. Rectangle pattern ek rectangle ya square ke jaise dikhta hai jahan price horizontal lines ke darmiyan move karta hai.

                Rectangle Pattern ka Tafsili Mizaaj: Rectangle pattern market mein consolidation phase ko darust karta hai, jahan buyers aur sellers ki taqat barabar hoti hai aur price ek horizontal range mein trade karta hai. Jab price ek resistance level se gir kar support level tak aur phir se upar jaata hai, ya phir support level se upar ja kar resistance level tak move karta hai, toh yeh rectangle pattern ban jata hai.

                Rectangle Pattern ka Istemal: Rectangle pattern ko samajh kar aur istemal karne ke liye traders ko kuch key steps follow karne chahiye:
                1. Pattern ko Identify karein: Rectangle pattern ko identify karne ke liye traders ko price chart par horizontal support aur resistance levels ko dekhna hota hai jahan price ek range mein trade kar rahi hoti hai.
                2. Entry aur Exit Points Tay Karein: Rectangle pattern ke breakout aur breakdown points par entry aur exit points tay kiye jate hain. Breakout ke doran entry point breakout ke upper side aur stop loss breakout ke lower side rakha jata hai, aur breakdown ke doran entry point breakdown ke lower side aur stop loss breakout ke upper side rakha jata hai.
                3. Volume aur Confirmation: Rectangle pattern ke breakout ya breakdown ko confirm karne ke liye traders volume analysis ka istemal karte hain. Agar breakout ya breakdown high volume ke saath hota hai, toh yeh pattern ka confirmation hota hai.

                Rectangle Pattern Trading Strategy ke Faide:
                • Rectangle pattern trading strategy traders ko potential entry aur exit points provide karta hai.
                • Is strategy ka istemal karke traders price ke direction ka andaza lagate hain aur trading decisions lete hain.
                • Rectangle pattern ke breakout ya breakdown ke baad traders ko high probability trades karne ka mauqa milta hai.

                Rectangle pattern trading strategy traders ke liye mufeed ho sakti hai agar sahi tareeke se samjha jaye aur sahi risk management ke saath istemal kiya jaye. Is pattern ko samajhne aur trading strategy ko mukammal tajurba karne ke liye practice aur patience ki zaroorat hoti hai.

                • #9 Collapse

                  Rectangle Patterns Trading Strategy:
                  Rectangle patterns, jo ke technical analysis mein aam chart patterns hain, trading mein istemal kiye jane wale aham tools mein se ek hain. Ye patterns tab bante hain jab kisi aset ki keemat ek horizontal channel ke andar move karta hai, jo support level (neechay ka had) aur resistance level (ooper ka had) ke darmiyan hota hai. Traders aksar rectangle patterns ka istemal potential trading opportunities ko pehchanne aur apne entry aur exit points ka faisla karne ke liye karte hain.


                  Yahan ek rectangle patterns par mabni trading strategy di gayi hai:
                  1. Rectangle Patterns Ki Pehchan:
                    • Rectangle patterns ko pehchanne ke liye price charts ko dekhen. Dhoondhein wo waqt jahan keemat aam tor par side mein move kar rahi ho aur barabar ke highs aur lows ko touch kar rahi ho, jo ek parallel support aur resistance line banata hai.
                  2. Pattern Ki Tasdeeq:
                    • Ek potential rectangle pattern ko pehchanne ke baad, isey tasdeeq karen ke price kam se kam do martaba support aur resistance lines ko touch kar chuka hai, trading range ke liye wazeh hadood bana kar.
                  3. Entry Points:
                    • Entry points ka faisla breakout strategy ke mutabiq karen. Intezar karen ke price rectangle pattern se bahar nikal jaye, ya to resistance level (bullish breakout) ya support level (bearish breakout) ke ooper ya neeche.
                  4. Breakout Ki Tasdeeq:
                    • Breakout ki tasdeeq ke liye dekhen ke breakout ke sath trading volume mein izafa ho raha hai. Zyada volume breakout ki darustgi ko tasdeeq karta hai aur mazboot market shirakat ko darust karta hai.
                  .

                  1. Stop-Loss Rakhna:
                    • Risk ko durust taur par manage karne ke liye stop-loss orders lagayen. Bullish breakout ke liye, support level ke neeche stop-loss rakhen, aur bearish breakout ke liye, resistance level ke ooper.
                  2. Profit Targets:
                    • Profit targets ko rectangle pattern ki lambaai ke mutabiq tay karen. Support aur resistance levels ke darmiyan faasla napen, aur is measurement ko apne profit target ke liye istemal karen. Kuch traders ek 1:1 risk-reward nisbat istemal karte hain, jabke doosre zyada multiples ki taraf jate hain.
                  3. Risk Management:
                    • Har trade ke liye apne hisaab se proper risk management karen. Har ek trade par apne account balance ke muqabil mein chhote hisse ko risk karne se bachen. Kisi bhi ek trade par zyada risk lene se bachen.
                  4. Trade Execution:
                    • Entry, stop-loss, aur profit target levels ke sath apne pehle se tay kiye gaye plan ke mutabiq apne trades ko execute karen. Disciplined rahein aur emosional faislon se bachain.
                  5. Trade Ki Nigraani:
                    • Trade ke andar entry ke baad use nigrani mein rakhen. Market ke halat ya naye price developments ke mutabiq apne stop-loss aur take-profit levels ko zaroor adjust karen.
                  6. Review aur Seekhna:
                    • Trade ko band karne ke baad, apni performance ka jaeza len aur rectangle pattern trading strategy ki kargarigi ka jayeza len. Apne anjamit aur anjaamit trades se seekhen aur apne approach ko behtar banane ke liye istemal karen.Yad rakhein ke koi bhi trading strategy ka guarantee nahi hota, aur rectangle patterns jhootay breakouts ya market ke ulte palatne se mukhtalif ho sakte hain. Isliye, rectangle pattern analysis ko doosre technical indicators aur fundamental analysis ke sath jorna zaroori hai. Iske ilawa, behtar result hasil karne ke liye proper risk management aur trade discipline ko follow karna zaroori hai


                  • #10 Collapse

                    Rectangle Patterns Trading Strategy Guide.

                    Rectangle patterns are a type of technical analysis pattern in forex trading. They are also known as trading ranges or consolidation patterns. They occur when the price of a financial instrument moves within two parallel lines or trendlines for a prolonged period, forming a rectangle shape.

                    Here's a guide on how to trade rectangle patterns.


                    1.Identify the Rectangle Pattern.

                    To trade a rectangle pattern you first need to identify one. Look for parallel support and resistance lines that form a rectangle shape on the price chart.

                    2.Confirm the Rectangle Pattern.

                    Once you've identified the rectangle pattern, it's crucial to confirm it. You can do this by looking for at least two distinct price touches on both the support and resistance lines.

                    3.Determine the Breakout Direction.

                    The next step is to determine the direction of the breakout. A breakout can occur either to the upside (bullish breakout) or downside (bearish breakout). Keep an eye on volume during the breakout, as a surge in volume often confirms the validity of the breakout.


                    4.Set Entry and Exit Points.

                    If you believe the breakout is valid, you can set entry and exit points. Some traders wait for the price to close above or below the rectangle pattern before entering a trade. Others may enter as soon as the breakout happens, provided they have a stop-loss in place.

                    5.Set Stop-Loss and Take-Profit Levels.

                    It's essential to set stop-loss and take-profit levels to manage risk and potential gains. For example, if you're trading a bullish rectangle pattern, you might set your stop-loss just below the support line and your take-profit just below the next significant resistance level.

                    6.Monitor the Trade.

                    Once you're in the trade monitor it closely. Rectangle patterns can sometimes lead to false breakouts, so be prepared to exit the trade if the price moves against you.

                    7.Consider Other Indicators.

                    While rectangle patterns can be traded on their own it's often helpful to consider other technical indicators or chart patterns for confirmation. For example, you might look for bullish candlestick patterns or use momentum indicators like the Relative Strength Index (RSI) to confirm a bullish breakout.


                    Click image for larger version

Name:	images (5).png
Views:	24
Size:	31.7 کلوبائٹ
ID:	12834231

                    Rectangle patterns ke Wazahat.


                    Rectangle patterns aik technical analysis pattern hain jo market mein trading range ya consolidation ki nashunuma hoti hai. Ye tab banta hai jab market ka price kisi particular price level par kuch time ke liye stable ho jata hai aur phir usay do parallel lines ya trendlines ke darmiyan samjha jata hai. Ye parallel lines price ke upper aur lower level ko represent karte hain.


                    important points.


                    1.Volume.

                    Breakout ko confirm karne ke liye volume bhi dekha jata hai. Agar breakout volume ke sath hota hai to ye ek strong breakout hota hai.

                    2.Trading Strategies.

                    Rectangle pattern ke liye different trading strategies use ki ja sakti hain jaise ke rectangle breakout trading strategy, rectangle reversal trading strategy, ya phir rectangle continuation trading strategy.


                    3.Period of Stability.

                    Rectangle pattern tab banta hai jab market ka price kisi level par kuch time ke liye stable ho jata hai. Is period mein price movement minimum hoti hai.


                    Rectangle patterns ke Example.

                    This is just one example of how to trade a rectangle pattern using a breakout strategy. There are many other ways to trade rectangle patterns, so it's essential to do your research and find a strategy that works for you.


                    Click image for larger version

Name:	image_126935.png
Views:	27
Size:	26.9 کلوبائٹ
ID:	12834232


                    منسلک شدہ فائلیں
                    • <a href="https://www.instaforex.org/ru/?x=ruforum">InstaForex</a>
                    • #11 Collapse

                      Rectangle Patterns Trading Strategy Guide

                      Click image for larger version

Name:	download.jpeg
Views:	24
Size:	24.1 کلوبائٹ
ID:	12834267
                      Rectangle Patterns Trading Strategy Guide

                      Rectangle patterns ya musallas patterns forex trading mein aik ahem tool hote hain jo price action ka tajziya karne mein madadgar hotay hain. Ye patterns market mein consolidation ya range-bound movement ko darust karte hain.

                      Rectangle patterns ka tajziya karne ke liye, traders ye steps follow kar sakte hain:
                      1. Pattern Recognition (Musallas Ka Pehchan): Sab se pehle traders ko musallas pattern ko pehchan'na zaroori hai. Rectangle pattern typically ek sideways market movement ko indicate karta hai jahan price horizontal support aur resistance levels ke darmiyan move karta hai.
                      2. Entry Points (Dakhil Karne Ke Points): Jab musallas ka pehchan hojaye, traders ko entry point ka intikhab karna hota hai. Ye typically jab price resistance level ko chhoo kar neeche aata hai ya support level ko chhoo kar upar jaata hai, hota hai.
                      3. Stop Loss aur Target Levels (Nuqsaan ki Hadd aur Maqsad ke Levels): Har trade mein stop loss aur target levels ko tay karna zaroori hai. Stop loss, trader ko nuqsaan se bachata hai agar trade uske khilaaf jaaye aur target level, trader ko profit ki had tak le jaata hai.
                      4. Risk Management (Khatra Prabandhan): Har trade mein munasib risk management ka istemal karna zaroori hai. Aam tor par, traders apne account balance ka 1-2% se zyada risk nahi lete.
                      5. Confirmation (Tasdeeq): Musallas pattern ko tasdeeq karne ke liye, traders ko doosri technical indicators ka istemal bhi kar sakte hain jaise ke volume, moving averages, ya price action signals.
                      6. Trade Execution (Faisla Karne Ka Waqt): Jab sab tayyariyan mukammal hojaayein, traders ko trade execute karna chahiye, yaani apne positions kholna aur trade ko monitor karna shuru karna chahiye.

                      Rectangle patterns trading strategy ko samajhna aur istemal karna traders ko market mein consistency aur success hasil karne mein madad deta hai. Lekin yaad rahe, har trading strategy ke saath, discipline aur sabr ka hona zaroori hai.

                      اب آن لائن

                      Working...
                      X