Butterfly at trading chart

No announcement yet.
`
X
  • وقت
  • دکھائیں
Clear All
new posts
  • #1 Collapse

    Butterfly at trading chart
    Butterfly Trading Patterns,

    Butterfly trading pattern ek technical analysis ka tareeqa hai jisme traders market ke movements ko analyze karte hain aur price trends ko predict karne ka maqsad rakhte hain. Yeh ek complex pattern hai, lekin agar aap ise samajh jaate hain to isay istemal kar ke aap apni trading strategy ko behtar bana sakte hain.Butterfly pattern ek specific chart pattern hai jisme price ki movements ko represent karte hain.

    Click image for larger version

Name:	The-butterfly-pattern.png
Views:	75
Size:	93.4 کلوبائٹ
ID:	12833501

    Yeh pattern traders ko market ke reversals ko identify karne mein madad karta hai. Butterfly pattern ko aksar harmonic trading patterns mein shamil kiya jata hai.Butterfly trading pattern ek powerful tool hai jo traders ko market ke movements ko analyze karne mein madad karta hai. Iski complexity ke bawajood, agar aap ise theek se samajh lete hain to yeh aapki trading strategy ko behtar bana sakta hai. Haan, isay istemal karne se pehle thorough research aur practice zaroori hai taki aap isey sahi taur par samajh sakein aur apni trading ko success tak pahuncha sakein.

    Components of Butterfly Pattern,

    Butterfly pattern teen main components par mushtamil hota hai:
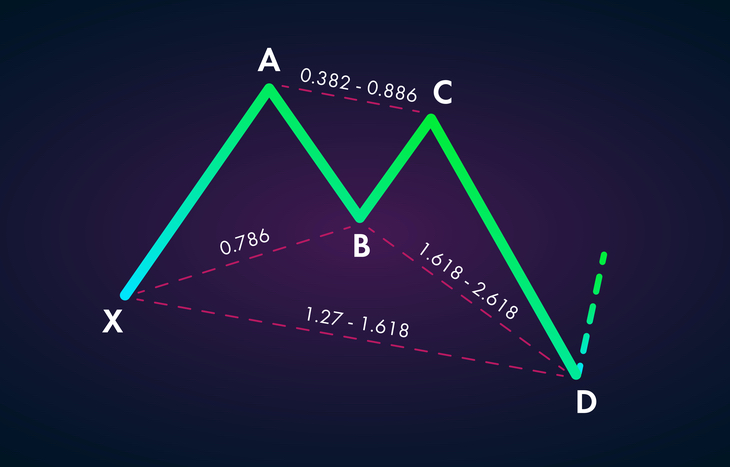
    X-A Leg:
    Yeh leg initial trend ko represent karta hai. Agar market upar ja raha hai, to X-A leg upar ki taraf hogi, aur agar market neeche ja raha hai, to X-A leg neeche ki taraf hogi.

    A-B Leg:

    A-B leg X-A leg ke opposite direction mein hota hai. Yani agar X-A leg upar hai, to A-B leg neeche hogi aur agar X-A leg neeche hai, to A-B leg upar hogi.

    Click image for larger version

Name:	Harmonic-Butterfly-Pattern-Target.png
Views:	44
Size:	91.1 کلوبائٹ
ID:	12833502

    B-C Leg:

    B-C leg market ke reversal ko indicate karta hai. Yeh leg A-B leg ke opposite direction mein hota hai.

    C-D Leg:

    C-D leg market ke direction ko confirm karta hai. Yeh leg B-C leg ke opposite direction mein hota hai.

    Butterfly Pattern Trading Strategy,

    Butterfly pattern ko samajhne ke baad, traders isay istemal kar ke apni trading strategy ko improve kar sakte hain. Kuch key points hain jo traders ko madadgar sabit ho sakte hain:

    Confirmation,

    Butterfly pattern ke istemal se pehle, aapko confirm karna hoga ke market actual mein pattern ke mutabiq ja raha hai ya nahi. Iske liye, aapko technical indicators ka istemal kar ke price movements ko verify karna hoga.

    Risk Management With Time Frame,

    Har trading strategy mein risk management ka khaas khayal rakhna zaroori hai. Butterfly pattern ko istemal karte waqt, aapko apne stop-loss aur take-profit levels ko tay karna hoga taake aap apne nuksan ko control mein rakh sakein.Butterfly pattern ko alag-alag time frames par apply kiya ja sakta hai. Aapko apni trading goals ke mutabiq time frame choose karna chahiye.

    Benefits of Butterfly Pattern,
    • Butterfly pattern traders ko market ke reversals ko identify karne mein madad karta hai, jisse unhe profitable trading opportunities mil sakti hain.
    • Is pattern ke istemal se traders apne trades ke liye achi risk-reward ratio maintain kar sakte hain, jo unke liye beneficial hota hai.
    Click image for larger version

Name:	13_butterfly.jpg
Views:	49
Size:	135.0 کلوبائٹ
ID:	12833503

    Disadvantages,
    • Butterfly pattern ek complex pattern hai, isay samajhna aur istemal karna beginners ke liye mushkil ho sakta hai.
    • Jaise har trading strategy mein hota hai, butterfly pattern bhi false signals generate kar sakta hai. Isliye, confirmatory indicators ka istemal karna zaroori hai.
  • <a href="https://www.instaforex.org/ru/?x=ruforum">InstaForex</a>
  • #2 Collapse

    Butterfly at trading chart


    Click image for larger version

Name:	download (60).jpeg
Views:	89
Size:	11.9 کلوبائٹ
ID:	12833532

    Trading charts are like a canvas where the movements of financial assets are painted, portraying the ebb and flow of the market. Among the various patterns that emerge on these charts, one of the most intriguing is the butterfly pattern. This pattern, with its symmetrical yet complex structure, often captures the attention of traders and analysts alike.

    Butterfly pattern ka chart par nazar aana, trading mein aik ahem phenomenon hai jo ke traders ki tawajju ko attract karta hai. Yeh pattern apni symmetrical aur mushkil structure ke sath aata hai, jo ke traders aur analysts ki tawajju ko bar bar apni taraf mabzool karta hai.

    Butterfly pattern ko samajhne ke liye, pehle trading charts ki bunyadi terminology ko samajhna zaroori hai. Chart par mukhtalif patton ki pehchan karna aur unke movements ko interpret karna, traders ke liye asaan nahi hota. Lekin jab ek trader butterfly pattern ko samajh leta hai, toh usay market ke mazeed deep understanding mil jati hai.

    Butterfly pattern ka naam is liye hai kyunki jab yeh chart par ban jata hai, toh woh aik butterfly ki tarah dikhta hai. Is pattern mein, market mein aik sharp move hota hai, phir usay follow karte hue doosra move hota hai jo pehle wale move ki opposite direction mein hota hai, aur phir aakhir mein ek mazeed move hota hai jo pehle wale move ke direction mein hota hai, lekin thora sa kam intensity ke sath. Is tarah ke movements se chart par aik aik achi shakal ban jati hai jo ke butterfly ki tarah hoti hai.

    Butterfly pattern ko detect karna aur samajhna traders ke liye zaroori hai taake woh market mein aane wale mukhtalif situations ka behtar andaza laga sakein. Jab yeh pattern market mein dikhai deta hai, toh traders isay apne trading strategies mein shamil karte hain aur is ke mutabiq apne positions ko adjust karte hain.

    Is pattern ki understanding se traders ko aik roadmap mil jata hai ke market ka agla move kis direction mein ja sakta hai aur kis tarah ka impact ho sakta hai. Is tarah ke patterns ki pehchan kar ke traders apni trades ko refine karte hain aur market ke mukhtalif scenarios ka behtar andaza lagate hain.

    Butterfly pattern ke sath sath, traders ko technical analysis ki doosri concepts ki bhi samajh honi chahiye. Candlestick patterns, support aur resistance levels, aur trend lines jaise tools traders ko market ka better understanding dete hain. Jab yeh sab concepts mil kar aik saath istemal kiye jate hain, toh traders ko market ke movements ko samajhne mein asani hoti hai aur woh apne trades ko sahi samay par execute kar sakte hain.

    Butterfly pattern ka istemal kar ke traders apni trades ko manage karte hain aur risk ko minimize karne ki koshish karte hain. Is pattern ki madad se, traders market ke uncertainty ko control karne ki koshish karte hain aur apni trading performance ko improve karne ki raah mein agey barhte hain.

    In conclusion, butterfly pattern chart par ek ahem phenomenon hai jo ke traders ke liye ahem hai. Is pattern ki samajh se, traders market ke movements ko samajhne mein asani mehsoos karte hain aur apni trades ko refine karte hain. Butterfly pattern ke sath sath, traders ko technical analysis ki doosri concepts ki bhi samajh honi chahiye taake woh market ko aur behtar tareeqay se samajh sakein aur apni trading performance ko improve kar sakein.


    • #3 Collapse

      How to Butterfly candlestick chart pattern,

      Butterfly candlestick pattern Forex trading mein ek relatively uncommon pattern hai. Yeh typically ek bullish reversal pattern hota hai, jo downtrend ke end par appear hota hai. Butterfly pattern mein, ek candle ke do chhote aur do bade shadows hote hain, jo ki ek butterfly jaisa shape create karte hain. Yeh pattern reversal ki indication provide karta hai, lekin iski confirmation ke liye, traders ko aur technical analysis ka istemal karna hota hai.

      What is butterfly chart pattern,

      Butterfly chart ek technical analysis chart hai jo market trends aur price movements ko visualize karne ke liye istemal hota hai. Ye chart ek symmetry pattern ko represent karta hai jisme price swings aur reversals ko dekhne mein madad karta hai. Butterfly chart mein, price movements ko ek specific pattern mein arrange kiya jata hai jo market sentiment ko samajhne mein madad karta hai. Ye chart traders ko market direction aur possible reversals ke bare mein insights deta hai, lekin iski analysis ke liye additional technical indicators aur tools ki zaroorat hoti hai.

      Wazahat,

      Butterfly chart mein, price movements ko ek specific pattern mein arrange kiya jata hai jo market sentiment ko samajhne mein madad karta hai. Is chart mein, typically ek central point se shuru hota hai aur phir price movement ko ek butterfly jaisi shape mein represent kiya jata hai. Yeh pattern symmetric hota hai aur price swings ko highlight karta hai. Traders is chart ko istemal karke market trends ko samajhte hain aur possible reversals ko anticipate karte hain. Is chart ki analysis ke liye, traders additional technical indicators aur tools ka istemal karte hain jaise ki Fibonacci retracements, moving averages, aur oscillators. Overall, butterfly chart price movements ko visually organize karta hai aur traders ko market ka direction samajhne mein madad karta hai.

      Use of Butterfly chart pattern,

      Butterfly chart ko istemal karne ke liye, traders typically price movements ko analyze karte hain aur market trends ke patterns ko identify karne ki koshish karte hain. Yeh chart market sentiment ko samajhne aur possible reversals ko anticipate karne mein madad karta hai. Yahan kuch steps hain jo traders butterfly chart ka istemal karte hue follow karte hain,

      Click image for larger version

Name:	download.png
Views:	114
Size:	6.1 کلوبائٹ
ID:	12833541

      Pattern Recognition,

      Traders butterfly pattern ko identify karte hain jisme price movements ek butterfly jaise shape mein arrange hote hain, typically symmetrically.

      Confirmation,

      Butterfly pattern ki confirmation ke liye, traders aur technical indicators ka istemal karte hain jaise ki Fibonacci retracements, moving averages, aur oscillators. Yeh indicators price reversals aur trend changes ko confirm karne mein madad karte hain.

      Entry and Exit points,

      Butterfly chart ko analyze karke traders entry aur exit points identify karte hain. Yeh points unhe help karte hain positions enter aur exit karne mein.

      Risk management,

      Traders apne trades ko manage karne ke liye risk management techniques ka istemal karte hain, jisme stop-loss aur take-profit levels shamil hote hain.

      Continual Monitoring,

      Market conditions aur price movements ko regular basis par monitor karna important hai taaki traders up-to-date rahen aur apne trading strategies ko adjust kar sakein.

      Examples,

      Overall butterfly chart ka istemal karke traders market trends ko samajhte hain aur trading decisions lene ke liye information gather karte hain.


      • #4 Collapse

        How to Butterfly trading patterns.


        Butterfly pattern ek technical analysis ka term hai jo market trends aur patterns ko samjhne ke liye istemal hota hai. Butterfly pattern trading chart pe dekhne mein Butterfly ki shape ki hoti hai aur ye market ke reversal ko indicate karta hai. Butterfly pattern aik specific tarah ka "harmonic pattern" hai jo market ke trend ya trend reversal ko identify karne ke liye use hota hai.
        Butterfly pattern chart pe 4 points se milta hai aur ye points Fibonacci retracement levels aur Fibonacci extension levels ke sath milte hain. Ye points ABCD ke naam se jaane jaate hain.

        Points A.

        Initial trend ka start hota hai.

        Points B.

        Market trend ka pehla correction ya pullback hota hai.

        Points C.

        Market trend ka doosra correction ya pullback hota hai.

        Points D.

        Market ke pattern ka completion hota hai.


        Click image for larger version  Name:	images (2).jpeg Views:	0 Size:	34.4 KB ID:	12833604

        Butterfly Pattern Market.

        Butterfly pattern market ke trend ya trend reversal ko indicate karta hai, lekin yeh accurate nahi hota aur iska istemal risk ke sath hota hai. Isliye, Butterfly pattern ko samajhne aur trade karna ke liye traders ko proper training aur experience ki zarurat hoti hai.

        Butterfly pattern trading chart.


        Butterfly pattern trading chart pe dekha ja sakta hai aur iska shape butterfly ki tarah hota hai, jis mein 4 points hote hain: A, B, C, aur D. In points ko Fibonacci retracement aur extension levels ke sath mila kar identify kiya jata hai. Ye points market ke trend aur trend reversal ko samajhne ke liye use hota hai.

        Butterfly pattern trading chart pe market ke trend ya trend reversal ko identify karne ke liye use hota hai. Ye pattern market ke trend ya trend reversal ko indicate karta hai. Isliye, traders ko Butterfly pattern ko samajhne aur trade karne ke liye proper training aur experience ki zarurat hoti hai.


        Use Of Butterfly chart pattern.

        Butterfly pattern ko trade karne ke liye traders ko pehle market mein trend ko samajhna hota hai. Trend ke opposite mein Butterfly pattern hota hai, isliye traders ko market ka trend identify karna zaroori hota hai.

        Butterfly pattern ke points (A, B, C, D) ko identify karne ke liye traders ko Fibonacci retracement aur extension levels ka istemal karna padta hai. In points ko identify karne ke baad, traders D point ke baad market ko direction change hone ka expectation rakhte hain aur us direction mein trade karte hain.

        Butterfly pattern ko samajhne aur trade karne ke liye traders ko proper technical analysis aur risk management ki zarurat hoti hai. Isliye, beginners ko Butterfly pattern ko samajhne ke liye training aur experience ka hona zaroori hota hai.

        Examples.

        Butterfly pattern market ke trend ya trend reversal ko indicate karta hai, lekin yeh accurate nahi hota aur iska istemal risk ke sath hota hai. Isliye, Butterfly pattern ko samajhne aur trade karna ke liye traders ko proper training aur experience ki zarurat hoti hai.


        Click image for larger version  Name:	images.jpeg Views:	0 Size:	33.7 KB ID:	12833605


        منسلک شدہ فائلیں
        • #5 Collapse


          Butterfly at trading chart?

          In the dynamic world of technical analysis, traders often turn to various chart patterns to decipher market movements and identify potential opportunities. One intriguing and visually distinctive pattern is the Butterfly Pattern. In this article, we'll explore the characteristics of the Butterfly Pattern, its significance, and how traders can leverage it as part of their trading strategy.

          Understanding the Butterfly Pattern:

          The Butterfly Pattern is a harmonic trading pattern that combines Fibonacci ratios and price action to identify potential reversal points in the market. Named for its butterfly-like appearance on the price chart, this pattern consists of four distinct legs. Let's break down the key components of the Butterfly Pattern:

          1. X to A Leg:
            • The pattern starts with a strong price move known as the X to A leg.
            • This leg represents the initial impulse move in the market, often forming the basis for subsequent price action.
          2. A to B Leg:
            • Following the X to A leg, the market experiences a corrective move known as the A to B leg.
            • This leg typically retraces a portion of the X to A leg, creating the first retracement in the pattern.
          3. B to C Leg:
            • The B to C leg is another impulse move, often exceeding the initial X to A leg.
            • This leg establishes a higher high, suggesting a continuation of the bullish momentum.
          4. C to D Leg:
            • The final leg, C to D, is a corrective move that retraces a significant portion of the B to C leg.
            • The D point is the potential reversal point, and the completion of this leg is critical for confirming the Butterfly Pattern.

          Significance of the Butterfly Pattern:

          The Butterfly Pattern is significant for traders due to several key reasons:
          1. Fibonacci Ratios:
            • The pattern relies on Fibonacci ratios, specifically the 0.786 and 1.272 ratios, to identify potential reversal points.
            • These ratios help traders pinpoint areas where price may reverse based on natural market retracements.
          2. Symmetry and Proportion:
            • The Butterfly Pattern emphasizes symmetry and proportion in price movements, providing a visually distinct structure that traders can recognize on a chart.
          3. Potential Reversal Zone (PRZ):
            • The completion of the D point marks the Potential Reversal Zone (PRZ), where traders anticipate a reversal in the prevailing trend.

          Trading Strategies:
          1. Confirmation with Other Indicators:
            • Traders often use the Butterfly Pattern in conjunction with other technical indicators, such as trendlines, support and resistance levels, or oscillators, to reinforce their analysis.
          2. Risk Management:
            • Effective risk management is crucial when trading based on patterns. Traders can implement stop-loss orders and define clear entry and exit points to manage potential risks associated with trend reversals.

          Conclusion:

          The Butterfly Pattern offers traders a unique and systematic approach to identifying potential reversal points in the market. As with any technical analysis tool, it's essential to approach the Butterfly Pattern with a comprehensive analysis, considering various factors and confirming signals through additional indicators. By understanding the characteristics and significance of the Butterfly Pattern, traders can enhance their decision-making process and navigate the complexities of financial markets more effectively
          • #6 Collapse

            Butterfly at trading chart


            Click image for larger version

Name:	download (1).jfif
Views:	39
Size:	11.8 کلوبائٹ
ID:	12833695

            Butterfly pattern ek trading chart par dekha jane wala technical analysis tool hai. Ye pattern aam tor par trend reversals ko indicate karta hai. Butterfly pattern ya to bullish ya bearish reversal pattern ho sakta hai, market ke halat ke mutabiq.

            Butterfly pattern ko define karne ke liye, kuch ahem points hote hain:
            1. Ibtidaai Harkat: Pattern ek ibtidaai harkat ke saath shuru hota hai, jo ke trend ke mutabiq hota hai. Agar bullish butterfly hai, to ye harkat aksar price ko neeche le jaata hai, aur agar bearish hai, to ye harkat price ko upar le jaata hai.
            2. Retracement: Phir ek retracement aata hai, jisme price phir se ibtidaai harkat ki taraf shift hoti hai. Ye retracement Fibonacci ratio ke saath measure kiya jaata hai, jaise ke 0.382, 0.618, 0.786, etc.
            3. Extension Harkat: Retracement ke baad, ek extension harkat hoti hai jo ke ibtidaai harkat ke opposite direction mein jaati hai. Ye harkat bhi Fibonacci ratios se related hoti hai.
            4. Doosra Retracement: Extension harkat ke baad, ek aur retracement hota hai, jo ke extension harkat ke against hota hai. Ye bhi Fibonacci ratios ke saath measure kiya jaata hai.
            5. Mukammal Hona: Pattern mukammal hone par, price aam tor par ibtidaai harkat ke level tak pahunchti hai, jo ke Fibonacci ratios ke basis par measure kiya jaata hai.

            Butterfly pattern ek mushkil pattern hai aur ise pehchaan karke samajhna traders ke liye challenging ho sakta hai. Lekin, agar sahi tarah se istemal kiya jaaye, ye trend reversals ko pehchanne mein madadgar ho sakta hai.

            Is pattern ko confirm karne ke liye, traders aksar doosre technical indicators aur price action analysis ka istemal karte hain. Lekin, hamesha yaad rahe ke koi bhi technical analysis tool perfect nahi hota, aur isliye risk management ka dhyan rakhna zaroori hai.


            • #7 Collapse

              What is butterfly chart pattern.Butterfly trading pattern ek technical analysis ka, market ke butterfly pattern chart par ek ahem phenomenon hai jo ke traders ke liye ahem hai. Is pattern ki samajh se, traders market ke movements ko samajhne mein asani mehsoos karte hain aur apni trades ko refine karte hain. Butterfly pattern ke sath sath, traders ko technical analysis ki doosri concepts ki bhi samajh honi chahiye taake woh market ko aur behtar tareeqay se samajh sakein aur apni trading performance ko improve kar sakein. movements ko analyze karne mein madad karta hai. Iski complexity ke bawajood, agar aap ise theek se samajh lete hain to yeh aapki trading strategy ko behtar bana sakta hai. Haan, isay istemal karne se pehle thorough research aur practice zaroori hai taki aap isey sahi taur par samajh sakein aur apni trading ko success tak pahuncha sakein.Trading Strategy,trading strategy mein risk management ka khaas khayal rakhna zaroori hai. Butterfly pattern ko istemal karte waqt,Butterfly pattern ke istemal se pehle, aapko confirm karna hoga ke market actual mein pattern ke mutabiq ja raha hai ya nahi.pattern traders ko market ke reversals ko identify karne mein madad karta hai. Butterfly pattern ko aksar harmonic trading patterns mein shamil kiya jata hai.Butterfly trading pattern ek powerful tool hai jo traders ko market ke movements ko analyze karne mein madad karta hai. Iski complexity ke bawajood, agar aap ise theek se samajh lete hain Iske liye, aapko technical indicators ka istemal kar ke price movements ko verify karna hoga. aapko apne stop-loss aur take-profit levels ko tay karna hoga taake aap apne nuksan ko control mein rakh sakein.Butterfly pattern ko alag-alag time frames par apply kiya ja sakta hai. Aapko apni trading goals ke mutabiq time frame choose karna chahiye.Risk Management : pattern ka naam is liye hai kyunki jab yeh chart par ban jata hai, toh woh aik butterfly ki tarah dikhta hai. Is pattern mein, market mein aik sharp move hota hai, phir usay follow karte hue doosra move hota hai jo pehle wale move ki opposite direction mein hota hai, aur phir aakhir mein ek mazeed move hota hai jo pehle wale move keButterfly chart ko istemal karne ke liye, traders typically price movements ko analyze karte hain aur market trends ke patterns ko identify karne ki koshish karte hain. Yeh chart market sentiment ko samajhne aur possible reversals ko anticipate karne mein madad karta hai. Yahan kuch steps hain jo traders butterfly chart ka istemal karte hue follow karte hain, direction mein hota hai, lekin thora sa kam intensity ke sath. Is tarah ke movements se chart par aik aik achi shakal ban jati hai jo ke butterfly ki tarah hoti hai.
              • #8 Collapse

                Butterfly at Trading Chart

                Introduction

                Trading charts are visual representations of price movements in financial markets. Traders use various patterns and indicators to analyze these charts and make informed decisions. One such pattern is the butterfly pattern, which is a technical analysis tool used by traders to predict potential price reversals.The butterfly pattern is a popular technical analysis tool used by traders to identify potential trend reversals in the market. By understanding the components of the pattern and implementing appropriate trading strategies, traders can capitalize on price movements and improve their trading performance. However, like any trading strategy, it is important to combine the butterfly pattern with other indicators and risk management techniques for successful trading outcomes.

                Click image for larger version

Name:	images (6).jpeg
Views:	40
Size:	33.7 کلوبائٹ
ID:	12833721

                Butterfly Pattern

                Butterfly pattern is a harmonic pattern that consists of four distinct price swings. These swings are labeled as XA, AB, BC, and CD. The pattern resembles the wings of a butterfly, hence the name. It is considered a reversal pattern and is used by traders to identify potential turning points in the market.

                Components of Butterfly Pattern
                  • The XA leg represents the initial price movement in the pattern.
                  • It can be an upward or downward movement, depending on whether the pattern is bullish or bearish.
                Click image for larger version

Name:	images (7).jpeg
Views:	37
Size:	48.2 کلوبائٹ
ID:	12833722
                  • The AB leg is the first retracement from the XA leg.
                  • It usually retraces a portion of the XA leg, typically around 38.2% to 61.8% Fibonacci retracement level.
                  • The BC leg is the second leg of the pattern and is in the opposite direction of the AB leg.
                  • It typically retraces a portion of the AB leg, usually around 38.2% to 88.6% Fibonacci retracement level.
                  • The CD leg is the final leg of the pattern and completes the butterfly formation.
                  • It typically retraces a portion of the BC leg, usually around 127% to 161.8% Fibonacci extension level.

                Identification of Butterfly Pattern

                Traders identify the butterfly pattern by observing the price movements on a trading chart. They look for specific criteria, including the lengths and retracement levels of each leg, to confirm the presence of the pattern.

                Trading Strategy

                Once the butterfly pattern is identified, traders can implement various trading strategies. Some common strategies include.

                Click image for larger version

Name:	images (5).png
Views:	34
Size:	25.3 کلوبائٹ
ID:	12833723
                1. Entry Point:
                  • Traders look for potential entry points near the completion of the CD leg.
                  • This is typically where the price is expected to reverse and start a new trend.
                2. Stop Loss:
                  • Traders place a stop-loss order below the low of the pattern for bullish patterns and above the high of the pattern for bearish patterns.
                  • This helps limit potential losses if the price does not reverse as expected.
                3. Target Price:
                  • Traders set a target price based on Fibonacci extension levels or previous support and resistance levels.
                  • This helps them determine when to exit the trade and lock in profits.
                • #9 Collapse

                  What is Butterfly at trading chart in forex?

                  Answer:

                  Butterfly Pattern Kya Hai:


                  Butterfly Pattern ek technical analysis chart pattern hai jo forex trading mein dekha jata hai. Yeh pattern typically trend reversal ko indicate karta hai jab market mein specific price movements hote hain.

                  Kis Tarah Kaam Karta Hai:

                  1. Banawat:

                  Butterfly Pattern mein price action ek specific sequence follow karta hai. Is pattern mein typically ek initial move (leg) hota hai, phir ek retracement hota hai, uske baad ek strong move hota hai jo initial move se extend hota hai, aur phir ek final retracement hota hai.

                  2. Fibonacci Analysis:

                  Is pattern ke analysis mein Fibonacci retracement levels ka istemal hota hai. Butterfly Pattern ke legs Fibonacci ratios ke specific levels par end hote hain.

                  Tabeer aur Trading:

                  1. Trend Reversal Signal:

                  Butterfly Pattern ko dekh kar traders ko signal milta hai ke current trend khatam hone wala hai aur reversal hone ka potential hai. Is pattern ke completion ke baad, traders ko opposite direction mein positions lene ka mauka milta hai.

                  2. Entry Aur Exit Points:

                  Traders is pattern ke completion ke baad entry aur exit points tay karte hain. Jab price pattern ke specific levels ko break karta hai, toh yeh ek entry point ho sakta hai, jabke stop-loss aur take-profit levels bhi tay kiye ja sakte hain.

                  Click image for larger version

Name:	image_search_1708190354991.png
Views:	35
Size:	44.6 کلوبائٹ
ID:	12833728

                  Trading Strategy:

                  1. Confirmation Ki Zarurat:

                  Butterfly Pattern ke signals ko confirm karne ke liye, traders doosre technical indicators aur price action ka istemal karte hain. Confirmatory signals ke bina trading avoid kiya jana chahiye.

                  2. Risk Management:

                  Har trading strategy mein risk management ka ek crucial hissa hota hai. Butterfly Pattern ke signals ke saath, stop-loss aur take-profit levels tay karna zaroori hai.

                  Nateeja:

                  Butterfly Pattern, forex traders ke liye ek powerful tool hai trend reversals ko anticipate karne mein. Lekin, hamesha market context aur doosre confirmatory indicators ko bhi tajziya karna zaroori hai trading decisions ke liye.
                  • #10 Collapse


                    Butterfly at trading chart

                    Butterfly Pattern:

                    Butterfly pattern ek popular technical analysis tool hai jo trading charts par paya jata hai. Yeh pattern market trends ko predict karne aur price movements ke future possibilities ko identify karne mein madad karta hai. Butterfly pattern ek reversal pattern hai, yaani ki yeh indicate karta hai ki market trend reverse hone wala hai.

                    Click image for larger version

Name:	R2.jpg
Views:	26
Size:	13.8 کلوبائٹ
ID:	12834285


                    Butterfly Pattern Components:

                    Butterfly pattern mein kuch specific points hote hain jo traders ko pattern ko identify karne mein madad karte hain:
                    1. X-Axis: Yeh start point hota hai jahan se pattern shuru hota hai.
                    2. A-B Leg: X-Axis se A point tak ka movement hota hai, jo ki initial trend ke against hota hai.
                    3. B-C Leg: A se B tak ka movement hota hai, jo ki initial trend ke sath ho sakta hai lekin usually A-B leg ke 0.786 Fibonacci retracement level tak jaata hai.
                    4. C-D Leg: B se C tak ka movement hota hai, jo ki B-C leg ke 0.786 Fibonacci extension level tak jaata hai. Yeh leg pattern ka final leg hota hai aur isse pattern complete hota hai.

                    Butterfly Pattern Interpretation:

                    Butterfly pattern ko identify karne ke liye traders ko market charts par dhyaan dena hota hai. Jab market mein price movement X-Axis se A, A se B, aur B se C tak ke points ke beech mein hota hai, tab traders ko butterfly pattern ki sambhavna hoti hai.

                    Jab C point tak ka movement pura ho jata hai aur market price D point tak badhne lagta hai, tab traders ko yeh samajhna chahiye ki butterfly pattern complete hone ke kareeb hai. Is samay traders ko long positions lena ya existing short positions ko close karna ho sakta hai, kyunki yeh pattern trend reversal ko suggest karta hai.

                    Butterfly Pattern ke Benefits:
                    1. Trend Reversal Prediction: Butterfly pattern market trends ke reversal ko predict karne mein madad karta hai, jo traders ke liye valuable information ho sakti hai.
                    2. Entry aur Exit Points: Is pattern ki madad se traders achhe entry aur exit points ka faisla kar sakte hain, jisse unka trading performance behtar ho sakta hai.
                    3. Risk Management: Butterfly pattern ko samajh kar traders apne risk management strategies ko improve kar sakte hain, jisse unka overall risk kam ho sakta hai.

                    Conclusion:

                    Butterfly pattern ek powerful technical analysis tool hai jo traders ko market trends ke reversal ko predict karne mein madad karta hai. Is pattern ka istemal karke traders achhe entry aur exit points ka faisla kar sakte hain, jisse unka trading performance behtar ho sakta hai. Yeh pattern aam taur par dusre technical indicators aur tools ke saath istemal kiya jata hai, jisse traders ko ek complete trading strategy banane mein madad milti hai.


                    • #11 Collapse

                      **Butterfly Pattern Trading Chart: Forex Market Mein Iski Pehchan Aur Strategy**
                      Forex trading mein technical analysis ka ek crucial element chart patterns hain, jo market trends aur price movements ko samajhne mein madad karte hain. Butterfly Pattern ek aisa pattern hai jo market ke trend reversal aur price action ko represent karta hai. Is post mein, hum Butterfly Pattern ki pehchan, formation aur trading strategy ko detail mein explore karenge.

                      **Butterfly Pattern Ki Pehchan**

                      1. **Pattern Ki Formation:**
                      - **Structure:** Butterfly Pattern ek harmonic pattern hai jo price action ke four key points—X, A, B, aur C—se mil kar banta hai. Yeh pattern X se B tak bullish aur B se C tak bearish moves ko include karta hai. Pattern ki completion D point par hoti hai, jo market ke reversal ka signal hota hai.
                      - **Appearance:** Pattern ke formation mein, B point X se higher hota hai, C point B se higher aur D point C se lower hota hai, jo ek distinct butterfly shape ko form karta hai.

                      2. **Key Characteristics:**
                      - **Retracement Levels:** Butterfly Pattern ke key retracement aur extension levels Fibonacci ratios pe base hote hain. Aapko in levels ko accurately identify karna zaroori hai, jaise XA (0.786), AB (1.618) aur BC (2.618).
                      - **Reversal Signal:** Pattern ki completion D point par hoti hai, jo market ke trend reversal ka indication hota hai.

                      **Trading Strategy Using Butterfly Pattern**

                      1. **Entry Points:**
                      - **Confirmation Candle:** Butterfly Pattern ke entry points ko confirm karne ke liye, D point ki confirmation candle ka observation zaroori hai. Agar D point ke aas-paas ek strong reversal candle form hoti hai, to yeh buy ya sell entry point consider kiya jata hai.
                      - **Buy Entry:** Agar Butterfly Pattern bullish reversal signal deti hai, to buy entry point D point ke close ke aas-paas consider kiya jata hai.
                      - **Sell Entry:** Agar pattern bearish reversal signal deti hai, to sell entry point D point ke close ke aas-paas consider kiya jata hai.

                      2. **Stop-Loss Aur Target Levels:**
                      - **Stop-Loss Placement:** Risk management ke liye, stop-loss ko pattern ke completion point ke thoda beyond place karna chahiye. Agar buy trade hai to stop-loss ko D point ke neeche aur sell trade hai to stop-loss ko D point ke upar place kiya jata hai.
                      - **Target Levels:** Target levels ko pattern ke size aur market conditions ke hisaab se set kiya jata hai. Pattern ki height ko measure karke aur isse D point se add ya subtract karke target levels calculate kiye ja sakte hain.

                      3. **Volume Analysis:**
                      - **Volume Confirmation:** Butterfly Pattern ke saath volume analysis bhi important hota hai. High trading volume pattern ke confirmation aur market ke momentum ko support karta hai.

                      4. **Market Context:**
                      - **Trend Context:** Butterfly Pattern ko market ke existing trend ke context mein analyze karna zaroori hai. Agar market strong trend mein hai, to pattern ke breakout ke chances ko assess karna chahiye.

                      **Butterfly Pattern Ke Benefits Aur Challenges**

                      **Benefits:**
                      - **Clear Reversal Signal:** Butterfly Pattern ek clear reversal signal provide karta hai jo trading decisions ko simplify karta hai.
                      - **Harmonic Patterns:** Pattern ke harmonic nature aur Fibonacci levels trading strategy ko more precise aur effective banaate hain.

                      **Challenges:**
                      - **Complexity:** Butterfly Pattern ka formation aur analysis complex ho sakta hai, jo inexperienced traders ke liye challenging ho sakta hai.
                      - **False Signals:** Pattern false signals generate kar sakta hai, jo trading losses ka sabab ban sakte hain.

                      **Conclusion**

                      Butterfly Pattern Forex trading mein ek valuable tool hai jo market ke trend reversal aur price action ko identify karne mein madad karta hai. Is pattern ke accurate trading signals aur risk management strategies ko samajhkar traders effective trading decisions le sakte hain aur profitable opportunities ko maximize kar sakte hain. Lekin, pattern ke complexity aur potential false signals ko bhi dhyan mein rakhna zaroori hai, taake trading decisions ko effectively manage kiya ja sake.
                      • #12 Collapse

                        Butterfly Pattern in Trading: A Comprehensive Guide

                        1. Introduction to Butterfly Pattern
                        Butterfly pattern ek harmonic chart pattern hai jo price reversal ko indicate karta hai. Ye pattern market ke trends ko samajhne mein madad karta hai aur traders ko entry aur exit points define karne mein help karta hai. Butterfly pattern kaafi reliable hota hai jab traders ko ek strong reversal signal chahiye hota hai, khaas tor pe long-term trends mein.

                        2. Structure of Butterfly Pattern
                        Butterfly pattern ek specific structure ka follow karta hai jo 4 points (X, A, B, C, D) par based hota hai. Is pattern mein point X se price movement shuru hota hai, aur phir price ek retracement se hoti hui point D tak pahuchti hai. Ye retracement aur extension market ki ek definite movement ko dikhata hai.

                        3. The Four Key Points
                        • X to A: Ye initial price movement hoti hai, jo strong ho sakti hai.
                        • A to B: Point A se B tak retracement hota hai, jo 78.6% Fibonacci level par ho sakta hai.
                        • B to C: Point B se C tak price movement continuation hoti hai aur ye 38.2% Fibonacci retracement level par hota hai.
                        • C to D: Is movement mein price D point par pahuchti hai, jo ek potential reversal point hota hai.

                        4. Identification of Butterfly Pattern
                        Butterfly pattern ko identify karte waqt, aapko chart par in 4 points ko accurately locate karna padta hai. Agar aapke paas price movements jo Fibonacci levels ko touch kar rahi hain, to aap sure ho sakte hain ke aap butterfly pattern dekh rahe hain. Ye pattern trend reversal ka signal deta hai, lekin isko confirm karne ke liye market ke other indicators ka bhi analysis karna zaroori hai.

                        5. Butterfly Pattern ka Use in Forex Trading
                        Forex trading mein butterfly pattern kaafi useful hota hai. Jab aap is pattern ko identify karte hain, to aap apne stop loss aur take profit levels ko accurately set kar sakte hain. Butterfly pattern ko major currency pairs jaise EUR/USD, GBP/USD aur USD/JPY par trade kiya ja sakta hai. Aap is pattern ka use intraday ya swing trading mein bhi kar sakte hain.

                        6. Entry and Exit Points
                        Butterfly pattern ko use karte waqt sabse important cheez entry aur exit points ko identify karna hota hai. Entry point usually point D ke aas paas hota hai, jab price reversal hota hai. Exit point ko identify karte waqt, aapko Fibonacci extension levels ka use karna hota hai. Aap take profit level ko 1.27 aur 1.618 Fibonacci extension levels par set kar sakte hain.

                        7. Risk Management in Butterfly Pattern Trading
                        Risk management har trade mein zaroori hota hai, khaas tor pe jab aap butterfly pattern trade kar rahe hote hain. Is pattern mein risk ko control karna thoda challenging ho sakta hai, isliye stop loss ko carefully set karna zaroori hai. Aap stop loss ko point B ya point C ke aas paas rakh sakte hain. Ye aapko unnecessary losses se bachata hai.

                        8. Common Mistakes in Trading Butterfly Pattern
                        Butterfly pattern ko samajhna thoda complex ho sakta hai, aur ismein kuch common mistakes hoti hain. Sabse pehli mistake hoti hai pattern ka incorrect identification. Agar aap points ko accurately mark nahi karte, to pattern fail ho sakta hai. Dusri mistake hoti hai risk management ka dhyan na rakhna, jo aapke losses ko increase kar sakta hai.

                        9. Advantages of Using Butterfly Pattern
                        Butterfly pattern ka use karne ka sabse bada faida ye hai ke yeh aapko trend reversal ke potential points dikhata hai. Agar aap is pattern ko achhe se samajh kar use karte hain, to aap apne trades ko higher probability ke sath execute kar sakte hain. Is pattern ke zariye aap apne entry aur exit points ko accurately time kar sakte hain, jisse aapko market ke fluctuations ka faida milta hai.

                        10. Conclusion
                        Butterfly pattern ek powerful tool hai jo forex traders ko market ke reversal points identify karne mein madad karta hai. Is pattern ko samajhna thoda challenging ho sakta hai, lekin jab aap isko accurately identify karte hain aur apne risk management strategies ko apply karte hain, to yeh aapke trading results ko improve kar sakta hai. Butterfly pattern ko combine karte waqt, aapko market ke baaki indicators ka bhi dhyan rakhna chahiye jisse aapko accurate results mil sakein.
                        • <a href="https://www.instaforex.org/ru/?x=ruforum">InstaForex</a>
                        • #13 Collapse

                          **Butterfly Pattern: Trading Chart Mein Trend Reversal Ka Powerful Indicator**
                          Stock market aur forex trading mein kai aise patterns hote hain jo price movements ko samajhne aur future trends ko predict karne mein madad karte hain. Un mein se ek ahem pattern hai **Butterfly Pattern**, jo ek harmonic pattern hai aur aksar trend reversal ka signal deta hai. Butterfly pattern ko samajhna aur identify karna traders ke liye kaafi faida mand ho sakta hai, khas taur par jab wo market mein reversal points ko pehchan ne ki koshish kar rahe hote hain.

                          **Butterfly Pattern Ka Concept**

                          Butterfly pattern ek harmonic chart pattern hai, jisme price movement ek "butterfly" ke wings jaise dikhayi deti hai. Is pattern mein kuch specific price points hote hain jise hum **X, A, B, C**, aur **D** ke naam se jante hain. Yeh pattern aksar tab banta hai jab market ek strong trend ke baad consolidation phase mein chala jata hai, aur phir ek sharp reversal hota hai.

                          Is pattern mein generally do major swings hotay hain: ek swing XA (jo initial trend ko dikhata hai) aur dusra swing CD (jo reversal ko indicate karta hai). Butterfly pattern ko samajhne ka ek basic tareeqa yeh hai ke jab price ek certain range ke andar move karte hue specific Fibonacci levels ko touch karta hai, to yeh pattern complete hota hai.

                          **Butterfly Pattern Ki Pehchan**

                          Butterfly pattern ko identify karte waqt aapko chaar specific points dekhne padte hain:

                          1. **X to A:** Yeh initial price move hota hai, jisme market ek strong trend show karta hai.
                          2. **A to B:** Iske baad price retrace karta hai, jo normally 78.6% Fibonacci level tak hota hai.
                          3. **B to C:** Yeh price move, jo normally 38.2% Fibonacci level tak hota hai, ek corrective phase ko dikhata hai.
                          4. **C to D:** Yeh last move hota hai, jo generally 127.2% Fibonacci extension ke aas-paas hota hai aur trend reversal ko indicate karta hai.

                          Jab yeh four points align hote hain, tab butterfly pattern complete hota hai aur ek strong reversal ka signal milta hai.

                          **Pattern Ka Significance**

                          Butterfly pattern market mein ek powerful reversal ka signal hai. Agar yeh pattern ek uptrend ke baad banta hai aur CD leg complete hoti hai, to yeh bearish reversal ka indication deta hai. Agar yeh downtrend ke baad banta hai, to yeh bullish reversal ka signal hota hai. Is pattern ko samajhna traders ke liye zaroori hai, kyunki yeh ek aise point ko indicate karta hai jahan market ka trend change ho sakta hai.

                          **Trade Kaise Karein?**

                          Butterfly pattern ko trade karte waqt, aapko price action aur Fibonacci levels ko closely monitor karna padta hai. Jab price C se D ke level tak pohanchta hai, to yeh ek potential reversal zone hota hai. Agar price is level par reverse hota hai, to aap apni buy (agar bullish reversal ho) ya sell (agar bearish reversal ho) position le sakte hain. Aap stop loss ko D point ke thoda upar ya neeche set kar sakte hain taake aapka risk controlled rahe.

                          **Conclusion**

                          Butterfly pattern ek powerful harmonic chart pattern hai jo market mein trend reversal ka strong signal deta hai. Is pattern ko samajhkar, aap apni trading strategy ko behtar bana sakte hain aur market ke reversal points ko accurately predict kar sakte hain. Agar aap is pattern ko sahi tarah se apply karte hain, to aap apne trades ko profitable bana sakte hain aur market ke changing trends se faida utha sakte hain.

                          اب آن لائن

                          Working...
                          X