Rounding Bottom Candlestick Pattern
X
  • وقت
  • دکھائیں
Clear All
new posts
  • #1 Collapse

    Rounding Bottom Candlestick Pattern
    Introduction,

    Rounding Bottom Candlestick Pattern, yaar, trading mein ek important candlestick pattern hai jo market mein trend reversal ko indicate karta hai. Is pattern ko dekh kar traders ko maloom hota hai ke market ka trend downward se upward shift hone wala hai. Chalo ab detail mein is pattern ke baare mein baat karte hain.Rounding Bottom Candlestick Pattern ek powerful tool hai trading mein jo market trends ko identify karne aur profitable trading opportunities ko capture karne mein madad karta hai. Lekin yaad rahe ke har pattern ki tarah, is pattern ki bhi apni limitations hain aur traders ko proper risk management aur analysis ke saath kaam karna chahiye.


    Click image for larger version

Name:	images (37).jpeg
Views:	37
Size:	56.2 کلوبائٹ
ID:	12828910

    What is Rounding Bottom Candlestick Pattern?

    Rounding Bottom Candlestick Pattern ek technical analysis ka pattern hai jo chart analysis mein istemal hota hai. Ye pattern tab form hota hai jab ek security ya asset ke price mein gradual decline hota hai phir ek specific samay ke baad price stable ho jata hai aur phir gradual increase shuru ho jata hai. Is pattern ko dekh kar traders ko lagta hai ke market ka trend downward se upward change hone wala hai.

    How to Identify Rounding Bottom Pattern?

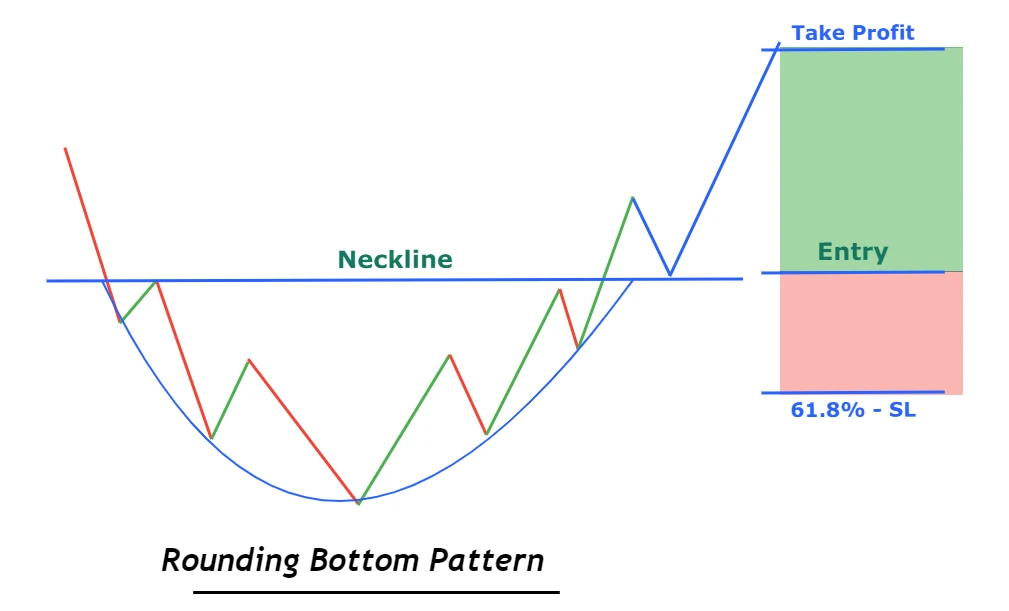
    Is pattern ko identify karne ke liye traders ko price chart pe dhyan dena hota hai. Rounding Bottom Pattern usually weeks ya months ke chart pe nazar aata hai. Is pattern ko recognize karne ke liye, ek curved shape ki tarah downward trend followed by a period of stabilization aur phir ek curved shape ki tarah upward trend dekhne ki zaroorat hoti hai.

    Click image for larger version

Name:	images (38).jpeg
Views:	29
Size:	30.7 کلوبائٹ
ID:	12828911

    Trading on Rounding Bottom Candlestick Pattern,

    Rounding Bottom Candlestick Pattern ke trading mein, traders ko ek few steps follow karne hote hain:


    Pehle step mein, traders ko Rounding Bottom Candlestick Pattern ko confirm karna hota hai. Iske liye, price chart pe pattern ki shape ko dhyan se dekhna hota hai aur confirm karna hota hai ke downward trend ke baad price stable hui hai aur phir upward trend shuru ho gaya hai.

    Dusre step mein, traders ko entry point ka selection karna hota hai. Jab Rounding Bottom Pattern confirm ho jata hai, traders ko entry point ko select karna hota hai. Entry point usually wo point hota hai jahan price ne pattern ki upper trend line ko break kiya hai.

    Teesre step mein, traders ko stop loss aur target levels ka setup karna hota hai. Stop loss level ko determine karne ke liye, traders usually pattern ki lower trend line ke neeche ek level set karte hain. Target level ko determine karne ke liye, traders usually pattern ki height ko measure karte hain aur phir us height ko entry point se upar extend karte hain.

    Click image for larger version

Name:	images (20).png
Views:	30
Size:	23.6 کلوبائٹ
ID:	12828912

    Choutha step mein, traders ko risk aur reward ka evaluation karna hota hai. Is step mein, traders ko apne entry point se stop loss level tak ka risk aur apne entry point se target level tak ka reward calculate karna hota hai. Agar risk aur reward ka ratio satisfactory hai, tab traders trade execute karte hain.

    Aakhir mein, traders trade ko execute karte hain jab pattern confirm ho jata hai aur entry point, stop loss aur target levels set ho jate hain. Trade execution ke baad, traders ko apne positions ko monitor karna hota hai aur stop loss aur target levels ko adjust karna hota hai agar zaroorat ho.
  • <a href="https://www.instaforex.org/ru/?x=ruforum">InstaForex</a>
  • #2 Collapse

    Rounding Bottom Candlestick Pattern
    Rounding Bottom Candlestick Pattern, jo ki ek chart pattern hai, market analysis mein dekha jata hai. Ye pattern typically downtrend ke baad dekha jata hai aur ek potential reversal ka indication deta hai.Yeh pattern ek rounded shape ka hota hai, jisme price initially downtrend mein hota hai, phir gradual transition hota hai aur price apne bottom ke close par stabilize ho jata hai. Is pattern ko identify karne ke liye traders ko price ke movements ko closely observe karna hota hai.

    Yeh kuch key characteristics hain Rounding Bottom Candlestick Pattern ke:
    1. Downtrend: Pattern ka formation typically ek downtrend ke baad hota hai, jab price continue down move karta hai aur ek bottom form karta hai.
    2. Gradual Transition: Rounding Bottom pattern mein price ka gradual transition hota hai downtrend se uptrend ki taraf. Price slowly aur steady tareeke se upar move karta hai, aur ek rounded shape ka pattern form karta hai.
    3. Volume: Volume bhi ek important factor hai Rounding Bottom pattern ki analysis mein. Jab price bottom formation ke around stabilize hota hai aur up move shuru karta hai, tab volume ka increase dekhne ko milta hai. Ye volume increase pattern ki validity ko confirm karta hai.
    4. Breakout: Rounding Bottom pattern ko confirm karne ke liye traders neckline ko observe karte hain. Jab price neckline ko break karta hai aur volume increase hota hai, tab ye ek bullish reversal ka indication hota hai.
    5. Entry aur Exit Points: Traders typically entry points tay karte hain jab price neckline ko upar break karta hai aur volume ka increase hota hai. Stop-loss orders ko set kiya jata hai neeche bottom ke niche, jabki profit targets ko set kiya jata hai based on key resistance levels ya previous swing highs.


    Conclusions
    Rounding Bottom Candlestick Pattern ko samajh kar, traders bullish reversal ka sign samajhte hain aur long positions lete hain. Magar hamesha yaad rakhiye ke kisi bhi single pattern ya indicator ki guarantee nahi hoti, aur har trade ko proper risk management ke saath lena chahiye.
    • #3 Collapse

      Rounding Bottom Pattern


      Technical analysis ek tajziyati tareeqa hai jis mein market ke past data ko analyze kar ke future ke trends ko predict kiya jata hai. Rounding bottom pattern bhi ek aise technical analysis ka hissa hai jo traders aur investors istemal karte hain. Yeh pattern market mein ek specific shape ko represent karta hai, jo future mein bullish trend indicate karta hai.

      Rounding Bottom Pattern Ki Pehchan:

      Rounding bottom pattern ko dekh kar traders ko market mein aane wale changes ka andaza lagaya ja sakta hai. Is pattern ko pehchanne ke liye, traders ko price charts par dhyan dena hota hai. Rounding bottom pattern typically ek U-shape ko resemble karta hai. Isme price initially downtrend mein hoti hai, phir gradual taur par recovery shuru hoti hai aur phir ek U-shape ki formation banti hai.

      neckline-in-rounding-bottom.webp

      Rounding Bottom Pattern Ki Components:


      1. Downtrend Phase:

      Rounding bottom pattern ki shuruaat ek downtrend phase se hoti hai. Is phase mein prices consistently down jaate hain, aur traders sentiment negative hota hai.


      2. Base Formation:

      Downtrend ke baad, prices mein ek stabilization phase aata hai jise base formation kehte hain. Is phase mein prices stabilize ho jaati hain aur ek base banati hai.


      3. Rounding:

      Base formation ke baad, prices mein gradual taur par increase hoti hai jo ek U-shape ki formation create karti hai. Yeh rounding kehte hain. Yeh gradual increase hone se traders ko confidence aata hai ke trend change hone wala hai.


      4. Breakout:

      Rounding ke completion ke baad, ek critical point hota hai jise breakout kehte hain. Jab prices base formation ke above move karte hain aur previous resistance level ko break karte hain, tab traders ko bullish trend ka signal milta hai.


      Rounding Bottom Pattern Ki Tafseelat:

      Rounding bottom pattern ki tafseelat par amal karne se pehle, traders ko kuch important points par dhyan dena chahiye:

      Volume Analysis:

      Rounding bottom pattern ke formation ke doran volume ka bhi analysis important hai. Agar volume round ke during increase hota hai, toh yeh pattern stronger hota hai aur future bullish movement ke liye confirmation provide karta hai.

      Confirmation Signals:

      Rounding bottom pattern ko confirm karne ke liye, traders ko breakout ka wait karna chahiye. Jab prices base formation ke above move karte hain aur previous resistance level ko break karte hain, tab traders ko buy signals milte hain.

      Risk Management:

      Har trading strategy ki tarah, rounding bottom pattern ki bhi apni risks hoti hain. Traders ko stop-loss orders ka istemal karna chahiye taake agar market opposite direction mein move kare, toh loss minimize kiya ja sake.


      Rounding Bottom Pattern Ka Istemal:

      Rounding bottom pattern ko istemal karne se pehle, traders ko apne trading goals aur risk tolerance ko samajhna zaroori hai. Is pattern ko istemal karne ke liye, traders ko price charts ko regularly monitor karna hota hai. Jab rounding bottom pattern detect hota hai, tab traders ko apni analysis aur confirmatory signals ka wait karna chahiye.
      Click image for larger version

Name:	Rounding-Bottom-03.png
Views:	30
Size:	25.3 کلوبائٹ
ID:	12828932
      Conclusion:

      Rounding bottom pattern ek powerful technical analysis tool hai jo traders ko bullish trends ko identify karne mein madad karta hai. Is pattern ko pehchan karne aur samajhne ke liye, traders ko market ke price charts ko carefully analyze karna hota hai. Phir, sahi confirmatory signals ke wait karke traders apne trading decisions ko lena seekhte hain. Magar yeh important hai ke har ek pattern ki tarah, rounding bottom pattern ki bhi limitations aur risks hote hain, isliye traders ko proper risk management ka istemal karna chahiye.


      • #4 Collapse


        Rounding Bottom candlestick pattern ek ahem chart formation hai jo traders dwara istemal kiya jata hai maali asmaaton mein potential trend reversals ka pehchan karne ke liye. Ye pattern ek gradual shift ko durust karta hai ek downtrend se uptrend ki taraf, jisme ek golakar shakal banti hai jo ek katoray ke neeche ke mawafiq hoti hai. Is article mein, hum Rounding Bottom pattern ke tafseelat par ghaur karenge, jaise ke iski pehchan aur iska maqam technical analysis mein.
        Rounding Bottom Pattern Kya Hai?


        Rounding Bottom, jise katora bottom bhi kehte hain, aik bullish reversal pattern hai jo aksar lambi downtrend ke baad banta hai. Is mein ek silsila candlesticks hota hai jo ahista ahista lower lows se higher lows ki taraf muntaqil hota hai, ek halki golakar shakal ko chat par banate hue. Ye pattern market sentiment mein barish se bullish ki taraf ahista ahista tabdeeli ko darust karta hai, trend ke rukh mein ek potential reversal ko durust karta hai.
        Rounding Bottom Pattern Ki Pehchan


        Gradual Decline:

        Rounding Bottom pattern ki pehchan ka pehla qadam price action mein lambi downtrend ka mojud hona hai. Traders lower lows ki ek silsila ko dekhte hain jo ke price movement mein stabilize hone ke baad hoti hai.

        Smooth Curve:

        Jab downtrend ka dabao kam hota hai, to price action chart ke neeche ek halki golakar shakal banata hai. Ye curve ek ahista ahista kharidari dabav ka ikatha karne ka natija hai aur trend mein ek potential reversal ko durust karta hai.

        Confirmation:

        Rounding Bottom pattern ka tasdeeq aksar bullish candlestick patterns ya doosray technical indicators ke zahoor se hasil kiya jata hai jo market sentiment mein tabdeeli ka darust karte hain. Traders bhatakne wale factors ke taur par trading volume mein izafa ki bhi dekhte hain.

        Rounding Bottom Pattern Ki Ahmiyat


        Trend Reversal: Rounding Bottom pattern ki bunyadi ahmiyat hai ke ye barish se bullish trend mein ek potential trend reversal ka ishara karta hai. Traders is pattern ke banne ko ek sign samajhte hain ke bechne ka dabao kam hota hai, aur khareedari ke interest ka aghaz ho raha hai.

        Entry Opportunities:

        Traders aksar Rounding Bottom pattern ke mukammal hone ko ek moqa samajhte hain lambay positions mein dakhil hone ke liye bullish rally ki umeed mein. Magar, ye zaroori hai ke trade shuru karne se pehle pattern ko tasdeeq karne ke liye intezar kiya jaye.

        Risk Management:
        Jaise har technical pattern, Rounding Bottom bhi foolproof nahi hai aur galat signals ka natija ho sakta hai. Traders ko nuksan ko kam karne ke liye sahi risk management techniques, jaise ke stop-loss orders lagana aur position sizes ka nigrani karna, ko istemal karna chahiye.
        Ikhtitam


        Rounding Bottom candlestick pattern traders ke liye aik ahem auzar hai jo maali asmaaton mein potential trend reversals ko pehchanne ki koshish karte hain. Iski pehchan aur ahmiyat ko samajh kar, traders apni trading decisions ko behtar bana sakte hain. Magar, ye zaroori hai ke hoshyaari se amal kiya jaye aur trading strategies ke liye sirf Rounding Bottom pattern par bharosa na kiya jaye

        • #5 Collapse

          Rounding bottom candlestick pattern


          Rounding Bottom, jo ke "saucer bottom" ya "rounding bottom reversal" ke naam se bhi jana jata hai, ek technical analysis pattern hai jo candlestick charts mein paya jata hai. Ye pattern market mein potential trend reversal ko darust karti hai. Rounding bottom ek bullish reversal pattern hai, jo downtrend ke baad aane wale trend reversal ko indicate karta hai. Is pattern mein price ka gradual aur smooth taur par increase hota hai.


          Rounding Bottom Pattern ki Kuch Key Characteristics:
          1. Shape:
            • Rounding Bottom pattern ka sab se prominent feature uski "U" shape hoti hai. Isme price gradual taur par down trend ke baad up move karta hai aur phir ek curve banata hai, jise "saucer" ya "rounding" kaha jata hai.
          2. Timeframe:
            • Ye pattern thore arsay mein banta hai, isliye isko spot karna thora mushkil ho sakta hai. Traders ko is pattern ko confirm karne ke liye doosre technical indicators ka bhi istemal karna chahiye.
          3. Volume:
            • Rounding Bottom pattern ke formation ke dauran, volume bhi dekha jata hai. Generally, jab price down trend mein hota hai, to volume zyada hota hai. Lekin jab rounding bottom form hota hai, toh volume kam ho jata hai, indicating ki selling pressure kam ho rahi hai.
          4. Breakout:
            • Rounding Bottom pattern ke complete hone ke baad, traders ek breakout ka wait karte hain. Agar price pattern ke upper part se bahar nikal jata hai aur ek bullish move shuru hota hai, toh ye pattern complete hota hai.
          5. Support and Resistance Levels:
            • Is pattern mein price ek potential support level ko touch karta hai aur phir uske upar move karta hai, isse ek strong reversal signal milta hai.


          Trading Strategy with Rounding Bottom:

          Traders is pattern ko dekhte hain jab price "U" shape banata hai aur volume kam hota hai. Agar ek breakout confirmation mil jata hai, toh traders long positions le sakte hain, expecting ke uptrend shuru hogi. Lekin hamesha yaad rakhein ki kisi bhi pattern ko confirm karne ke liye, doosre technical indicators aur risk management ka bhi istemal karna zaruri hai.

          Rounding Bottom pattern ek powerful reversal signal ho sakta hai, lekin market ke dynamic nature ko samajhna bhi ahem hai. Isliye, is pattern ke istemal ke doran cautious rehna aur confirmatory signals ka wait karna zaroori hai.
          • #6 Collapse

            Assalam.o.alakum umedd karta ho ap sab isme acha work kar rhay hongy or achi mhenat say is me kam kar rhay hongy aj ham market me inter hony par bat karty ha market hone wala hai. Chalo ab detail mein is pattern ke baare mein baat karte hain.Rounding Bottom Candlestick Pattern ek powerful tool hai trading mein jo market trends ko identify karne aur profitable trading opportunities ko capture karne mein madad karta hai. Lekin yaad rahe ke har pattern ki tarah, is pattern ki bhi apni limitations hain aur traders ko proper risk management aur analysis ke saath kaam karna chahiye.


            Click image for larger version  Name:	images (37).jpeg Views:	5 Size:	56.2 KB ID:	12828910
            Rounding Bottom Candlestick Pattern

            Rounding Bottom Candlestick Pattern ek technical analysis ka pattern hai jo chart analysis mein istemal hota hai. Ye pattern tab form hota hai jab ek security ya asset ke price mein gradual decline hota hai phir ek specific samay ke baad price stable ho jata hai aur phir gradual increase shuru ho jata hai. Is pattern ko dekh kar traders ko lagta hai ke market ka trend downward se upward change hone wala hai.
            me inter hony kalye hamy market ko smjhna chaiye agar hamy tread opan karny ka chansis hoty hay tu hamy markt me tread karna chaiye or market dhaik kar tread opan karni chaiye agar apko lagta hay market me tread opan nhi karni tu apko chaiye ap osme risk na lay wasy rizk to lana parta hay tread me lakin zara soch smjh kar hamy market me tread opan karni chaiye market me aynles ko dhaikna bhi zarori ha market me kam karny kalye hamko experinse ki bhi zarorat honi caiye agar hamary pass market me kam karny kalye knowledge hoga tu ham is say say achi kamiyabi hail kar sakty hay

            Rounding Bottom Candlestick Pattern ki identify

            Rounding Bottom Candlestick Pattern ke trading mein, traders ko ek few steps follow karne hote hain:
            Pehle step mein, traders ko Rounding Bottom Candlestick Pattern ko confirm karna hota hai. Iske liye, price chart pe pattern ki shape ko dhyan se dekhna hota hai aur confirm karna hota hai ke downward trend ke baad price stable hui hai aur phir upward trend
            Dusre step mein, traders ko entry point ka selection karna hota hai. Jab Rounding Bottom Pattern confirm ho jata hai, traders ko entry point ko select karna hota hai. Entry point usually wo point hota hai jahan price ne pattern ki upper trend line ko break kiya hai. kamiyab hony kalye ik mhenat karna bhi zarori hay agar hamary pass work karny kalye achi mhenat or acha knowlwdge hay tu ham baut acha work kar sakty hay
            Like tu banta hay ik🙏
            • #7 Collapse

              Rounding Bottom Candlestick Pattern

              Click image for larger version

Name:	RoundingBottom.gif
Views:	35
Size:	7.7 کلوبائٹ
ID:	12829145

              I. Introductions (Tasveer-e-Haal):

              Rounding Bottom candlestick pattern ek classical chart pattern hai jo market trends ko identify karne mein madad karta hai. Ye pattern typically ek reversal pattern hai jo downtrend ke baad form hota hai aur bullish trend ke signals provide karta hai.

              II. Tasveer-e-Haal:
              1. Tareeqa-e-Kaam:
                • Rounding Bottom pattern ek U-shaped pattern hota hai jo price ke movements ko represent karta hai.
                • Ye pattern typically downtrend ke baad form hota hai aur price ka gradual decrease hone ke baad ek round shape bana leta hai jise "bottom" kehte hain.
              2. Key Characteristics:
                • Gradual Decline: Pehle price gradual decline karta hai aur phir ek bottom banata hai.
                • Round Shape: Bottom banate waqt price ka movement ek round shape mein hota hai.
                • Stable Volume: Volume typically stable rehta hai ya decrease hota hai jab ye pattern form hota hai.

              III. Trading Strategies (Tajurbaati Tareeqe):
              1. Entry Points:
                • Traders typically entry points ke liye wait karte hain jab rounding bottom pattern confirm ho jata hai.
                • Entry point usually tab hota hai jab price ek resistance level ko break karta hai jo rounding bottom pattern ke sath form hota hai.
              2. Stop Loss Aur Take Profit Levels:
                • Stop loss levels ko tay karna zaroori hai just below the lowest point of the rounding bottom pattern.
                • Take profit levels ko determine karne ke liye traders pattern ki height ko measure karte hain aur phir use breakout point se add karte hain.

              IV. Risk aur Money Management (Khatra aur Maali Idara):
              1. Position Sizing:
                • Har trade ke liye sahi position size ka tay karna important hai, jisse ki loss ko control kiya ja sake aur capital ko protect kiya ja sake.
              2. Stop Loss Aur Take Profit Levels:
                • Har trade mein stop loss aur take profit levels ko tay karna zaroori hai, taake risk ko manage kiya ja sake aur profits ko lock kiya ja sake.

              V. Conclusion (Nateeja):

              Rounding Bottom candlestick pattern ek bullish reversal pattern hai jo traders ko potential trend reversals ke signals provide karta hai. Lekin, sahi risk management ke sath in patterns ka istemal karna zaroori hai taake trading success ko maximize kiya ja sake. Rounding Bottom pattern ko samajhne ke liye traders ko technical analysis aur price action ke concepts ko samajhna zaroori hai.
              • <a href="https://www.instaforex.org/ru/?x=ruforum">InstaForex</a>
              • #8 Collapse


                Rounding Bottom Candlestick Pattern:

                Technical analysis ka istemal karke traders market ke trends aur price movements ko predict karte hain. Rounding Bottom Candlestick Pattern (RB pattern) ek aham chart pattern hai jo traders ko bullish reversals ke signals provide karta hai. Is pattern ko samajhne se pehle, humein candlestick charts aur unke basic concepts ko samajhna zaroori hai.

                Candlestick charts mein, har candle ek specific time period ki trading activity ko represent karta hai. Har candle ke andar, price ki open, high, low, aur close values darj hoti hain. Rounding Bottom Candlestick Pattern ek bullish reversal pattern hai jo market ke bottom pe develop hota hai aur future uptrend ki possibilities ko indicate karta hai.

                Rounding Bottom Candlestick Pattern ko samajhne ke liye, kuch key points hain:
                1. Shape of the Pattern: RB pattern ka shape ek rounded bottom ya U-shaped pattern hota hai, jise chart pe dekhte hue traders ko identify karna hota hai. Is pattern mein price initially downtrend mein hoti hai, lekin phir gradual recovery dikhata hai, jisse ek rounded bottom shape ban jata hai.
                2. Volume Analysis: Pattern ko confirm karne ke liye, traders volume ki analysis bhi karte hain. Agar pattern ke saath volume bhi increase ho raha hai, to ye pattern ko aur bhi reliable banata hai.
                3. Confirmation: Ek important aspect ye hai ke traders ko pattern ko confirm karne ke liye wait karna chahiye. Agar price chart mein pattern develop ho raha hai, to traders ko price breakout ka wait karna chahiye jismein price pattern ke upper trend line ko break karta hai, indicating a potential bullish reversal.
                4. Price Target: RB pattern ko confirm karne ke baad, traders target price ko calculate kar sakte hain. Is target ko calculate karne ke liye, traders pattern ke depth ko measure karte hain aur use breakout point se add karte hain.

                Rounding Bottom Candlestick Pattern ka istemal karke, traders market mein bullish reversals ko anticipate kar sakte hain. Lekin, ek baat yaad rakhni chahiye ke chart patterns hamesha accurate nahin hote aur risk management ko hamesha yaad rakhna chahiye.

                To conclude, Rounding Bottom Candlestick Pattern ek bullish reversal pattern hai jo traders ko market ke trend changes ko identify karne mein madad karta hai. Is pattern ko samajhne aur istemal karne ke liye, traders ko candlestick charts ko analyze karna aur volume ke sath pattern ko confirm karna zaroori hai.

                اب آن لائن

                Working...
                X