Dragonfly Doji Candlestick Pattern
X
  • وقت
  • دکھائیں
Clear All
new posts
  • #16 Collapse

    "Dragonfly Doji Candlestick Pattern: Market Ke Raaz Ki Razdan"

    Introduction
    Forex aur stock market mein, candlestick patterns ka istemaal market ke mizaj aur future trends ko samajhne mein madad karta hai. Aik aham aur dilchasp candlestick pattern jo traders ke liye nayaab malumat farahem karta hai, woh hai "Dragonfly Doji." Yeh pattern ek aise chamakdar doji ko darust karta hai jo market mein mukhalif forces ke darmiyan barqarar mizaaj ko darust karti hai.

    Dragonfly Doji Ki Tafseelat
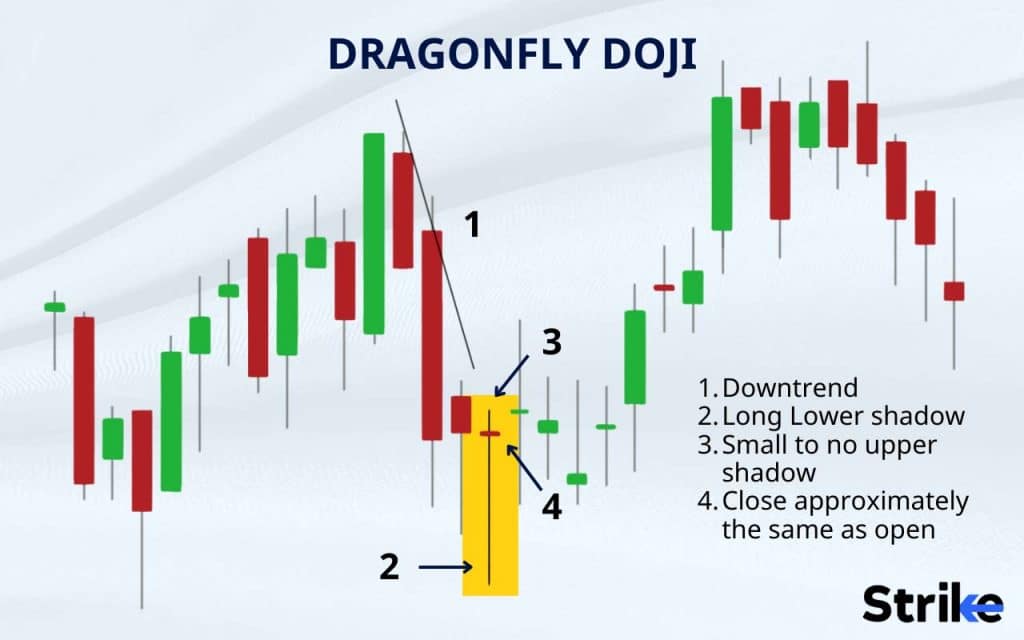
    Dragonfly Doji, aik bullish reversal candlestick pattern hai, jo market ke mood ko bearish se bullish mein tabdeel karne ki alamat hoti hai. Is pattern ka pehchaan karne ke liye, traders ko candlestick ka dhyaan dena hota hai jo ek lambi upper shadow ke saath ek lambi lower shadow ke saath milta hai aur opening price aur closing price aapas mein barabar hoti hain.

    Key Pechidaar Nishanat
    Lambi Upper Shadow Aur Lower Shadow
    Dragonfly Doji ka pehla pehlu yeh hai ke ismein ek lambi upper shadow aur ek lambi lower shadow hoti hai, jo ek saath milti hai. Yeh batata hai ke market mein sellers aur buyers mein barabar ka muqablah ho raha hai.

    Barabar Ka Opening Aur Closing
    Candlestick ka badan (body) ek lambi upper shadow ke baad barabar ke opening price aur closing price ke beech hota hai. Yeh darust karta hai ke market mein opening aur closing mein koi significant farq nahi hai.

    Bullish Reversal Signal
    Dragonfly Doji, bearish trend ke baad aata hai aur traders ko yeh batata hai ke sellers ne control khona shuru kar diya hai aur ab buyers ka daur shuru ho sakta hai.

    Dragonfly Doji Ka Istemaal Trading Mein

    Confirmation Ka Intezar
    Traders ko Dragonfly Doji pattern ka intezar karna chahiye aur confirm hone par hi is par amal karna chahiye. Confirmation ke liye, agla candlestick bhi bullish hona chahiye.

    Volume Ki Tasdeeq
    Pattern ki tasdeeq ke liye, traders ko volume analysis ka istemaal karna chahiye. Agar Dragonfly Doji ke baad volume mein izafah hota hai, toh yeh bullish reversal signal ko mazeed mazbooti deta hai.

    Stop-Loss Aur Take-Profit Levels
    Har trade ko madde nazar rakhte hue, traders ko stop-loss aur take-profit levels set karna chahiye. Yeh unhein nuksan se bachane aur munafa kamane mein madad karta hai.

    Conclusion
    Dragonfly Doji Candlestick Pattern, traders ko market ke mood ka pata lagane mein aik aham tool farahem karta hai. Is pattern ki samajh aur sahi tijarat ke tareeqay istemaal karke, investors apni trading strategies ko mazeed behtar bana sakte hain. Jaise ke Dragonfly Doji market mein taqat aur tawajju ki taraf ishara karta hai, waise hi traders is pattern ki madad se market ke samundar mein tairte hue apne maqsad tak pahunch sakte hain.

    • <a href="https://www.instaforex.org/ru/?x=ruforum">InstaForex</a>
    • #17 Collapse

      dragonfly doji candlestick pattern


      Click image for larger version

Name:	download - 2024-02-18T201113.592.jpg
Views:	28
Size:	10.9 کلوبائٹ
ID:	12834851

      Dragonfly Doji Candlestick Pattern:

      Dragonfly Doji Candlestick Pattern Kya Hai?

      Dragonfly Doji ek single candlestick pattern hai jo market mein dekha jata hai. Ye pattern typically reversal ya indecision ko indicate karta hai aur price action analysis mein istemal hota hai.

      Dragonfly Doji Ki Pechan:
      • Body Aur Shadows: Dragonfly Doji candlestick ka body buhat chhota hota hai, almost nonexistent, aur upper shadow bari lambi hoti hai jabke lower shadow nahi hoti hai.
      • Equal Open Aur Close Prices: Dragonfly Doji ka open price aur close price barabar ya buhat qareeb hota hai, iska matlab hai ke market ke during the trading session price movement kafi hadd tak aage ya peeche nahi gaya.
      • Reversal Ya Indecision Ko Darust Karta Hai: Dragonfly Doji candlestick pattern typically trend reversal ya market mein indecision ko darust karta hai. Agar ye pattern downtrend ke baad dekha jata hai, to ye bullish reversal ka indication hai aur agar uptrend ke baad dekha jata hai, to ye bearish reversal ka indication hai.

      Dragonfly Doji Candlestick Pattern Trading Strategy:
      1. Pattern Ko Identify Karein: Sab se pehle, traders ko Dragonfly Doji candlestick pattern ko identify karna hota hai. Ismein candlestick ka body buhat chhota hota hai aur upper shadow bari lambi hoti hai jabke lower shadow nahi hoti hai.
      2. Confirmation Ke Liye Aur Indicators Ka Istemal: Pattern ko confirm karne ke liye, traders aur analysts dusre technical indicators ka bhi istemal karte hain jaise ki RSI, MACD, ya volume indicators.
      3. Entry Point Ka Intekhab: Jab Dragonfly Doji pattern identify ho jata hai aur confirm ho jata hai, traders ko entry point ka intekhab karna hota hai. Ye typically candlestick ke high ya low ke above ya below entry kiya jata hai, depending on the direction of the expected reversal.
      4. Stop-Loss Aur Profit Target Ka Takhmina: Har trading strategy mein risk management ka tajziya karna zaroori hai. Traders ko apne entry point ke nazdeek stop-loss orders lagana chahiye taake nuqsaan ki surat mein apne positions ko protect kar sakein. Profit target ko previous support level ya resistance level par set kiya ja sakta hai.

      Mukhtasar Mehdoodiyat:
      • Dragonfly Doji ek single candlestick pattern hai jo typically reversal ya indecision ko indicate karta hai.
      • Traders ko pattern ko identify karne ke liye candlestick ka body aur shadows ka size ko dekhna chahiye aur entry, exit, aur stop-loss points tay karte waqt proper risk management ka khayal rakhna chahiye.
      • Hamesha yaad rakhein ke koi bhi single trading pattern ya strategy hamesha 100% accurate nahi hoti. Is liye, proper analysis aur risk management ka istemal karna zaroori hai.
      • #18 Collapse

        Dragonfly Doji Candlestick Pattern.

        Dragonfly Doji ek Japanese candlestick pattern hai jo traders ko price reversals ki indication deta hai. Ye pattern bullish reversal pattern hota hai, yani ke market ki downward trend ko indicate karta hai aur bullish trend ka indication deta hai. Ye pattern, doji ke form mein hota hai jahan open aur close prices barabar hoti hain ya phir barabar ke bohot qareeb hoti hain, aur woh price action ek vertical line ke form mein hota hai jisay "shadow" ya "wick" kehte hain.

        Click image for larger version

Name:	image_124394.jpg
Views:	39
Size:	20.7 کلوبائٹ
ID:	12834886

        Dragonfly Doji ka feature.

        Dragonfly Doji ka feature yeh hai ke woh ek bottoming pattern hai. Yani ke, agar market ki downward trend ke baad yeh pattern form hota hai, toh yeh bullish reversal ki indication deta hai aur traders ko bullish trend ki shuruwat hone ke indication deta hai.

        Example.

        Is pattern ka example yeh hai ke agar ek candlestick ka close price ek particular level se neeche hota hai, lekin trading session ke end tak price wapis yeh level par aa jata hai ya phir yeh level se thora sa upar ya neeche jaata hai, toh woh ek Dragonfly Doji form karta hai.

        common interpretation.

        Is pattern ki ek common interpretation yeh hai ke jab yeh pattern form hota hai, toh market ka sentiment change hone ka indication hota hai aur bullish trend ki shuruwat hone ki possibility hoti hai. Lekin, yaad rakhiye ke is pattern ko confirm karna zaroori hai, jismein doosre technical indicators ka bhi istemal hota hai jaise ke RSI, MACD, ya moving averages.

        pattern traders.

        Yeh pattern traders ke liye ek powerful tool ho sakta hai kyunki isse price reversals ko anticipate kiya ja sakta hai. Agar doji ke head ke upar ek saath kuch bullish candlesticks form hote hain, toh yeh pattern aur bhi zyada reliable hota hai. Lekin, iska use samajhdari se karna chahiye aur doosre technical indicators ke saath istemal karna chahiye.

        Trading Strategy.

        Dragonfly Doji ek powerful candlestick pattern hai jo traders ko price reversals ki indication deta hai. Is pattern ka ek trading strategy yeh hai.

        1.Identify the Dragonfly Doji.

        Sabse pehle, aapko Dragonfly Doji pattern ko identify karna hai. Yeh ek doji pattern hai jismein open aur close prices barabar ya barabar ke bohot qareeb hote hain, aur doji ke dono taraf ek lambi shadow hoti hai.
        2.Confirm the Signal.

        Dragonfly Doji pattern ka use karte hue aapko doosre technical indicators ka bhi istemal karna chahiye jaise ke RSI, MACD, ya moving averages. Agar doji ke head ke upar ek saath kuch bullish candlesticks form hote hain, toh yeh pattern aur bhi zyada reliable hota hai.

        3.Entry Point.

        Agar aap Dragonfly Doji pattern ko identify kar lete hain aur bullish reversal ka confirmation bhi mil gaya hai, toh aapko entry point ko decide karna hai. Entry point ko decide karne ke liye aapko market ko closely observe karna chahiye aur price action ko analyze karna chahiye.

        4.Stop Loss and Take Profit.

        Ek trading strategy me stop loss aur take profit levels ko bhi define karna zaroori hota hai. Stop loss level ko aapko woh point decide karna hai jahan aapke trading strategy ke mutabiq aapko position ko close karna chahiye agar market direction aapke favour me nahi ja raha hai. Take profit level ko aapko woh point decide karna hai jahan aapko position ko close karna chahiye agar market direction aapke favour me ja raha hai.


        5.Risk Management.

        Har trading strategy me risk management bahut zaroori hota hai. Aapko apne trading capital ko protect karne ke liye risk management ko consider karna chahiye. Iske liye aap stop loss aur take profit levels ko define kar sakte hain, aur apne trading capital ko barabar risk per trade par limit kar sakte hain.

        Click image for larger version

Name:	image_124395.jpg
Views:	36
Size:	28.6 کلوبائٹ
ID:	12834887

        basic trading strategy.

        Yeh ek basic trading strategy hai jismein Dragonfly Doji pattern ka use kiya jata hai. Lekin, trading strategy ko samajhdari se follow karna chahiye aur doosre technical indicators ke saath bhi istemal karna chahiye.

        • #19 Collapse

          Inverted Hammer Candlestick Pattern:

          Click image for larger version

Name:	download - 2024-02-18T220250.104.png
Views:	25
Size:	5.8 کلوبائٹ
ID:	12834973

          1. Ta'aruf (Introduction):


          Inverted Hammer Candlestick Pattern, technical analysis mein aik ahem candlestick pattern hai jo market trends ko identify karne mein istemal hota hai. Yeh pattern market mein downtrend ke baad aata hai aur bullish reversal ko indicate karta hai.
          2. Kis Tarah Ka Hota Hai (Formation):


          Inverted Hammer, ek single candlestick pattern hai. Iski pehchan uski lambi upper shadow aur chhota sa body se hoti hai. Upper shadow lambi hoti hai aur lower shadow chhoti hoti hai. Inverted Hammer ka opening price lower side par hota hai aur closing price upper side par hota hai.
          3. Upper Shadow (Upper Shadow):


          Inverted Hammer ki sabse prominent feature uski lambi upper shadow hoti hai. Upper shadow, candlestick ki upper wick ya tail hoti hai aur ye indicate karti hai ke market mein sellers ne ek higher price level tak push kiya tha.
          4. Body (Body):


          Inverted Hammer ka body chhota hota hai aur iska color bhi matter karta hai. Agar body red hai, toh iska matlub hai ke opening price lower side par tha aur closing price upper side par. Jabke agar body green hai, toh opening price upper side par hota hai aur closing price lower side par.
          5. Lower Shadow (Lower Shadow):


          Inverted Hammer ke neeche ki taraf bhi ek chhota sa shadow hota hai, lekin yeh upper shadow se zyada prominent nahi hota. Lower shadow, candlestick ki lower wick ya tail hoti hai aur ye indicate karta hai ke market mein ek time par neeche ki taraf bhi movement hui thi.
          6. Bullish Reversal Signal (Bullish Reversal Signal):


          Inverted Hammer, bearish trend ke baad aane wala bullish reversal signal hai. Is pattern ki tafseelat ko samajhne ke liye, traders ko market context aur nearby support levels ka bhi tawajju dena chahiye.
          7. Confirmation (Tasdeeq):


          Inverted Hammer ko trade karne se pehle traders ko confirmation ke liye next candlestick ka wait karna chahiye. Agar next candlestick bullish hai aur isko follow karta hai, toh yeh Inverted Hammer ko confirm karta hai.
          8. Volume Analysis (Volume Ka Tawajju):


          Inverted Hammer ko confirm karne mein volume ka bhi tawajju dena chahiye. Agar Inverted Hammer ke sath volume mein bhi increase hota hai, toh yeh signal strong hota hai.
          9. Targets Aur Stops (Targets and Stops):


          Traders ko Inverted Hammer ko trade karte waqt apne targets aur stops ko tay karna chahiye. Targets ko set karte waqt previous price swings aur resistance levels ka bhi khayal rakhna chahiye.
          10. Conclusion (Ikhtitam):


          Inverted Hammer Candlestick Pattern, traders ko market trends ke changes aur potential bullish reversals ke baare mein agah karta hai. Is pattern ka sahi taur par istemal karke, traders apne trading strategies ko refine kar sakte hain aur potential trend reversals ko pehchan sakte hain
          • #20 Collapse

            Dragonfly Doji Candlestick Pattern.
            Dragonfly Doji ek candlestick pattern hai jo ki technical analysis mein use hota hai. Ye pattern ek single candlestick se banta hai aur market sentiment ko represent karta hai.
            .


            Dragonfly Doji candlestick ek specific shape mein hota hai jismein:
            1. Open Price: Open price aur close price ek doosre ke bohot qareeb hotay hain ya aik dosray ke barabar.
            2. High Price: High price market mein highest point ko represent karta hai aur usually upper shadow ki absence ki wajah se identify hota hai.
            3. Low Price: Low price market mein lowest point ko represent karta hai.
            4. No or Very Small Body: Is candlestick ka body negligible hota hai ya bilkul chota hota hai.
            Analysis
            Dragonfly Doji ka naam isliye hai kyun ke iski shape ek dragonfly ke jaise hoti hai, jismein ek lambi tail hoti hai jo price ke higher levels ko indicate karti hai, jabki body near the opening price hoti hai.Dragonfly Doji usually downtrend ya bearish movement ke baad dikhai deta hai aur bullish reversal ka indication deta hai. Is pattern ko dekhte hue traders ko bullish reversal ka expectation hota hai.

            Treading Strategy
            Is pattern ko confirm karne ke liye, traders dusre technical indicators aur price action analysis ka istemal karte hain. Agar Dragonfly Doji kisi significant support level ke neeche ya trendline ke pass dikhta hai aur confirmatory signals ke saath aata hai, toh yeh bullish reversal ke liye strong indication hota hai.Lekin hamesha yaad rahe ke koi bhi single candlestick pattern 100% accurate nahi hota hai, isliye confirmatory signals aur risk management ko bhi dhyan mein rakhte hue trading decisions lena zaroori hai.


            • #21 Collapse

              Dragonfly doji candlestick pattern


              Candlestick patterns play a crucial role in technical analysis, aiding traders in making informed decisions about the future movement of financial instruments. Among these patterns, the Dragonfly Doji holds a special place, serving as a significant indicator of potential trend reversals in the market.


              Dragonfly Doji Kya Hai?

              Dragonfly Doji candlestick pattern ek unique aur powerful signal hai jo market mein hone wale possible changes ko darust karti hai. Is pattern ka naam iske shape se aya hai, jo ek dragonfly ki tarah hota hai. Isme ek lambi thin line hoti hai jo upper shadow ko represent karti hai, jabke lower shadow nahi hoti. Iska matlab hai ke opening aur closing price ek dosre ke bohot qareeb hoti hain.


              Dragonfly Doji Ka Matlab Kya Hai?

              Dragonfly Doji ka matlub hota hai ke market mein sellers aur buyers mein balance hai. Is pattern ki sab se ahem baat ye hai ke jab market open hoti hai, prices initially girte hain, lekin by the end of the session, they recover and come back close to the opening price. Ye dikhata hai ke buyers ne control le liya hai aur market mein potential trend reversal hone wala hai.


              Dragonfly Doji Aur Trend Reversal:

              Dragonfly Doji pattern ko dekhte hue traders ko samajh aata hai ke agar ye pattern downtrend ke baad aata hai, toh ye bullish reversal indicator ho sakta hai. Iska matlub hai ke market ka trend badal sakta hai aur buyers control mein aa sakte hain. Lekin, hamesha yaad rahe ke ek hi candlestick pattern par pura bharosa na karein, aur dusre technical indicators aur tools ka bhi istemal karein.


              Trading Strategies Using Dragonfly Doji:

              Dragonfly Doji pattern ka istemal trading strategies banane mein hota hai. Agar aapko lagta hai ke market mein trend reversal hone wala hai, toh aap long position le sakte hain. Lekin, hamesha risk management ko yaad rakhein aur dusre confirmatory signals ka bhi intezar karein.


              Dragonfly Doji candlestick pattern ek powerful tool hai jo traders ko market trends ke changes ko samajhne mein madad karta hai. Lekin, hamesha dhyan rahe ke technical analysis mein kisi bhi ek indicator par pura bharosa na karein aur market ke mukhtalif aspects ko madde nazar rakhein.
              • #22 Collapse

                Dragonfly Doji candlestick Pattern:Dragonfly Doji Candlestick Pattern ka matlub hota hai ke market mein initial selling pressure hone ke bawajood, buyers ne control hasil kar liya hai aur prices ko wapas upar le gaye hain. Yeh ek bullish reversal ko darust kar sakta hai, lekin confirmation ke liye doosre technical indicators ka bhi moolya liya jata hai. technical analysis chart pattern hai joDragonfly Doji Candlestick ka pehchaan karne ka pehla tariqa hai iski shape ka dekhna. Dragonfly Doji ek lambi tail (lower shadow) ke saath hota hai, jabki opening aur closing prices takreeban barabar ya takreeban barabar hoti hain. Iske wajah se iski shape ek dragonfly ya helicopter ki tarah lagti hai. market mein possible trend reversal ko indicate karta hai. Yeh pattern ek specific candlestick ko describe karta hai jo market mein uncertainty ya indecision ko darust karnay ke liye istemal hota hai.Trading Strategies: Dragonfly Doji ke formation ke baad, traders ko confirmatory signals ka wait karna chahiye.Pivot points ka istemal karte waqt, traders ko dusre technical indicators ke sath combine karke istemal karna chaiye.Dragonfly Doji Candlestick Pattern ka matlub hota hai ke market mein initial selling pressure hone ke bawajood, buyers ne control hasil kar liya hai aur prices ko wapas upar le gaye hain. Yeh ek bullish reversal ko darust kar sakta hai, lekin confirmation ke liye doosre technical indicators ka bhi moolya liya jata hai. Ye unke trading decisions ko confirm karta hai aur false signals ko minimize karta hai. Agar ye ek strong support level ke paas aata hai, toh iska impact aur bhi zyada hota hai. Confirmatory indicators ka istemal bhi kiya ja sakta hai.Stop-Loss Aur Take-Profit Levels: Dragonfly Doji Candlestick Pattern ko dekh kar apni trading strategies ko shape dete hain. Kuch traders is pattern ko buy signal samajhte hain aur iske baad bullish positions lete hain, lekin hamesha yaad rahe ke kisi bhi trading decision se pehle doosre factors ka bhi moolya karna zaroori hai.Har trade ko madde nazar rakhte hue, dragonfly doji pattern market ke trend ke beech mein aata hai to iska matlab hai ki market mein uptrend ki possibility hai. Agar is pattern ke baad market mein price increase hoti hai to iska matlab hai ki market mein bullish trend hai aur agar price decrease hoti hai to iska matlab hai ki market mein bearish trend hai. traders ko stop-loss aur take-profit levels set karna chahiye. Yeh unhein nuksan se bachane aur munafa kamane mein madad karta hai.

                • <a href="https://www.instaforex.org/ru/?x=ruforum">InstaForex</a>
                • #23 Collapse

                  Dragonfly doji candlestick pattern

                  Click image for larger version

Name:	y.png
Views:	18
Size:	29.8 کلوبائٹ
ID:	12835148

                  Dragonfly Doji ek candlestick pattern hai jo market analysis mein istemal hota hai. Yeh pattern market mein potential reversal ko darust karte hue dikhta hai. Dragonfly Doji ek single candlestick pattern hai, jise traders price action analysis mein istemal karte hain. Iski pehchan candlestick chart par iske kuch khaas features ke through hoti hai.


                  Dragonfly Doji Ki Pechan:


                  Dragonfly Doji candlestick pattern ko dekhte hue, iski pehchan ke liye kuch mukhtalif cheezein maddadgar hoti hain:
                  1. Body Size: Dragonfly Doji ka body bahut chhota hota hai, jisse ye distinguish hota hai. Iska body ke center mein ek horizontal line hoti hai.
                  2. Shadow: Ismein upper shadow (upar ka chhaya) present hota hai, jabki lower shadow (neecha ka chhaya) absent hota hai ya bahut chhota hota hai.
                  3. Closing Price: Closing price, opening price se kareeb hoti hai ya barabar hoti hai, lekin trading session ke dauran asset ki keemat mein fluctuation hoti hai.


                  Dragonfly Doji Ka Arth Aur Market Sentiment:


                  Dragonfly Doji pattern market mein potential reversal ko indicate karta hai. Agar yeh pattern downtrend ke baad aata hai, toh iska matlab hai ki sellers ke control mein hone wala trend weak ho sakta hai aur buyers ka dominance shuru ho sakta hai.


                  Trading Strategies Using Dragonfly Doji:
                  1. Reversal Signal: Dragonfly Doji ko dekh kar traders ko lag sakta hai ki current trend mein reversal hone ke chances hain. Is pattern ke baad agar bullish candlestick pattern aata hai toh yeh indication ho sakta hai ki buyers control mein aa gaye hain.
                  2. Support and Resistance Levels: Dragonfly Doji ko support aur resistance levels ke saath combine karke bhi istemal kiya ja sakta hai. Agar yeh pattern kisi important support level ke paas aata hai toh woh support strong ho sakta hai.


                  Conclusion:


                  Dragonfly Doji candlestick pattern ek powerful tool ho sakta hai market analysis mein, lekin iski sahi samajh aur istemal ke liye traders ko market ke overall context ko bhi consider karna important hai. Market mein risk ka factor hamesha hota hai, isliye traders ko prudent risk management bhi dhyan mein rakhna chahiye jab woh is pattern ka istemal karte hain.

                  اب آن لائن

                  Working...
                  X