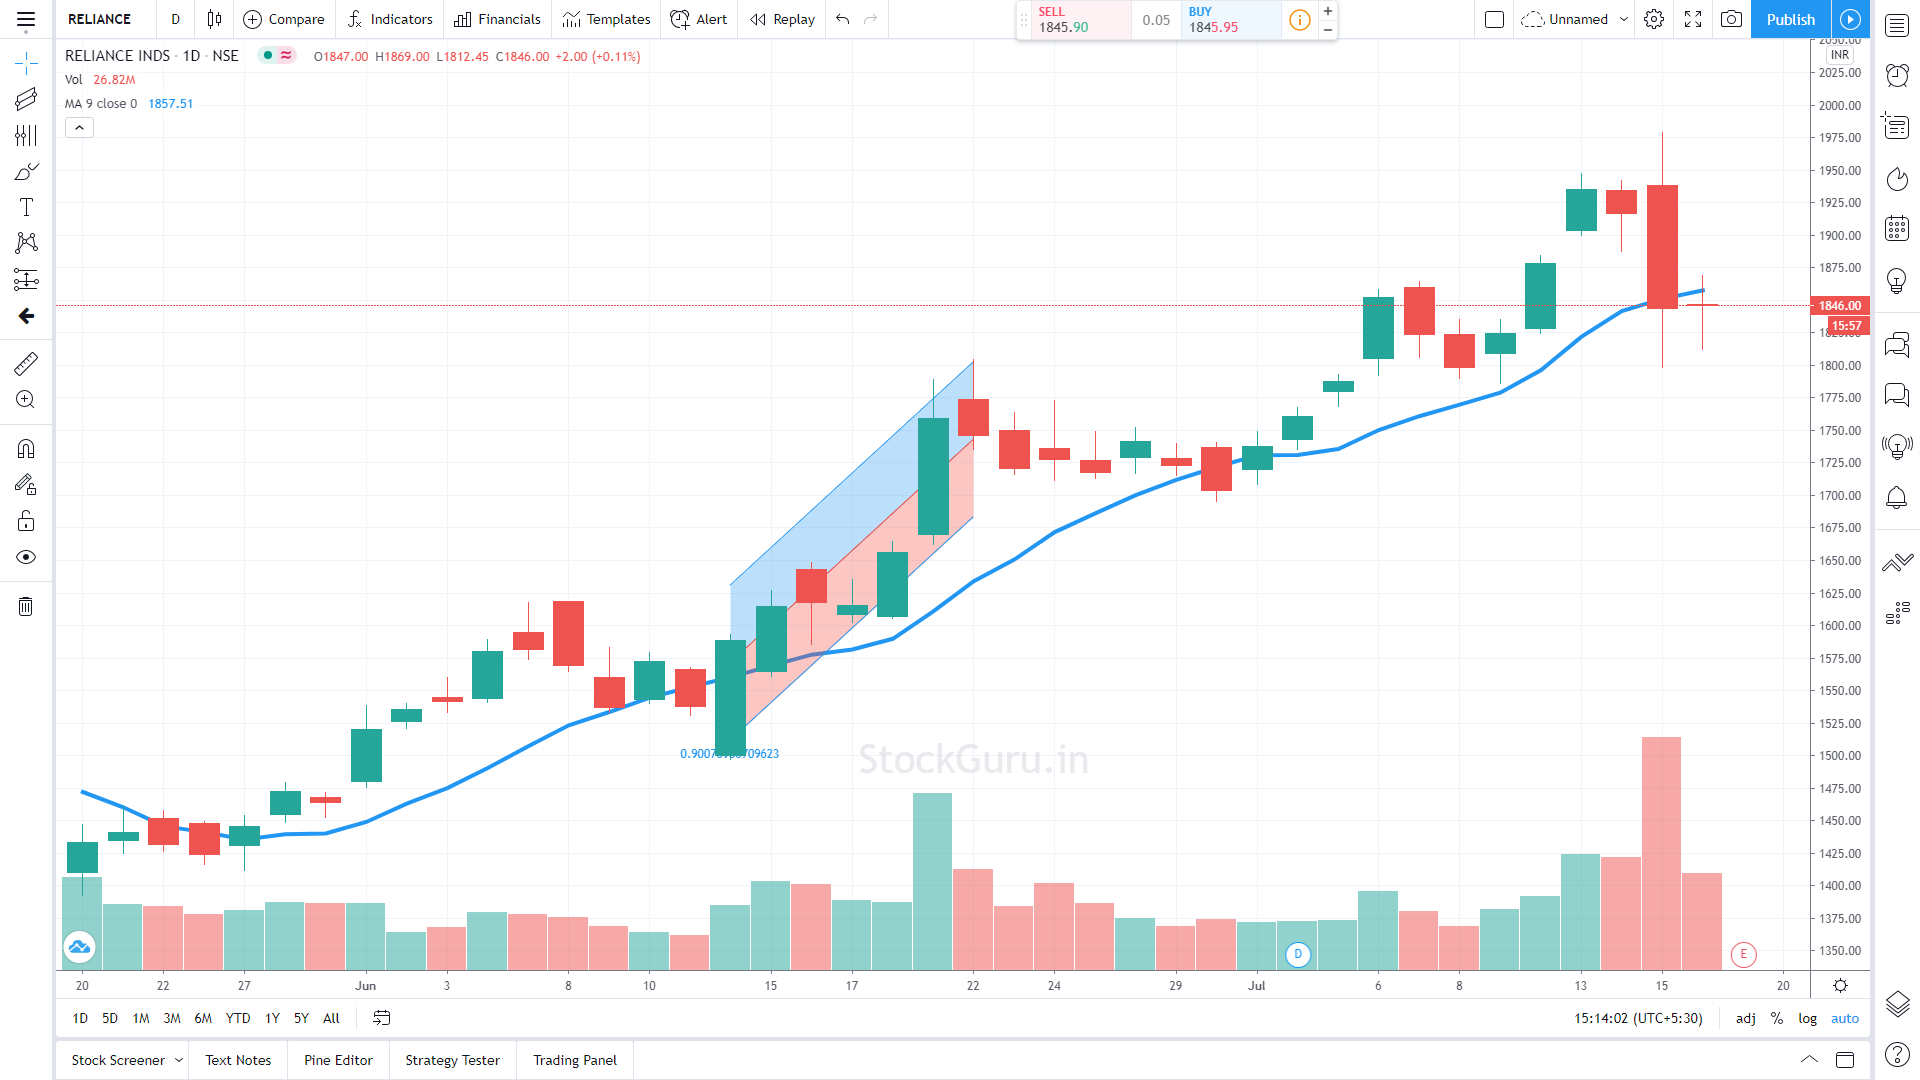
Regression Channel index at trading Chart.

No announcement yet.
`
X
  • وقت
  • دکھائیں
Clear All
new posts
  • #1 Collapse

    Regression Channel index at trading Chart.
    Use of Regression Channel in Trading,

    Regression Channel trading mein ek ahem tool hai jo ke statistical analysis par mabni hota hai. Iska istemal market trends aur price movements ko samajhne mein kiya jata hai.


    What is Regression Channel Index?

    Regression Channel ek statistical concept hai jo data points ko analyze kar ke ek trend line create karta hai. Trading mein, yeh channel prices ke around ek line banata hai jo market trend ko represent karta hai. Isme do parallel lines hoti hain jo prices ke expected range ko define karti hain.

    Components of Regression Channel Index,

    Regression Channel mein do mukhtalif components hote hain:

    Regression Line,Yeh line data points ko analyze kar ke market ka primary trend show karti hai.


    Upper Channel Line,Yeh line regression line ke upar ek fixed distance par chalti hai, prices ke upper limit ko represent karti hai.

    Lower Channel Line, Yeh line regression line ke neeche ek fixed distance par chalti hai, prices ke lower limit ko represent karti hai.

    How to Draw Regression Channels,

    Data Points, Pehle toh, trading data ko collect karein. Isme past prices shamil hote hain jo ke aapke analysis ke liye istemal hote hain.

    Regression Line,Regression line ko draw karne ke liye, aapko statistical tools ka istemal karna hoga jo ke market ke trend ko represent kare.


    Upper aur Lower Lines, Upper aur lower lines ko add karein jinhein regression line ke upar aur neeche ek fixed percentage se create kiya jata hai.

    Trading Strategies Using Regression Channel,

    Trend Identification,Regression Channel ke istemal se aap market trend ko identify kar sakte hain. Agar prices upper line ke pass hain toh yeh bullish trend ko indicate kar sakta hai aur agar lower line ke pass hain toh bearish trend indicate ho sakta hai.

    Entry Points, Regression Channel se aap entry points bhi identify kar sakte hain. For example, agar prices lower line ke pass hain aur phir upper line ki taraf ja rahe hain toh yeh entry point ho sakta hai.

    Risk Management,Regression Channel ko istemal kar ke aap apne trades ki risk management bhi improve kar sakte hain. Upper aur lower lines aapko price movements ke expected range ko batati hain jisse aap apne stop-loss aur take-profit levels set kar sakte hain.

    Limitations and Precautions,
    • Regression Channel ke istemal mein hamesha limitations ko dhyan mein rakhein. Market conditions change ho sakti hain aur yeh tool sirf ek guide hai.
    • Multiple indicators ke sath istemal karna behtar ho sakta hai for a more comprehensive analysis.
    • Regularly update karein apne regression lines ko taki recent market conditions ko reflect kiya ja sake.
    • Regression Channel ek powerful tool hai jo traders ko market trends samajhne mein aur trading strategies banane mein madad karta hai. Iska sahi istemal karke, aap apne trading approach ko refine kar sakte hain aur market movements ko better predict kar sakte hain.
  • <a href="https://www.instaforex.org/ru/?x=ruforum">InstaForex</a>
  • #2 Collapse

    Regression Channel index at trading Chart.

    Click image for larger version

Name:	Linear-Regression-Strategy-2-Swing-Trading.png
Views:	62
Size:	40.9 کلوبائٹ
ID:	12825612

    Regresion Channel Index (RCI) - Tijarati Chart Par Poora Tafseelat

    Regresion Channel Index (RCI) ek technical analysis tool hai jo traders ko market trends aur momentum ka andaza lagane mein madad deta hai. Is indicator ka istemal market volatility aur trend reversals ko samajhne ke liye hota hai. Is article mein, hum RCI ke bare mein roman Urdu mein tafseelat se baat karenge.

    1. RCI Kya Hai?

    Regresion Channel Index (RCI) ek momentum oscillator hai jo price ki velocity aur direction ko measure karta hai. Is indicator ka mool maqsad market trends aur reversals ko darust karna hai. RCI ko High-Low Regression Channel ke zariye calculate kiya jata hai.

    2. RCI Ke Components

    RCI ke mukhya components hote hain:
    • High-Low Regression Channel: RCI ko calculate karne ke liye High-Low Regression Channel ka istemal hota hai. Yeh channel price ke highest aur lowest points ko track karta hai aur price ki movement ka ek linear regression trend line banata hai.
    • RCI Line: RCI line linear regression channel ke andar hoti hai jo momentum ko darust karti hai. Is line ka movement price ki momentum ko darust karta hai aur trend reversals ko identify karta hai.

    3. RCI Ka Istemal Kaise Hota Hai?

    RCI ka istemal karke, traders market trends aur reversals ko samajhne ki koshish karte hain. Jab RCI line ek uptrend ya downtrend mein hai, to ye indicate karta hai ke market momentum strong hai. Jabke RCI line extremes ke qareeb hai ya reversals dikhata hai, to ye indicate karta hai ke market momentum weak ho raha hai aur trend reversal hone ka chance hai.

    4. RCI Aur Overbought/Oversold Levels

    RCI ke istemal se traders overbought aur oversold levels ko bhi identify kar sakte hain. Agar RCI line upper extreme ke qareeb hai, to ye indicate karta hai ke market overbought hai aur potential reversal ka chance hai. Jabke agar RCI line lower extreme ke qareeb hai, to ye indicate karta hai ke market oversold hai aur potential reversal ka chance hai.

    5. RCI Aur Confirmatory Indicators

    RCI ko confirm karne ke liye, traders doosre technical indicators aur price action analysis ka bhi istemal karte hain. Is tarah ke confirmatory signals se traders apne trading decisions ko optimize kar sakte hain aur false signals ko minimize kar sakte hain.

    6. Conclusion

    Regresion Channel Index (RCI) ek aham technical analysis tool hai jo market trends aur momentum ko samajhne mein madad karta hai. Is indicator ka sahi taur par istemal karke, traders apne trading strategies ko optimize kar sakte hain aur behtar results haasil kar sakte hain. Lekin, har trading decision ke saath sahi risk management ka hona zaroori hai taake traders apne nuksanat ko minimize kar sakein.
    • #3 Collapse

      Regression Channel index at trading Chart.

      Click image for larger version

Name:	Linear-Regression-Channel-Indicator.png
Views:	66
Size:	60.7 کلوبائٹ
ID:	12825616

      Regresion Channel Index (RCI) - Tijarati Chart Par Puri Tafseelat

      1. RCI Ki Pehchan

      Regresion Channel Index (RCI) ek technical analysis ka aala hai jo market trends aur momentum ka andaza lagane mein madad deta hai. Ye ek oscillator hai jo price ki velocity aur direction ko measure karta hai. Iska mool maqsad market trends aur reversals ko samajhna hai.

      2. RCI Ke Components

      RCI ke mukhya components:
      • High-Low Regression Channel: RCI ko calculate karne ke liye High-Low Regression Channel ka istemal hota hai. Yeh channel price ke highest aur lowest points ko track karta hai aur price ki movement ka ek linear regression trend line banata hai.
      • RCI Line: RCI line linear regression channel ke andar hoti hai jo momentum ko darust karti hai. Is line ka movement price ki momentum ko darust karta hai aur trend reversals ko identify karta hai.

      3. RCI Ka Istemal

      RCI ka istemal karke traders market trends aur reversals ko samajhne ki koshish karte hain. RCI line ka movement dekha jata hai, agar ye ek uptrend ya downtrend mein hai, to ye indicate karta hai ke market momentum strong hai. Jab ye extremes ke qareeb hai, to ye indicate karta hai ke market momentum weak ho raha hai aur trend reversal hone ka chance hai.

      4. Overbought/Oversold Levels

      RCI ke istemal se traders overbought aur oversold levels ko bhi identify kar sakte hain. Agar RCI line upper extreme ke qareeb hai, to ye indicate karta hai ke market overbought hai aur potential reversal ka chance hai. Jabke agar RCI line lower extreme ke qareeb hai, to ye indicate karta hai ke market oversold hai aur potential reversal ka chance hai.

      5. RCI Aur Confirmatory Indicators

      RCI ko confirm karne ke liye, traders doosre technical indicators aur price action analysis ka istemal karte hain. Is tarah ke confirmatory signals se traders apne trading decisions ko optimize kar sakte hain aur false signals ko minimize kar sakte hain.

      6. Conclusion

      RCI ek aham technical analysis tool hai jo market trends aur momentum ko samajhne mein madad karta hai. Is indicator ko sahi taur par istemal karke traders behtar trading decisions le sakte hain aur nuksanat ko minimize kar sakte hain. Lekin, har trading decision ke saath sahi risk management ka hona zaroori hai.
      • #4 Collapse

        Click image for larger version

Name:	download 7.png
Views:	59
Size:	10.3 کلوبائٹ
ID:	12825628


        The "Regression Channel Index" (RCI) ek technical indicator hai jo trading charts mein istemal hota hai. Ye indicator market trend aur volatility ko assess karne ke liye use hota hai. Ye indicator linear regression aur momentum oscillators ke concepts ko combine karta hai aur market trends ke baare mein insights provide karta hai.

        Regression Channel Index ka kaam kaise karta hai:
        1. Calculation: RCI ka calculation current price ki deviation par based hota hai regression channel se. Ye measure karta hai price aur regression channel ke upper ya lower boundary ke darmiyan ki doori ko.
        2. Interpretation: RCI values zero se ooper hone par dikhata hai ke current price regression channel ke upar hai, jo ke bullish momentum ko darust karta hai. Baraks, RCI values zero se neeche hone par dikhata hai ke current price regression channel ke neeche hai, jo ke bearish momentum ko darust karta hai.
        3. Overbought aur Oversold Conditions: Traders RCI ko overbought aur oversold conditions ka pata lagane ke liye use karte hain. Jab RCI extreme positive values tak pohochta hai, to ye dikhata hai ke market overbought ho sakta hai aur ek reversal hone wala hai. Baraks, jab RCI extreme negative values tak pohochta hai, to ye dikhata hai ke market oversold ho sakta hai aur ek bounce ka possibility hai.
        4. Divergence: RCI divergence tab hoti hai jab indicator ka direction price trend se mukhtalif hota hai. Bullish divergence hoti hai jab RCI higher lows banata hai jabke prices lower lows banate hain, jo ke potential bullish reversal ko indicate karta hai. Ulta, bearish divergence hoti hai jab RCI lower highs banata hai jabke prices higher highs banate hain, jo ke potential bearish reversal ko indicate karta hai.

        Traders RCI ko doosre technical analysis tools ke saath mila kar trading decisions banate hain. Trading strategy banate waqt dusre factors jaise ke volume, trend lines, aur support/resistance levels ka bhi dhyan dena zaroori hai.


        • #5 Collapse


          Regression Channel index at trading Chart.


          Click image for larger version

Name:	download - 2024-02-09T054225.300.png
Views:	69
Size:	6.4 کلوبائٹ
ID:	12825642


          Regression Channel Index (RCI) ek technical indicator hai jo price action ko analyze karke market direction aur momentum ko measure karta hai. Yeh indicator ek regression channel ke andar price movements ko dekhta hai aur unke deviations ko quantify karta hai.

          RCI calculation ko chhod kar, yeh ek standard deviation ko use karta hai market volatility aur trend strength ko measure karne ke liye. Is indicator ka use karke traders market ke overbought aur oversold levels ko identify kar sakte hain, aur potential reversal points ya trend changes ko anticipate kar sakte hain.

          RCI indicator ki calculation mein typically ye steps involved hote hain:
          1. Regression Channel Calculation: Pehle, ek regression channel draw kiya jata hai, jo price ke recent movements ko represent karta hai. Regression channel usually trend lines ko use karta hai jo price ke "best fit" trend ko represent karte hain.
          2. Standard Deviation Calculation: Uske baad, regression channel ke andar aur bahar ke price movements ke standard deviations calculate kiye jate hain. Ye deviations market volatility ko represent karte hain.
          3. RCI Calculation: Regression channel ke andar aur bahar ke price movements ka ratio calculate kiya jata hai. Ye ratio RCI indicator ko generate karta hai.

          RCI indicator typically ek oscillating indicator hota hai, jo usually -100 se +100 ke beech range mein hota hai. Positive values indicate bullish momentum aur negative values indicate bearish momentum. Traders is indicator ko use karke overbought aur oversold levels ko identify karte hain, jahan price reversal ki sambhavna hoti hai.

          RCI indicator ko dusre technical indicators ke saath combine kiya jata hai market analysis ke liye. Iske saath hi, traders ko RCI ki divergences aur crossovers par dhyan dena chahiye, jo potential trading signals provide kar sakte hain.


          • #6 Collapse

            Regression Channel index at trading Chart.


            Click image for larger version

Name:	download - 2024-02-09T054657.209.jpeg
Views:	70
Size:	25.1 کلوبائٹ
ID:	12825648


            Regression Channel Index (RCI) ek technical indicator hai jo price action ko analyze karke market direction aur momentum ko measure karta hai. Yeh indicator ek regression channel ke andar price movements ko dekhta hai aur unke deviations ko quantify karta hai.

            RCI calculation ko chhod kar, yeh ek standard deviation ko use karta hai market volatility aur trend strength ko measure karne ke liye. Is indicator ka use karke traders market ke overbought aur oversold levels ko identify kar sakte hain, aur potential reversal points ya trend changes ko anticipate kar sakte hain.

            RCI indicator ki calculation mein typically ye steps involved hote hain:
            1. Regression Channel Calculation: Pehle, ek regression channel draw kiya jata hai, jo price ke recent movements ko represent karta hai. Regression channel usually trend lines ko use karta hai jo price ke "best fit" trend ko represent karte hain.
            2. Standard Deviation Calculation: Uske baad, regression channel ke andar aur bahar ke price movements ke standard deviations calculate kiye jate hain. Ye deviations market volatility ko represent karte hain.
            3. RCI Calculation: Regression channel ke andar aur bahar ke price movements ka ratio calculate kiya jata hai. Ye ratio RCI indicator ko generate karta hai.

            RCI indicator typically ek oscillating indicator hota hai, jo usually -100 se +100 ke beech range mein hota hai. Positive values indicate bullish momentum aur negative values indicate bearish momentum. Traders is indicator ko use karke overbought aur oversold levels ko identify karte hain, jahan price reversal ki sambhavna hoti hai.

            RCI indicator ko dusre technical indicators ke saath combine kiya jata hai market analysis ke liye. Iske saath hi, traders ko RCI ki divergences aur crossovers par dhyan dena chahiye, jo potential trading signals provide kar sakte hain.


            • #7 Collapse

              Regression Channel index at trading Chart.

              Click image for larger version

Name:	download - 2024-02-09T054902.692.jpeg
Views:	73
Size:	15.5 کلوبائٹ
ID:	12825650


              Regression Channel Index (RCI) ek technical analysis indicator hai jo trading charts par istemal hota hai. Iska mukhya uddeshya market trends ko identify karna aur potential reversals ko anticipate karna hai. Yeh indicator ek specific time period ke price action ko analyze karta hai aur uske basis par ek regression channel banata hai.

              Yeh steps follow karta hai:
              1. Linear Regression: Sabse pehle, RCI ek linear regression line banata hai, jo market ke recent price movements ko represent karti hai. Is line ke slope aur intercept ke madhyam se current trend ko estimate kiya jata hai.
              2. Channel Construction: Linear regression line ke dono taraf, ek upper channel line aur ek lower channel line draw ki jati hai. Ye channel price ke expected range ko darust karta hai. Jaise ki linear regression line ke pass honi chahiye, channel lines bhi market trends ko achhe se reflect karni chahiye.
              3. RCI Calculation: RCI ko calculate karne ke liye, current price ka linear regression line ke respect mein position dekha jata hai. Is position ka percentage value nikala jata hai, jo RCI ke roop mein prastut hoti hai.
                • Positive RCI (usually 0 se 100 ke beech): Agar current price upper channel line ke pass hai, to RCI positive hota hai. Ye bullish trend ko darust karta hai.
                • Negative RCI (usually -100 se 0 ke beech): Agar current price lower channel line ke pass hai, to RCI negative hota hai. Ye bearish trend ko darust karta hai.
              4. Trading Decisions: Traders RCI ka istemal karke market trends ko analyze karte hain. Positive RCI ke samay, uptrend ke chances hote hain, jabki negative RCI bearish trend ko indicate karta hai. Traders is information ka istemal karke entry aur exit points decide karte hain.

              RCI ek technical indicator hai, aur iska istemal dusre tools aur analysis ke saath kiya jata hai trading strategies banane mein. Har trader apne risk tolerance aur trading style ke anusar iska istemal karta hai.


              • #8 Collapse

                Regression Channel index at trading Chart.


                "Regression Channel Index" ko trading chart par dekhnay ka tareeqa samajhnay ke liye, sab se pehlay samajhna zaroori hai ke ye indicator kis tarah ka hai aur kis tarah se kaam karta hai. Regression Channel Index (RCI) ek technical indicator hai jo market trend ko measure karta hai.

                Yeh indicator regression analysis ka istemal karta hai, jisme past prices ka data liya jata hai takay trend ko analyze kiya ja sake. Iska maqsad market ki volatility aur trend direction ko samajhna hota hai.

                Regression Channel Index ko chart par istemal karne ke liye, aapko kisi trading platform ya software ka istemal karna hoga jo ye indicator support karta hai. Yahan kuch steps diye gaye hain jo aapko is indicator ko trading chart par add karne mein madad karenge:
                1. Trading Platform Select Karein: Apne trading ke liye kisi platform ka chayan karein jo Regression Channel Index ko support karta hai. Popular trading platforms jaise ke MetaTrader 4/5 ya TradingView ka istemal kiya ja sakta hai.
                2. Indicator Ko Chart Par Add Karein: Apne trading platform par jayein aur chart open karein. Fir, indicator list ya search option se "Regression Channel Index" ko select karein aur chart par add karein.
                3. Settings Ka Chayan Karein: Regression Channel Index ke settings ko customize karein jaise ke time period, colors, aur anya parameters. Ye aapko market conditions ke mutabiq adjust karna hoga.
                4. Interpretation Karein: Regression Channel Index ko samajhne ke liye, iske values ko analyze karein. Positive values market mein upar ki taraf trend ko indicate karte hain jabke negative values downward trend ko darust karti hain.

                Yeh indicator market ke trend ko samajhne mein madad karta hai, lekin hamesha yaad rakhein ke kisi bhi indicator ko istemal karte waqt risk management ka khayal rakhein aur dusre confirmatory indicators ke saath istemal karein. Trading mein hamesha caution aur research ki zarurat hoti hai.


                • #9 Collapse

                  Yes dear, Regression Channel ek technical analysis tool hai jo market trends aur price movements ko analyze karne mein istemal hota hai. Yeh channel price action ko ek linear regression line ke aas paas draw karta hai, is kay main characteristics yeh hain,

                  1. Regression Channel Ki Tashkeel:

                  Regression Channel do parallel lines se mil kar bana hota hai, jo price ke around linear regression line ke based hota hai. Yeh lines upper aur lower price boundaries ko darust karte hain,

                  2. Linear Regression Line:

                  Linear regression line ek trend line hai jo price ke historical data par based hoti hai. Yeh line market trend ko darust karta hai aur channel ke center mein hoti hai,

                  Click image for larger version

Name:	images(75).jpg
Views:	48
Size:	23.7 کلوبائٹ
ID:	12825661

                  3. Upper Aur Lower Boundaries:

                  Regression Channel ke upper aur lower boundaries linear regression line ke standard deviations ke based hoti hain. Yeh boundaries price ke around volatility ko darust karte hain,

                  4. Standard Deviation Ka Tawun:

                  Regression Channel ke boundaries ko calculate karne ke liye standard deviation ka istemal hota hai. Is se price ke around volatility aur potential reversal points ko darust kia jata hai,

                  5. Regression Channel Ka use:

                  Is Channel ko trading strategies mein istemal karke traders market movements ko samajhne aur price trends ko anticipate karte hain. Isse unka trading performance improve hota hai,

                  6. Channel Width Ka Ahmiyat:

                  Regression Channel ke width ka bhi ahmiyat hota hai. Choti width kam volatility aur consolidation ko darust karti hai, jab ke badi width zyada volatility aur trending market ko darust karti hai,

                  7. Regression Channel Aur Moving Averages:

                  ​​​​​​Is Channel ko moving averages ke saath mila kar istemal karne se traders ko confirmatory signals milte hain. Yeh combination trend direction aur potential reversals ko samajhne mein madadgar hota hai,

                  8. Breakouts Aur Reversals:

                  Regression Channel breakouts aur reversals ko bhi darust karta hai. Agar price channel ke bahar ja raha hai, to yeh indicate karta hai ke potential breakout ya trend reversal hone wala hai
                  • #10 Collapse

                    Regression channel index at trading chart.

                    Click image for larger version

Name:	2.png
Views:	47
Size:	67.0 کلوبائٹ
ID:	12825669


                    Regression Channel Index (RCI) ek technical analysis indicator hai jo market trends aur price movements ko evaluate karne mein madad karta hai. Yeh indicator primarily regression channels ka istemal karta hai, jinke madhyam se price movements ko track kiya jata hai. RCI traders ko market momentum aur possible trend reversals ke bare mein insights pradan karta hai.


                    Regression Channel Index ka Aakar:


                    Regression Channel Index ek oscillator hota hai, jiska display trading chart par hota hai. Yeh typically ek line ke roop mein represent hota hai, jo ek horizontal axis par position lete hue price movements ko dikhata hai.


                    Regression Channel Index ke Key Features:
                    1. Regression Channel ka Istemal:
                      • RCI, regression channels ke madhyam se price trends aur volatility ko measure karta hai. Regression channels, linear regression lines ke ek set hoti hain jo price ke aas-paas fit hoti hain.
                    2. Overbought aur Oversold Levels:
                      • RCI, overbought aur oversold levels ko highlight karta hai, jisse traders ko potential reversal points ka pata chal sake.
                    3. Momentum Indication:
                      • RCI market momentum ko indicate karta hai. Positive values indicate uptrends aur negative values indicate downtrends.


                    Regression Channel Index ka Istemal Trading Chart par:


                    RCI ka istemal karne ke liye, traders ko kuch basic steps follow karne chahiye:
                    1. Trend Analysis:
                      • Regression channels ke madhyam se trend analysis karein. Uptrend mein upper channel line ko aur downtrend mein lower channel line ko observe karein.
                    2. RCI Calculation:
                      • RCI calculate karein, jo regression channel ke andar ke price movements par adharit hota hai.
                      • RCI ka formula: ���=(�����−�������������������)(������������������ �−�������������������)×100RCI=(UpperRegressionLine −LowerRegressionLine)(Close−UpperRegressionLine)​× 100
                    3. Overbought aur Oversold Levels:
                      • RCI ke values ka interpretation karein. Typically, 70 se upar ka value overbought conditions ko darust karta hai, jabki -70 se neeche ka value oversold conditions ko darust karta hai.
                    4. Divergence Analysis:
                      • Price movements aur RCI ke beech ki divergence ko observe karein. Divergence, future price movements ke potential indicators mein se ek ho sakta hai.


                    Regression Channel Index ka istemal karte waqt kuch mahatva purna tips:
                    1. Confirmatory Indicators:
                      • RCI ke signals ko confirm karne ke liye doosre technical indicators ka bhi istemal karein, jaise ki moving averages, RSI, aur MACD.
                    2. Timeframes ka Dhyan Rakhein:
                      • Different timeframes par RCI ka analysis karke, traders ko short-term aur long-term trends ka better pata chal sakta hai.
                    3. Practice and Backtesting:
                      • Naye indicators ka istemal karne se pehle demo trading ya backtesting ke through practice karein.


                    RCI ek powerful tool ho sakta hai agar ise sahi taur par interpret kiya jaye aur doosre technical factors ke sath combine kiya jaye. Hamesha yaad rahe ki kisi bhi trading decision se pehle market conditions aur risk tolerance ka dhyan rakha jana chahiye.
                    • #11 Collapse

                      Regression Channel index at trading Chart.


                      Click image for larger version

Name:	download (36).jpeg
Views:	41
Size:	17.1 کلوبائٹ
ID:	12825673
                      Regression Channel Index (RCI) Trading Chart:

                      Regression Channel Index (RCI) ek technical indicator hai jo traders ko market trends aur momentum ko analyze karne mein madad deta hai. Ye indicator trading charts par istemal kiya jata hai taake traders market direction aur potential reversals ka pata laga sakein. Is article mein, hum Regression Channel Index ke baray mein roman Urdu mein 800 words mein tafseel se baat karenge.

                      Regression Channel Index (RCI) Kya Hai?

                      Regression Channel Index (RCI) ek volatility-based technical indicator hai jo price trends aur momentum ko measure karta hai. Ye indicator traders ko market ke up aur down trends ko detect karne mein madad deta hai. RCI ka istemal mostly short-term trading mein hota hai, jahan traders market ke chhotay movements ko analyze karte hain.

                      RCI Kaise Kaam Karta Hai?

                      RCI ko calculate karne ke liye, pehle ek regression channel create kiya jata hai. Ye channel price ke around ek regression line ko shamil karta hai jo past data ke base par fit kiya jata hai. Phir, price ke current position ko is regression line ke respect mein measure kiya jata hai. RCI ki value is regression channel ke andar ya uske bahar hone par generate hoti hai. Agar RCI positive hai, toh ye indicate karta hai ke price regression line ke upar hai, jabke negative RCI regression line ke neeche indicate karta hai.

                      RCI Ka Istemal Trading Charts Mein

                      RCI trading charts mein istemal karne ke liye, traders ko pehle ek suitable time frame choose karna hota hai. Phir, regression channel ko plot kiya jata hai jis se RCI calculate hota hai. RCI ke readings price movements ke momentum ko indicate karte hain. Positive RCI uptrend ya price increase ke signals provide karta hai jabke negative RCI downtrend ya price decrease ke signals deta hai.

                      RCI Ka Istemal Trading Strategies Mein

                      RCI ka istemal multiple trading strategies mein kiya ja sakta hai. Kuch common strategies neeche diye gaye hain:
                      1. Overbought/Oversold Conditions: Agar RCI ki value extreme levels par hai, jaise ke +100 ya -100, toh ye indicate karta hai ke market overbought ya oversold ho sakta hai. Overbought conditions mein traders selling aur reversals ka wait karte hain jabke oversold conditions mein buying opportunities dekhte hain.
                      2. Divergence Trading: RCI aur price ke darmiyan koi divergence hone par, jaise ke price higher highs banata hai aur RCI lower highs banata hai ya phir price lower lows banata hai aur RCI higher lows banata hai, toh ye divergence trading opportunities indicate karta hai.
                      3. RCI Crossovers: Jab RCI regression line ko cross karta hai, yani positive se negative ya negative se positive, toh ye trend reversal signals provide karta hai. Traders in crossovers ko entry aur exit points ke taur par istemal karte hain.
                      4. Confirmation with Other Indicators: RCI ko doosre technical indicators ke saath combine kar ke bhi istemal kiya ja sakta hai, jaise ke Moving Averages ya MACD. Ye confirmation provide karta hai aur trading signals ko validate karta hai.

                      RCI Ke Benefits Aur Limitations

                      Benefits:
                      1. Price Trends Ko Detect Karna: RCI ke istemal se traders price trends aur momentum ko detect kar sakte hain.
                      2. Short-Term Trading Mein Madad: RCI short-term trading mein useful hai jahan traders chhotay price movements ko analyze karte hain.
                      3. Divergence Aur Reversal Signals: RCI divergence aur reversal signals provide karta hai jo trading opportunities create karte hain.

                      Limitations:
                      1. Lagging Indicator: RCI lagging indicator hai, is liye kuch der se market changes ko reflect karta hai.
                      2. False Signals: Kabhi kabhi RCI false signals generate kar sakta hai, is liye confirmation ke liye doosre indicators ki zaroorat hoti hai.
                      3. Market Conditions: RCI ke readings market conditions aur volatility ke hisaab se vary kar sakte hain, is liye iska istemal cautious taur par karna chahiye.

                      Conclusion

                      Regression Channel Index (RCI) ek valuable technical indicator hai jo traders ko market trends aur momentum ke baray mein information provide karta hai. Ye indicator short-term trading mein useful hai aur divergences aur reversals ko detect karne mein madad karta hai. Traders ko RCI ke istemal mein caution aur proper risk management maintain karna chahiye taake accurate trading decisions liya ja sakein.


                      • #12 Collapse

                        Trading chart par Regression Channel Index (RCI) ek ahem technical indicator hai jo market ke trends aur price movements ko analyze karne mein madad karta hai. Ye indicator volatility aur price changes ko measure karta hai aur traders ko potential trading opportunities ka pata lagane mein madad deta hai


                        RCI ek regression channel ke andar hota hai jo market ke current price ko historical price data ke sath compare karta hai. Iska matlab hai ke ye indicator market ke momentum ko darust karta hai aur trend ke direction ko samajhne mein madad karta hai. RCI ke calculation mein price ka variance aur regression analysis ka istemal hota hai


                        Ek mukhtalif tareeqa jis se RCI istemal hota hai wo ye hai ke ye overbought aur oversold levels ko determine karta hai. Jab RCI ek specific threshold ko cross karta hai, ye ek overbought ya oversold market condition indicate karta hai, jis se traders ko potential reversals ya price corrections ka pata lag jata hai


                        Iske alawa, RCI ek dynamic indicator hai jo market ke har waqt ke liye relevant hota hai. Ye traders ko current market conditions ke hisab se trading decisions lene mein madad deta hai aur unhe market ki dynamics ko samajhne mein madadgar sabit hota hai


                        Click image for larger version

Name:	images (1).png
Views:	51
Size:	22.6 کلوبائٹ
ID:	12826217

                        RCI ka istemal karne se pehle, traders ko iski characteristics aur limitations ko samajhna zaroori hai. Ye indicator sirf ek tool hai jo traders ko assist karta hai, lekin isay asli trading decisions ke liye zaroori factors ke saath combine karna zaroori hai. Isi tarah, traders ko RCI ke signals ko confirm karne ke liye doosri technical analysis tools aur price action patterns ka bhi istemal karna chahiye. In conclusion, Regression Channel Index (RCI) ek ahem technical indicator hai jo trading charts par istemal hota hai. Ye market ke trends aur volatility ko analyze karne mein madadgar hota hai aur traders ko potential trading opportunities ka pata lagane mein madad deta hai. Lekin, iski sahi samajh aur istemal ke liye traders ko iski calculation aur characteristics ko samajhna zaroori hai. Isi tarah, RCI ke signals ko confirm karne ke liye doosri technical analysis tools ka bhi saath lena zaroori hai


                        The heart has reasons that reason does not understand."
                        • #13 Collapse


                          Trading charts are essential tools for investors and traders to analyze market movements and make informed decisions. Among the many indicators used in technical analysis, the Regression Channel Index (RCI) stands out as a valuable tool for assessing the strength and direction of a trend. In this article, we will explore the concept of RCI, its calculation method, interpretation, and practical applications in trading.

                          Understanding RCI:

                          The Regression Channel Index (RCI) is a momentum oscillator that helps traders identify overbought and oversold conditions within a trading range. It is based on the concept of linear regression, which is a statistical method used to model the relationship between a dependent variable and one or more independent variables. In the context of trading, RCI utilizes linear regression to calculate the deviation of closing prices from the trend line.

                          Calculation Method:

                          The calculation of RCI involves several steps:
                          1. Determine the Regression Channel: Begin by plotting a linear regression trend line based on the closing prices over a specified period, typically 14 periods.
                          2. Calculate the Deviation: For each closing price, calculate the deviation from the regression line.
                          3. Calculate the Average Deviation: Find the average of the absolute deviations calculated in step 2.
                          4. Calculate RCI: Finally, divide the current deviation by the average deviation and multiply by 100 to obtain the RCI value.

                          Interpretation:

                          The RCI oscillates around a center line, typically set at zero. Traders use RCI to identify overbought and oversold conditions:
                          • Overbought: When RCI crosses above a certain threshold (e.g., +70), it indicates that prices have deviated significantly above the regression line, suggesting that the asset may be overbought.
                          • Oversold: Conversely, when RCI crosses below a certain threshold (e.g., -70), it suggests that prices have deviated significantly below the regression line, indicating that the asset may be oversold.

                          Traders often look for divergence between RCI and price movements to identify potential trend reversals or continuations.

                          Practical Applications:

                          RCI can be applied in various trading strategies:
                          1. Trend Confirmation: Traders use RCI to confirm the strength of an existing trend. A rising RCI in an uptrend or a falling RCI in a downtrend suggests that the trend is intact.
                          2. Overbought/Oversold Conditions: RCI helps traders identify potential reversal points when an asset becomes overbought or oversold. This information can be used to time entry or exit points more effectively.
                          3. Divergence Trading: Divergence between RCI and price movements can signal potential trend reversals. Traders look for instances where RCI forms higher highs or lower lows while prices move in the opposite direction, indicating a weakening trend.

                          Key Notes:
                          • RCI is a momentum oscillator based on linear regression.
                          • Calculation involves deviation from a regression trend line.
                          • RCI oscillates around a center line, typically zero.
                          • Overbought and oversold conditions are identified by threshold levels.
                          • RCI can be used to confirm trends, identify reversal points, and trade divergences.
                          In conclusion, the Regression Channel Index (RCI) is a valuable tool for traders seeking to assess market momentum and identify potential trading opportunities. By understanding how to calculate and interpret RCI values, traders can gain insights into market dynamics and make more informed trading decisions.
                          Click image for larger version

Name:	splash-484487.png
Views:	27
Size:	22.2 کلوبائٹ
ID:	12826279
                          • #14 Collapse

                            Details about the Regression Channel index at trading Chart.​​​

                            Aslam o alikum friends Regression Channel Index (RCI) ek technical indicator hai jo price action ka trend aur volatility ko measure karta hai. Ye indicator typically ek regression channel ke andar plot hota hai aur traders ko overbought ya oversold conditions identify karne mein madad karta hai. Chaliye samajhte hain kaise RCI trading chart par istemal kiya ja sakta hai:


                            Indicator Introduction:
                            Regression Channel Index (RCI) ek oscillating indicator hai jo price ka trend aur volatility ko evaluate karta hai. Ye indicator typically ek centered oscillator ke roop mein plot hota hai.

                            Calculation:
                            RCI ka calculation price ke regression channel ke andar hota hai. Ye channel typically price ke linear regression trend line ke upper aur lower boundaries ko define karta hai. RCI ka formula price ko regression channel ke upper aur lower boundaries ke beech mein measure karta hai aur ek oscillating value generate karta hai.

                            Overbought and Oversold Conditions:
                            RCI typically overbought (jab RCI bahut upar jaata hai) aur oversold (jab RCI bahut neeche jaata hai) conditions ko identify karta hai. Overbought conditions mein, market ko sell karne ki sambhavna hoti hai, jabki oversold conditions mein, market ko buy karne ki sambhavna hoti hai.

                            Trading Signals:
                            RCI ke overbought aur oversold levels ko use karke traders trading signals generate kar sakte hain. Jab RCI overbought zone se neeche aata hai, to yeh ek sell signal ho sakta hai. Ulta, jab RCI oversold zone se upar jaata hai, to yeh ek buy signal ho sakta hai.

                            Confirmation with Other Indicators:
                            Traders RCI ko doosre technical indicators ke saath combine karke apne trading signals ko confirm kar sakte hain. Maslan, RCI ke buy signal ko MACD ya RSI ke bullish crossover ke saath confirm kiya ja sakta hai.

                            Trend Analysis:
                            RCI ke istemal se traders trend analysis bhi kar sakte hain. Jab RCI trend line ke saath align hota hai, to yeh trend ke continuation ko darust karta hai. Agar RCI trend line ke khilaaf move karta hai, to yeh trend reversal ki possibility ko darust karta hai.

                            Risk Management:
                            RCI ka istemal karke traders apne risk management ko bhi improve kar sakte hain. Overbought aur oversold levels ko samajh kar, traders apne stop-loss aur take-profit levels ko set kar sakte hain taake unki trading positions ko manage kiya ja sake.


                            Backtesting and Optimization:
                            Traders ko RCI ko apne trading strategy ke saath backtest karna chahiye aur use optimize karna chahiye taake sahi aur consistent results mil sakein.

                            Dosto ye RCI ek powerful technical indicator hai jo traders ko trend direction aur market volatility ke baare mein valuable insights pradaan karta hai, jo ki unhe trading decisions lene mein madad karta hai.
                            • <a href="https://www.instaforex.org/ru/?x=ruforum">InstaForex</a>
                            • #15 Collapse

                              **Long Wick Pattern Kya Hai?**
                              Long wick pattern ek significant candlestick pattern hai jo price charts par market ke potential reversals aur trend changes ko indicate karta hai. Yeh pattern candlestick analysis ka ek important hissa hai aur traders ko market ki volatility aur sentiment ko samajhne mein madad karta hai. Is post mein, hum long wick pattern ki definition, formation, significance, aur trading strategies ko detail mein discuss karenge.

                              ### Long Wick Pattern Kya Hai?

                              Long wick pattern ek aisa candlestick pattern hai jismein candlestick ki body chhoti hoti hai aur wick (shadow) lambi hoti hai. Iska matlab hai ke price ne session ke doran ek high aur low reach kiya, lekin closing price is range ke bahar nahi gayi. Yeh pattern market ki volatility aur potential reversal points ko indicate karta hai.

                              ### Pattern Ki Formation

                              1. **Long Wick Candlestick:**
                              - **Upper Long Wick:** Jab candlestick ki upper wick lambi hoti hai aur body chhoti hoti hai, toh yeh potential bearish reversal signal de sakti hai. Yeh pattern market ke overbought condition ko indicate karta hai jahan buyers ne high prices par position banayi, lekin ultimately price neeche aayi.
                              - **Lower Long Wick:** Jab candlestick ki lower wick lambi hoti hai aur body chhoti hoti hai, toh yeh potential bullish reversal signal de sakti hai. Yeh pattern market ke oversold condition ko indicate karta hai jahan sellers ne low prices par position banayi, lekin ultimately price upar aayi.

                              2. **Pattern Ki Characteristics:**
                              - **High Volatility:** Long wick pattern high volatility aur price fluctuations ko reflect karta hai. Yeh pattern market ke sentiment aur price action ke extreme movements ko depict karta hai.
                              - **Reversal Signal:** Yeh pattern trend reversal ke potential signals ko highlight karta hai. Agar pattern existing trend ke end ke baad form hota hai, toh yeh reversal ke indication ke taur par dekha jata hai.

                              ### Pattern Ki Significance

                              1. **Trend Reversal Indication:**
                              - Long wick pattern existing trend ke reversal ka signal de sakta hai. Upper long wick bearish reversal aur lower long wick bullish reversal ka indication ho sakti hai.

                              2. **Market Sentiment:**
                              - Yeh pattern market ke sentiment aur trader psychology ko reflect karta hai. Long wick pattern ke saath, market me uncertainty aur potential change in direction ko highlight kiya jata hai.

                              3. **Volatility Measurement:**
                              - Long wick pattern market ki volatility ko measure karta hai. Yeh pattern high volatility aur potential trend changes ko signal karta hai, jo trading decisions ko influence karta hai.

                              ### Trading Strategy Using Long Wick Pattern

                              1. **Entry Points:**
                              - **Buy Signal:** Agar lower long wick pattern dekhne ko milta hai aur price upward movement show karti hai, toh yeh buying opportunity ho sakti hai. Traders is signal ke basis par buy position open kar sakte hain.
                              - **Sell Signal:** Agar upper long wick pattern dekhne ko milta hai aur price downward movement show karti hai, toh yeh selling opportunity ho sakti hai. Traders is signal ke basis par sell position open kar sakte hain.

                              2. **Stop Loss Aur Take Profit:**
                              - Stop loss ko recent high ya low ke paas set kiya jata hai. Take profit levels ko pattern ke reversal points aur market ke key levels ke basis par define kiya jata hai.

                              3. **Volume Analysis:**
                              - Volume analysis bhi long wick pattern ke trading strategy mein important hoti hai. High volume movements pattern ke validity ko confirm karti hain aur trading signals ko strengthen karti hain.

                              ### Example

                              Agar aapko forex chart par long wick pattern dekhne ko milta hai jahan upper wick lambi hoti hai aur closing price lower level par hoti hai, toh yeh bearish reversal signal ho sakta hai. Is situation mein, aap sell position open kar sakte hain aur stop loss ko recent high ke paas set kar sakte hain.

                              ### Conclusion

                              Long wick pattern ek useful candlestick pattern hai jo market ke potential reversals aur trend changes ko identify karta hai. Is pattern ki accurate identification aur trading strategies ko samajhkar, traders market trends aur price movements ko effectively analyze kar sakte hain. Effective use of long wick pattern can enhance trading decisions aur overall trading performance ko improve kar sakta hai.

                              اب آن لائن

                              Working...
                              X