Shaven Bottom Candlestick pattern:
Definition of Shaven Bottom Candlestick Pattern:
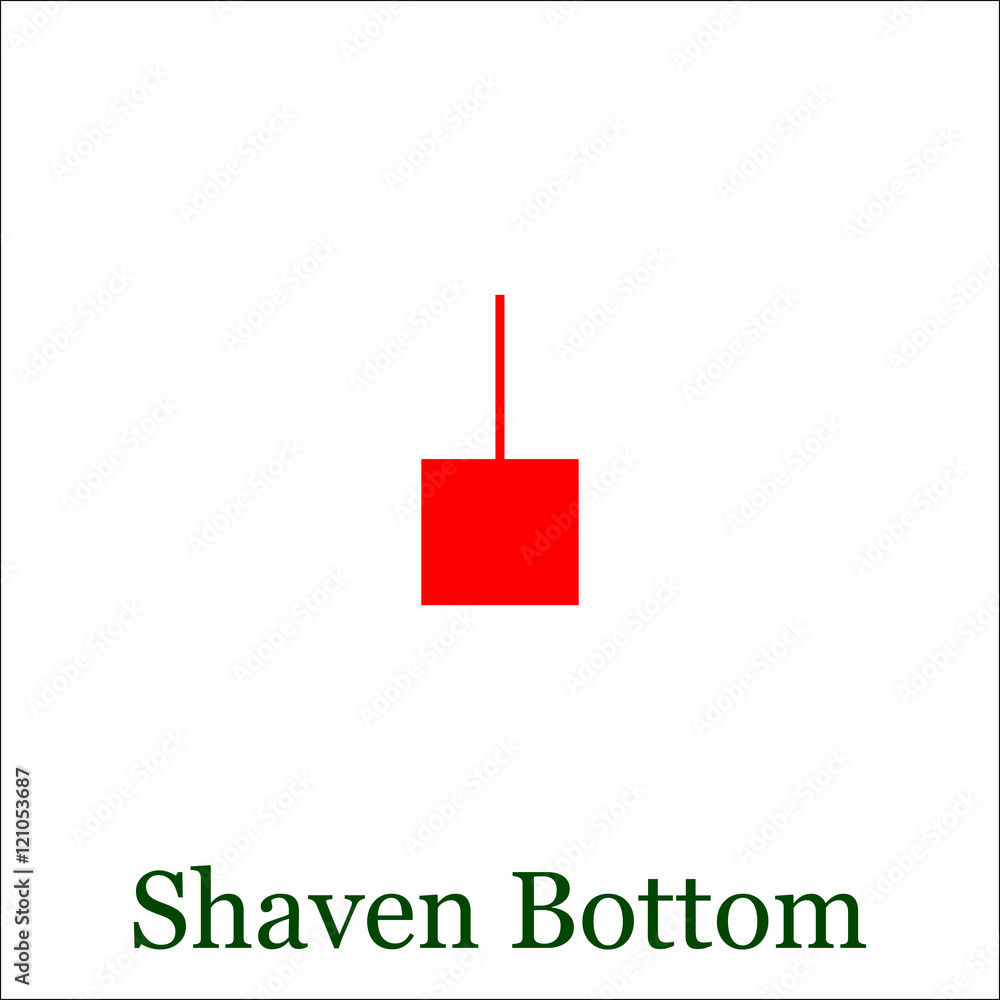
Assalam o Alaikum Dear friends and Forex fellows aj bat ho gi Shaven Bottom Candlestick Pattern pe to friends Shaven bottom candlestick pattern ek bullish reversal pattern hy jo ke downtrend ke bad ata hy. Is pattern ka pehchanne ka tareeqa ye hy ke ek single candlestick, jise shaven bottom kehte hein, bearish trend ke bad akar market me change lane ki koshish karta hy. Is pattern me candle ki lower shadow yani ke neeche wala hissa bilkul nazar nahi ata, jisse yeh shaven bottom kahlaya jata hy
Dear forex trading fellows Shaven Bottom Candlestick pattern ek technical analysis concept hy jo Forex trading me istemal hota hy.Ye pattern market me bearish reversal ko durust karnay ke liye istemal hota hy. Ye pattern traders ko batata hy ke market me bearish pressure barh rahi hy aur bullish trend khatam ho sakta hy. Is se traders apni trading decisions me madad hasil karty hein.
Example:
Friends suppose kay ap kisi currency pair ka candlestick chart deikh rahe hein or ap Dekhty hein kay market me downtrend chal raha hy aur achanak ek shaven bottom Candlestick nazar ata hy toh yeh bullish momentum ka ishara deta hy. Aglay period me agar doosri ek bullish candle confirm kare toh is waqat ek trader long position me enter karny ka faisla kar sakta hy. Stop-loss ko Shaved bottom Candlestick ki low ke neeche rakhte hue.
Identification of Shaven Bottom Candlestick pattern:
Dear my friends Shaven Bottom candlestick pattern ko identify karny ke liye, ap candlestick charts ka istemal kar sakte hein. Is pattern me apko aik candlestick ki bottom waly area par dehan dena hy. Agar us area par koi shadow ya wick nahi hy, sirf solid body hy, toh woh shaven bottom pattern hy. Is pattern ki identification ke liye apko candlestick charts par focus rakhna hoga aur candlestick pattern ko samajhna hoga.
Benefits and losses of Shaven Bottom Candlestick Pattern:
Is pattern ka istemal karke traders apne trades ko sahi waqt par enter aur exit karny me madad le sakte hein. Agar shaven bottom pattern ke sath doosre indicators bhi confirmatory signals de rahe hein toh iska asar aur bhi zyada hota hy. Lekin, hamesha yad rahe ke market me koi bhi pattern ya indicator 100% sahi nahi hota, is liye risk management ka bhi khayal rakhna zaroori hy.
Definition of Shaven Bottom Candlestick Pattern:
Assalam o Alaikum Dear friends and Forex fellows aj bat ho gi Shaven Bottom Candlestick Pattern pe to friends Shaven bottom candlestick pattern ek bullish reversal pattern hy jo ke downtrend ke bad ata hy. Is pattern ka pehchanne ka tareeqa ye hy ke ek single candlestick, jise shaven bottom kehte hein, bearish trend ke bad akar market me change lane ki koshish karta hy. Is pattern me candle ki lower shadow yani ke neeche wala hissa bilkul nazar nahi ata, jisse yeh shaven bottom kahlaya jata hy
Dear forex trading fellows Shaven Bottom Candlestick pattern ek technical analysis concept hy jo Forex trading me istemal hota hy.Ye pattern market me bearish reversal ko durust karnay ke liye istemal hota hy. Ye pattern traders ko batata hy ke market me bearish pressure barh rahi hy aur bullish trend khatam ho sakta hy. Is se traders apni trading decisions me madad hasil karty hein.
Example:
Friends suppose kay ap kisi currency pair ka candlestick chart deikh rahe hein or ap Dekhty hein kay market me downtrend chal raha hy aur achanak ek shaven bottom Candlestick nazar ata hy toh yeh bullish momentum ka ishara deta hy. Aglay period me agar doosri ek bullish candle confirm kare toh is waqat ek trader long position me enter karny ka faisla kar sakta hy. Stop-loss ko Shaved bottom Candlestick ki low ke neeche rakhte hue.
Identification of Shaven Bottom Candlestick pattern:
Dear my friends Shaven Bottom candlestick pattern ko identify karny ke liye, ap candlestick charts ka istemal kar sakte hein. Is pattern me apko aik candlestick ki bottom waly area par dehan dena hy. Agar us area par koi shadow ya wick nahi hy, sirf solid body hy, toh woh shaven bottom pattern hy. Is pattern ki identification ke liye apko candlestick charts par focus rakhna hoga aur candlestick pattern ko samajhna hoga.
Benefits and losses of Shaven Bottom Candlestick Pattern:
Is pattern ka istemal karke traders apne trades ko sahi waqt par enter aur exit karny me madad le sakte hein. Agar shaven bottom pattern ke sath doosre indicators bhi confirmatory signals de rahe hein toh iska asar aur bhi zyada hota hy. Lekin, hamesha yad rahe ke market me koi bhi pattern ya indicator 100% sahi nahi hota, is liye risk management ka bhi khayal rakhna zaroori hy.


تبصرہ
Расширенный режим Обычный режим