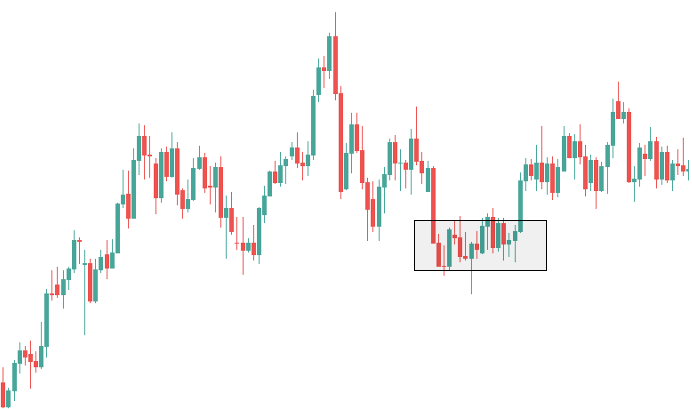
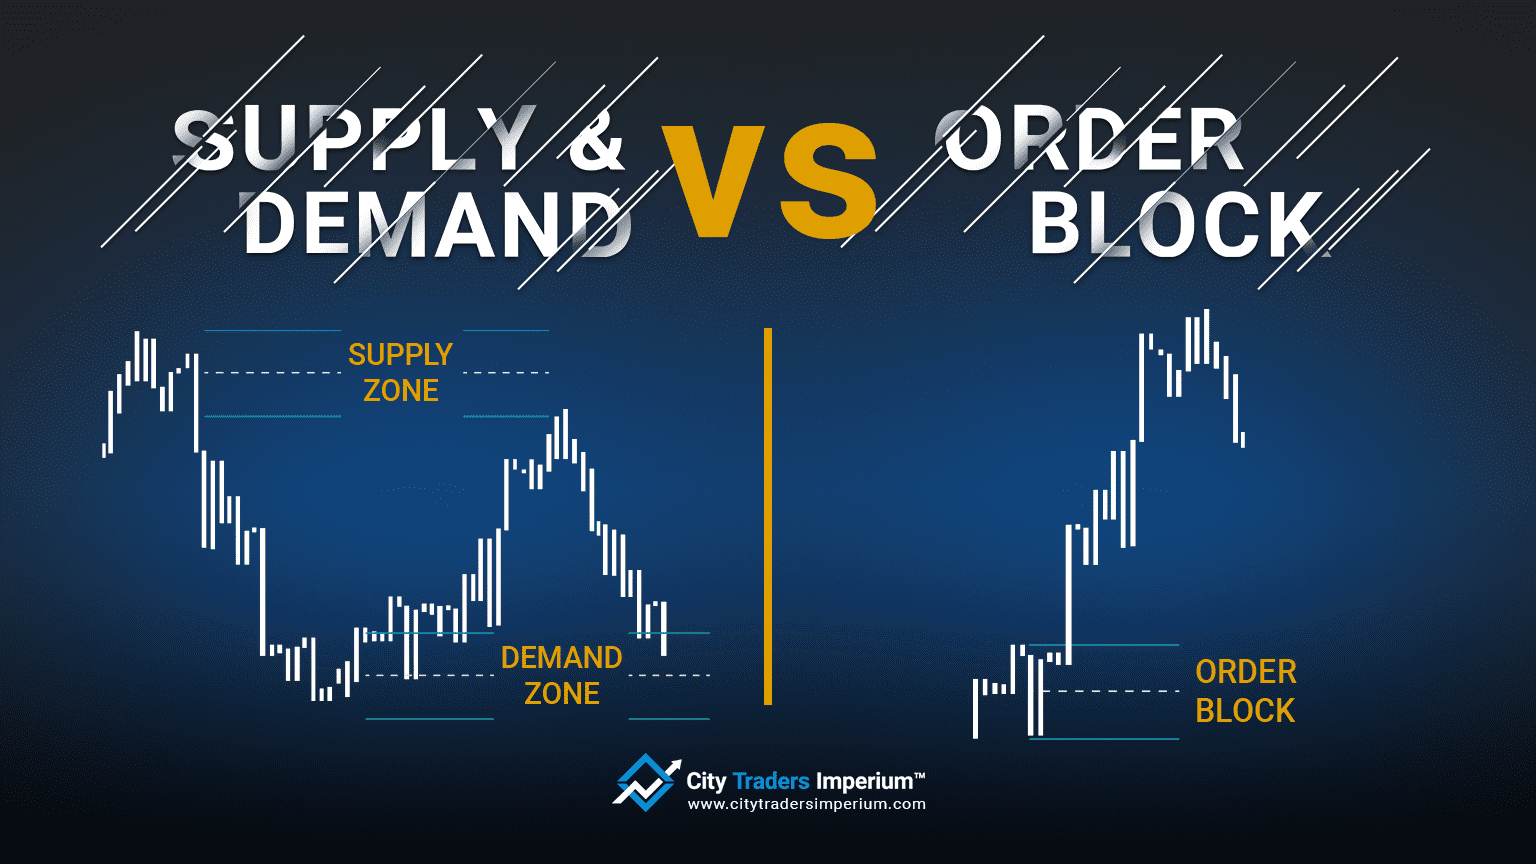
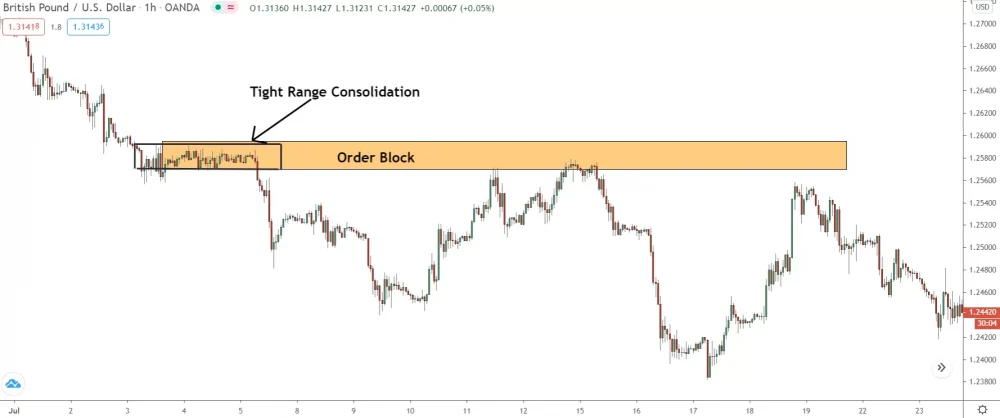
Forex mein, acha block aik bara trade order ko refer karta hai jo market mein maamooli volume se zyada hota hai. Ye orders aam taur par arsay mein execute hotay hain, foran execute hone ke bajaye, taake market mein asar kam ho aur ziada price movements se bacha ja sake.
Acha block wo bara trade order hai jo aik khaas threshold volume se zyada hota hai. Threshold volume broker se broker tak mukhtalif hoti hai, lekin aam taur par ye kuch million dollars hoti hai. Ye orders arsay mein execute hote hain, foran execute hone ke bajaye, taake market mein asar kam ho aur ziada price movements se bacha ja sake.

Acha blocks request for quote ke zariye execute hote hain, jisme aik bank ya brokerage firm multiple liquidity providers ko price quote ke liye request bhejti hai. Liquidity providers phir apne behtareen prices ke sath jawab dete hain, jo bank ya brokerage firm ko unke trade ke liye behtareen price choose karne mein madad karta hai. Ye process ye ensure karti hai ke trade fair price par execute ho, time ke market conditions ke bajaye.
Acha Block ki Ahmiyat Forex Mein
Acha block Forex mein ahmiyat rakhte hain kyun ke ye market mein total trading volume ka bara hissa represent karte hain. Bank for International Settlements (BIS) ki ek report ke mutabiq, acha blocks Forex market ke daily trading volume ka kuch 20% hissa hote hain. Iska matlab hai ke agar ye orders ek sath execute ho jaen to ye market prices par asar daal sakte hain.
Ziada price movements se bachne ke liye, acha blocks arsay mein execute hote hain, foran execute hone ke bajaye. Ye process 'slow execution' ya 'slow trading' kehlati hai. Slow execution bank ya brokerage firm ko ye allow karta hai ke wo trade arsay mein execute karein, ek sath nahi, jisse market impact kam ho aur ziada price movements se bacha ja sake.
Slow execution Forex market mein khaas tor par ahmiyat rakhti hai kyun ke ye aik decentralized market hai jisme koi central clearinghouse nahi hota. Iska matlab hai ke trades seedhe parties ke darmiyan execute hoti hain, central clearinghouse ke zariye nahi. Is centralization ki kami se bade orders ko execute karna market prices par ziada asar daalne wala ho sakta hai.
Acha Blocks Market Prices Par Asar Kaise Daalte Hain
Acha blocks market prices par kai tareeqon se asar daal sakte hain. Pehle to, trade order ki size agar ek sath execute ho, to ye ziada price movements ko cause kar sakta hai, jo 'market impact' kehlata hai. Market impact tab hota hai jab aik bada order currency pair ki keemat ko us order ki size ke jawab mein hilata hai.
Market impact se bachne ke liye, acha blocks arsay mein execute hote hain, foran execute hone ke bajaye. Ye slow execution market impact ko kam karne mein madad karta hai aur ziada price movements se bachata hai. Lekin slow execution aik ziada spread ka bhi sabab ho sakta hai, kyun ke bank ya brokerage firm ko trade ko arsay mein execute karne ke liye ziada price dene ki zarurat ho sakti hai.
Dusre taur par, acha blocks market prices par asar daal sakte hain liquidity provide karke. Baray trade orders market ko liquidity provide kar sakte hain, khaas kar low liquidity ke doran, kyun ke ye market mein excess supply ya demand ko absorb karne mein madad kar sakte hain. Ye market prices ko stable rakhne mein madad karta hai aur ziada price movements se bachata hai.
Teesre taur par, acha blocks market prices par asar daal sakte hain market ko information provide karke. Baray trade orders market ko bank ya brokerage firm ke irade ke baare mein information provide kar sakte hain, khaas kar agar trade kisi khaas currency pair mein execute ho. Ye information market participants ko currency pair ke asli fundamentals ke baare mein inform kar sakti hai, jo market prices par asar daal sakti hai.
Acha block wo bara trade order hai jo aik khaas threshold volume se zyada hota hai. Threshold volume broker se broker tak mukhtalif hoti hai, lekin aam taur par ye kuch million dollars hoti hai. Ye orders arsay mein execute hote hain, foran execute hone ke bajaye, taake market mein asar kam ho aur ziada price movements se bacha ja sake.

Acha blocks request for quote ke zariye execute hote hain, jisme aik bank ya brokerage firm multiple liquidity providers ko price quote ke liye request bhejti hai. Liquidity providers phir apne behtareen prices ke sath jawab dete hain, jo bank ya brokerage firm ko unke trade ke liye behtareen price choose karne mein madad karta hai. Ye process ye ensure karti hai ke trade fair price par execute ho, time ke market conditions ke bajaye.
Acha Block ki Ahmiyat Forex Mein
Acha block Forex mein ahmiyat rakhte hain kyun ke ye market mein total trading volume ka bara hissa represent karte hain. Bank for International Settlements (BIS) ki ek report ke mutabiq, acha blocks Forex market ke daily trading volume ka kuch 20% hissa hote hain. Iska matlab hai ke agar ye orders ek sath execute ho jaen to ye market prices par asar daal sakte hain.
Ziada price movements se bachne ke liye, acha blocks arsay mein execute hote hain, foran execute hone ke bajaye. Ye process 'slow execution' ya 'slow trading' kehlati hai. Slow execution bank ya brokerage firm ko ye allow karta hai ke wo trade arsay mein execute karein, ek sath nahi, jisse market impact kam ho aur ziada price movements se bacha ja sake.
Slow execution Forex market mein khaas tor par ahmiyat rakhti hai kyun ke ye aik decentralized market hai jisme koi central clearinghouse nahi hota. Iska matlab hai ke trades seedhe parties ke darmiyan execute hoti hain, central clearinghouse ke zariye nahi. Is centralization ki kami se bade orders ko execute karna market prices par ziada asar daalne wala ho sakta hai.
Acha Blocks Market Prices Par Asar Kaise Daalte Hain
Acha blocks market prices par kai tareeqon se asar daal sakte hain. Pehle to, trade order ki size agar ek sath execute ho, to ye ziada price movements ko cause kar sakta hai, jo 'market impact' kehlata hai. Market impact tab hota hai jab aik bada order currency pair ki keemat ko us order ki size ke jawab mein hilata hai.
Market impact se bachne ke liye, acha blocks arsay mein execute hote hain, foran execute hone ke bajaye. Ye slow execution market impact ko kam karne mein madad karta hai aur ziada price movements se bachata hai. Lekin slow execution aik ziada spread ka bhi sabab ho sakta hai, kyun ke bank ya brokerage firm ko trade ko arsay mein execute karne ke liye ziada price dene ki zarurat ho sakti hai.
Dusre taur par, acha blocks market prices par asar daal sakte hain liquidity provide karke. Baray trade orders market ko liquidity provide kar sakte hain, khaas kar low liquidity ke doran, kyun ke ye market mein excess supply ya demand ko absorb karne mein madad kar sakte hain. Ye market prices ko stable rakhne mein madad karta hai aur ziada price movements se bachata hai.
Teesre taur par, acha blocks market prices par asar daal sakte hain market ko information provide karke. Baray trade orders market ko bank ya brokerage firm ke irade ke baare mein information provide kar sakte hain, khaas kar agar trade kisi khaas currency pair mein execute ho. Ye information market participants ko currency pair ke asli fundamentals ke baare mein inform kar sakti hai, jo market prices par asar daal sakti hai.


تبصرہ
Расширенный режим Обычный режим