Tweezer Bottom Pattern

No announcement yet.
`
X
  • وقت
  • دکھائیں
Clear All
new posts
  • #1 Collapse

    Tweezer Bottom Pattern
    Assalam o alikum.!
    Umeed krta hun ap sub loog khariyat sy hungy or enjoy kr rahy hungy apni trading life ko dosto Tweezer Bottom ek technical analysis pattern hai jo market charts par dikhta hai. Ye pattern do candlesticks se bana hota hai jisme pehla candlestick downtrend ke baad aata hai aur doosra candlestick usi price level par ya uske nearby close hota hai. Ye pattern bullish reversal signal provide karta hai, indicating ke downtrend ke baad upmove shuru ho sakta hai.

    Click image for larger version  Name:	IMG_20240202_223829.jpg Views:	0 Size:	9.7 KB ID:	12820838
    Tweezer Bottom Pattern py trade kasy kryan
    Tweezer Bottom pattern par trade karna, chart pe pattern ko pehchan kar aur ek trading strategy implement karne ko involve karta hai. Yahan ek basic approach hai:
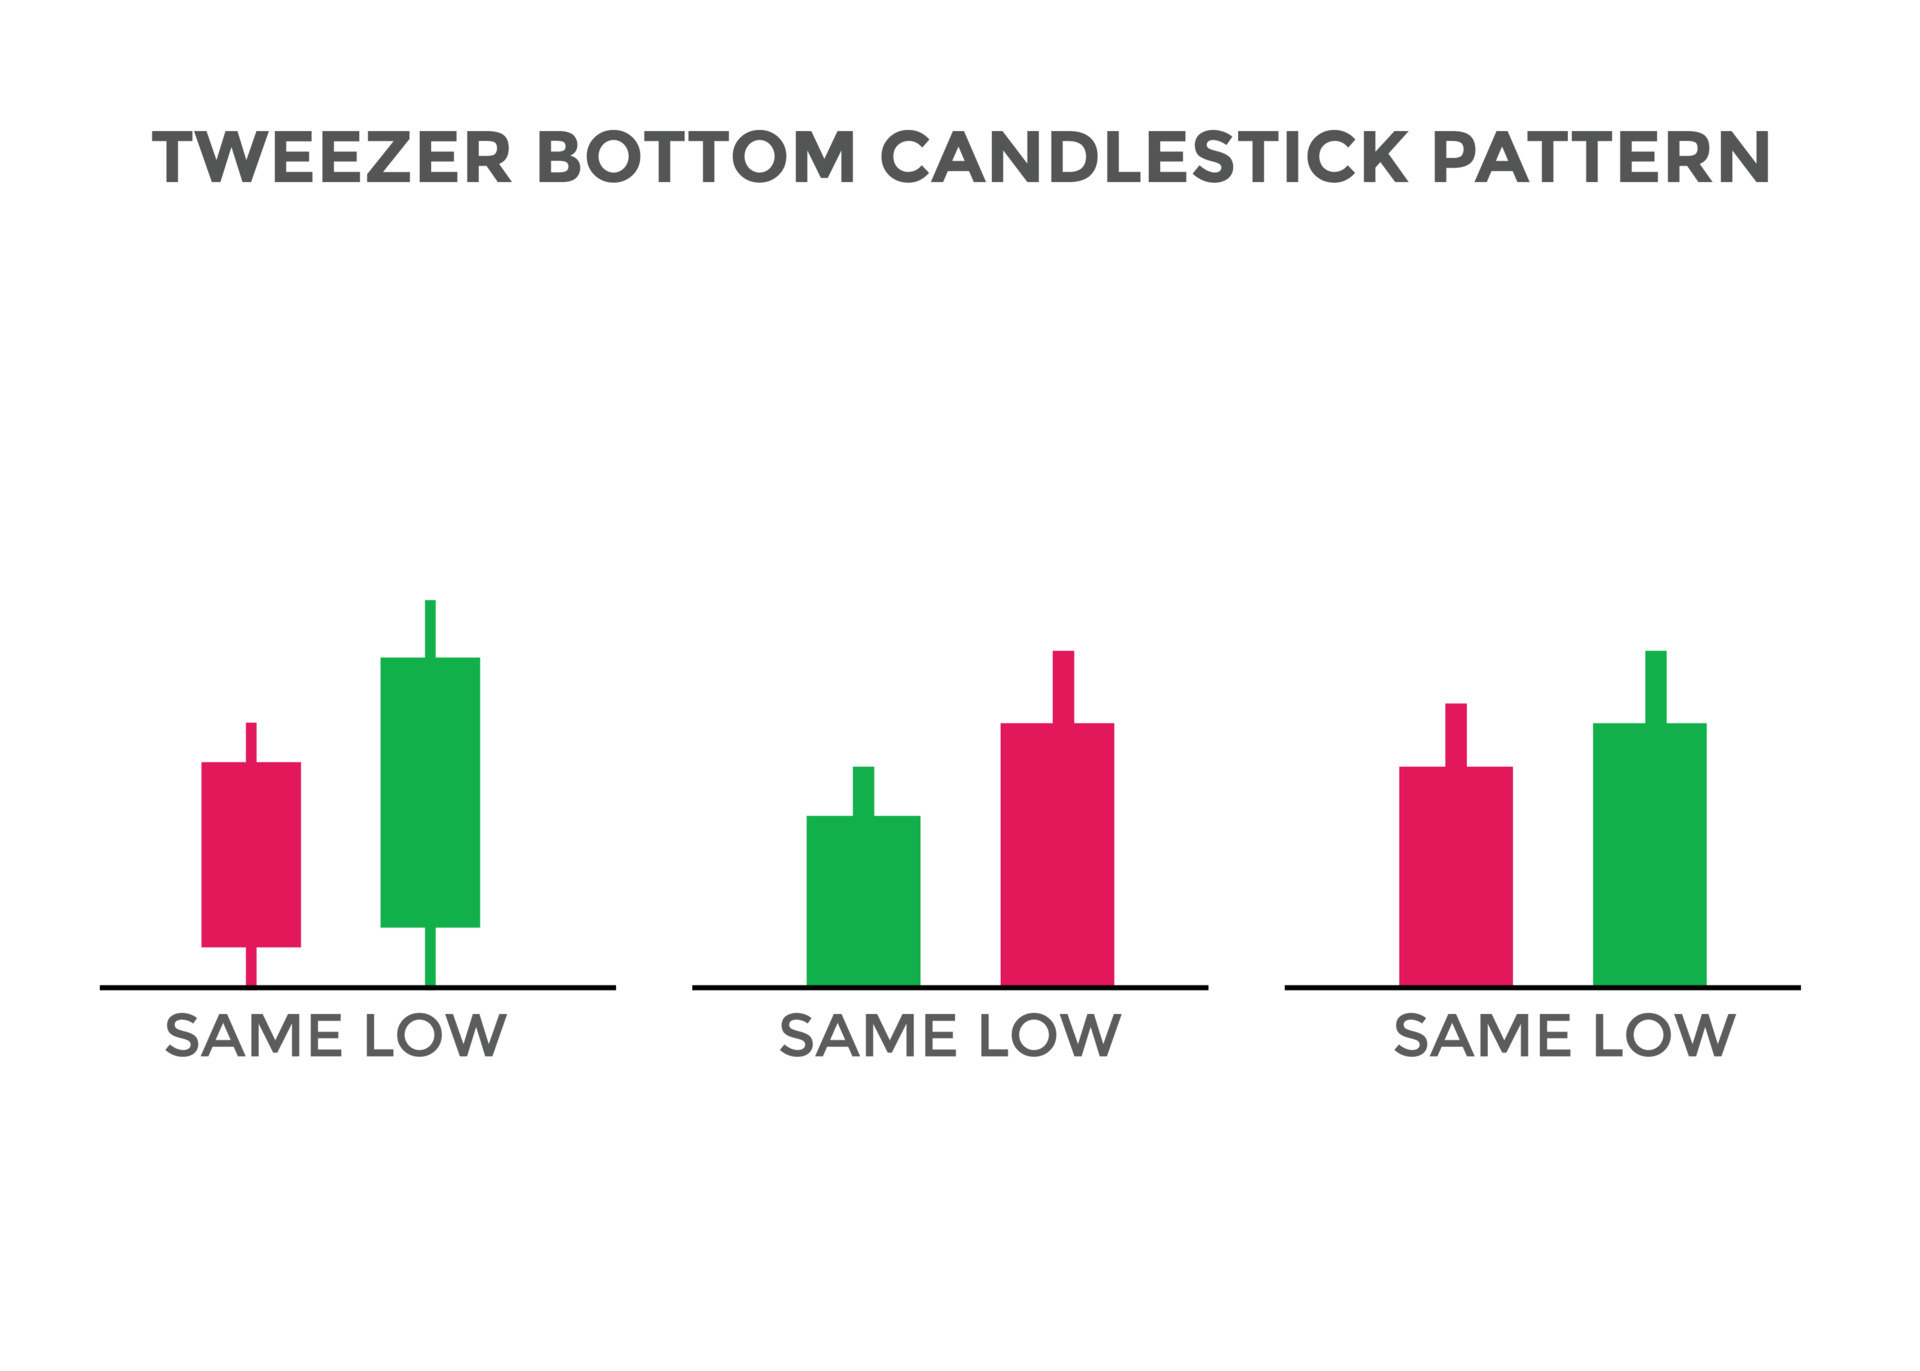
    1. Tweezer Bottom Pehchanen:
    Downtrend mein do candlesticks ko dhunden.
    Pehla candlestick bearish hota hai, aur doosra bullish hota hai, jo ek hi price level ke paas bottom banata hai.

    Click image for larger version

Name:	images (1).jpeg
Views:	83
Size:	45.4 کلوبائٹ
ID:	12820841
    2. Confirmation:
    Additional confirmation signals ka intezaar karen, jaise ki volume mein izafah ya doosre technical indicators jo potential reversal ke saath hain.

    3. Entry Point:
    Long (buy) position enter karen yaad rahe slightly above the high of the second bullish candlestick.

    4. Stop-Loss:
    Stop-loss order set karen, jo tweezer bottom pattern ke low ke neeche hota hai. Ye risk ko manage karne mein madad karta hai agar reversal nahi hota.

    5. Take Profit:
    Profits len ke liye ek target set karen. Ye risk-reward ratio ya key resistance levels par based ho sakta hai.

    6. Risk Management:
    Apne risk ko manage karne ke liye ek single trade par trading capital ka pehle se decide kiya gaya percentage se zyada risk na karen.

    Click image for larger version  Name:	images (1).png Views:	0 Size:	33.1 KB ID:	12820839
    Yaad rahe: koi bhi trading strategy foolproof nahi hoti, aur zaroori hai ke Tweezer Bottom pattern ko doosre forms of analysis aur risk management ke saath combine karen. Iske alawa, live trading mein kisi nayi strategy ko implement karne se pehle demo account par practice karen.
    Last edited by ; 02-02-2024, 10:45 PM.
  • <a href="https://www.instaforex.org/ru/?x=ruforum">InstaForex</a>
  • #2 Collapse

    Assalamu Alaikum Dosto!


    Tweezers Bottom Candlestick Pattern


    Tweezers bottom candlestick pattern two days candles par par mushtamil aik bullish trend reversal pattern hai, jo k prices k bottom par ya bearish trend k baad banta hai, ye pattern market main prices k mazzeed bearish na jane se rokne aur bullish trend reversal ka signal deta hai. Tweezers bottom candlestick pattern dekhne me same "Matching Low Candlestick Pattern" jaisa lagta hai, lekin tweezers bottom candlestick pattern main pehli candle bearish aur dosri bullish hona zarori hai. Tweezers bottom candlestick pattern k banne ki peche ki psychology kuch iss tarah se hoti hai, k jab bhi prices main pehli candle aik khas bearish point par close ho jati hai aur dosre din ki candle bullish banne k baad same pehli candle k low ko touch karne k baad upper par close hoti hai. Pattern ki dono candles k open aur close price aik dosre se opposite direction main hote hen.

    Candles Formation


    Tweezers bottom candlestick pattern main dono din k candles different format ya trend yanni bullish aur bearish trend ki candles hoti hai. Ye candles same support position ko touch karke wapis hoti hai, jiss se prices mazzeed bearish nahi jati. Tweezers bottom candlestick pattern main candles ki formation darjazzel tarah se hoti hai;

    Click image for larger version

Name:	images - 2023-03-02T215419.483.jpeg
Views:	89
Size:	29.3 کلوبائٹ
ID:	12820834
    1. First Candle: Tweezers bottom candlestick pattern main pehli candle aik strong real body main banti hai, ye candle color main black ya red yanni bearish hoti hai. Pehli bearish candle prices main bearish trend ki mazboti dekhati hai, jo k pattern k banne se pehle prices follow kar rahi hoti hai.
    2. Second Candle: Tweezers bottom candlestick pattern ki second day candle aik bullish trend ki candle hoti hai. Tweezers bottom candlestick pattern aur "Matching Low Candlestick pattern" dono dekhne main same lagte hen, lekin tweezer bottom pattern main dono candles ka bearish hona ya candles ka close point same honna zarori nahi hai. Jab k matching low pattern main candles ka low ya close price same pehli candle jaisa hota hai, jab k dosri candle pehli candle k close point main open hoti hai. Ye candle bhi aik strong real body wali candle hoti hai, jiss ka color black ya red hota hai.


    Explaination

    Tweezers bottom candlestick pattern aik munfared pattern hai, jiss main shamil candles aik dosre se mukhtalef formate ya trend yanni bullish aur bearish hoti hai. Pattern low price area ya bearish trend main banta hai, jiss ki pehli candle aik strong real body main banne wali bearish candle hoti hai. Dosre din ki candle aik bullish candle hoti hai, ye candle pehli candle k close point k baad open ho kar same low banane k bad ooper close hoti hai. Pattern ki pehli aur dosree candle ka low ya close price same hone ki waja se ye aik strong support level ban jata hai.

    Click image for larger version

Name:	images - 2023-03-02T215629.551.png
Views:	75
Size:	12.9 کلوبائٹ
ID:	12820835


    Trading

    Tweezers bottom candlestick pattern prices main double bottom pattern banati hai, yanni prices do dafa same price ya point se reject ho jati hai. Ye point prices k leye aik strong support level ka kaam karta hai, q k pattern ki dono candles same point se reject hoti hai, jo k bullish trend ki alamat hoti hai. Tweezers bottom candlestick pattern par trading karne k leye zarori hai, k prices bottom area ya bearish trend main hon. Dosra candlestick ki timeframe long term ki honni chaheye, jo kam az kam one-day se ziada ho. Tweezers bottom candlestick pattern par trading se pehle confirmation candle ka honna zarori hai, jo k aik real body wali bullish candle hoti hai. Tweezers bottom candlestick pattern k bad banne wali teesri bullish candle par buy ki entry karen, ye position ziada tez buying position sabi ho sakti hai. Tweezers bottom candlestick pattern par Stop Loss ka lagana zarori hai, q k reversal pattern ziada reliable nahi hotte hen. Stop loss pattern k sab se bottom position, jo k dono candles ka support level banta hai, se aik do pips below position par set karen.
    • #3 Collapse

      Dear friend, Tweezer Bottom Pattern ek technical analysis tool hai jo market mein bullish reversal signal ko represent karta hai. Is pattern ko pehchan kar traders ko maloom hota hai ke downtrend ke baad bullish movement shuru ho sakti hai, is pattern kay yeh characteristics hain,

      1. Tweezer Bottom candlestick pattern:

      Tweezer Bottom Pattern do candlesticks se mil kar banta hai, jis mein pehli candle bearish hoti hai, jab ke dusri candle bullish hoti hai. Dono candles ka low takreeban ek hi level par hota hai.

      2. Components of Tweezer Bottom:

      Is Pattern mein do mukhtalif components hote hain, pehli candle jo bearish hoti hai aur dusri candle jo bullish hoti hai. Dono candles ke low ka level same hota hai,

      Click image for larger version

Name:	images(53).jpg
Views:	90
Size:	10.9 کلوبائٹ
ID:	12820943

      3. Important Factors for identification:

      Is pattern ko pehchanne ke liye traders ko dhyan dena zaroori hai ke dono candles ke low almost same level par hona chahiye. Agar ye low alag alag hote hain, to pattern maqbul nahi hota,

      4. Significance of Bullish Reversal

      Tweezer Bottom Pattern ka significance yeh hai ke jab ye formation hoti hai, to is se ek potential bullish reversal ka signal milta hai. Traders is pattern ko dekhte hue expect karte hain ke market mein positive movement shuru ho sakti hai,

      5. Tweezer Bottom Aur Market Sentiment

      Tweezer Bottom Pattern market sentiment ka tabdeel hone ka ishara hota hai. Bearish trend ke baad jab ye pattern aata hai, to ye market mein buyers ki wapsi ko darust karta hai,

      6. Timeframe Ke Tawajju Aur Tweezer Bottom:

      Tweezer Bottom Pattern ko alag-alag time frames par dekha ja sakta hai. Short-term aur long-term traders dono is pattern ka istemal apne trading strategies mein kar sakte hain,

      7. Comparison with Other Reversal Patterns:

      Traders ko doosre reversal patterns ke sath Tweezer Bottom Pattern ko muqabla karna bhi zaroori hai. Iske mawafiq hone par yaqeeni ho kar hi traders ko is signal par amal karna chahiye,

      8. Tweezer Bottom Aur Risk Management

      Risk management ke liye Tweezer Bottom Pattern ka istemal bhi ahem hai. Stop-loss orders set karke aur position size ko control karke traders apne nuksanat ko kam kar sakte hain.

      • #4 Collapse

        Introduction

        Tweezer bottom candlestick pattern aik kesam ka chart pattern hota hey jo keh market kay trend ko bearish reversal janay ko indicate kar sakta hey
        دیتے جائیںThanksحوصلہ افزائی کے لیے
        • #5 Collapse

          Tweezer pattern

          Tweezer Bottom pattern forex trading mein aik ahem market indicator hai jo traders ko potential trend reversal ka ishara deta hai. Ye pattern, price chart par dikhne wale do closely spaced aur similar low points se mutasir hota hai. Jab ye pattern ban jata hai, toh ye traders ko samajhne mein madad karta hai ke market mein bearish trend se bullish trend ki taraf mawafiqat ho sakti hai.

          Tweezer Bottom ko samajhne ke liye, sab se pehle samajhna zaroori hai ke ye kis tarah ka hota hai. Jab market mein downward trend hota hai aur prices ghat rahi hain, toh tweezer bottom ek reversal pattern hai jo indicate karta hai ke market mein buyers ki shirkaat barh sakti hai aur bearish trend khatam ho sakta hai.


          Click image for larger version

Name:	images (19).jpeg
Views:	79
Size:	119.0 کلوبائٹ
ID:	12820987


          Is pattern mein do candlesticks involved hote hain. Pehla candlestick bearish hota hai, jo ke downward movement ko represent karta hai. Dusra candlestick, jo ke closely spaced hota hai pehle candlestick ke sath, bullish hota hai aur indicate karta hai ke buyers ne control haasil kia hai. Iski wajah se ye pattern do bottoms ki shape bana leta hai, jinhe tweezer bottom kehte hain.

          Tweezer Bottom ko confirm karne ke liye, traders ko dhyan dena chahiye ke dono candlesticks ki bodies aur shadows ki length similar ho. Agar pehla candlestick lamba hai, toh doosra bhi lamba hona chahiye, aur agar pehla candlestick chhota hai, toh doosra bhi chhota hona chahiye. Is consistency ko dekhte hue, traders tweezer bottom ko sahi tarah se identify kar sakte hain.

          Jab ye pattern form hota hai, toh ye traders ko ye samajhne mein madad karta hai ke market mein buyers ne control lena shuru kar dia hai. Iske baad, traders apni trading strategies ko adjust kar sakte hain aur potential long positions consider kar sakte hain. Lekin yaad rahe ke kisi bhi pattern ki tarah, tweezer bottom bhi 100% confirmatory indicator nahi hota aur market mein risks hamesha hote hain.


          Click image for larger version

Name:	Screen-Shot-2022-08-19-at-4.25.15-PM--1-.png
Views:	159
Size:	21.9 کلوبائٹ
ID:	12820986


          Tweezer Bottom ka istemal karte waqt, traders ko aur confirmatory indicators ka bhi istemal karna chahiye. Volume analysis, trendlines aur doosre technical indicators ki madad se, traders ye dekh sakte hain ke kya market mein actual reversal hone ke chances hain ya nahi. Iske ilawa, kisi bhi trade mein enter karne se pehle, stop-loss orders ka istemal karna bhi ahem hai taake traders apne positions ko protect kar sakein.

          In conclusion, tweezer bottom pattern forex trading mein ek ahem tool hai jo trend reversal ko indicate karta hai. Is pattern ki sahi tarah se tahlil karke, traders market mein hone wale potential changes ko samajh sakte hain aur apne trading strategies ko accordingly adjust kar sakte hain. Lekin, har pattern ki tarah, tweezer bottom ka istemal karte waqt bhi cautious rehna zaroori hai aur aur confirmatory indicators ka bhi istemal karna chahiye.
          Firangi.com ❣️
          • #6 Collapse


            Tweezer Bottom Pattern\


            Click image for larger version

Name:	download - 2024-02-03T094116.788.png
Views:	83
Size:	2.8 کلوبائٹ
ID:	12820989

            Tweezer Bottom Pattern:

            Tafseel:

            "Tweezer Bottom" ek technical analysis pattern hai jo ke financial markets mein istemal hota hai, khaas kar ke stocks ke price movements ko samajhne ke liye. Ye pattern ek reversal pattern hai, jo indicate karta hai ke bearish trend ke baad market mein buying interest badh rahi hai.

            Tweezer Bottom Pattern Kya Hai: Tweezer Bottom pattern, do candlesticks se banta hai. Yeh bearish trend ke baad market mein trend reversal ko darust karti hai. Is pattern mein do alag alag candlesticks shamil hote hain jo ek dusre ke neeche close hote hain. Pehla candlestick downtrend ko show karta hai aur doosra candlestick ise reverse karta hai.

            Tweezer Bottom Pattern Ki Pehchan:
            1. Pehla Candlestick (Bearish): Tweezer Bottom pattern ke shuruaati stage mein, ek bearish candle hoti hai jiska close neeche hota hai.
            2. Doosra Candlestick (Bullish): Dusre stage mein, ek bullish candle aati hai jiska open pehle candle ke close ke paas hota hai ya uske thode upar. Yeh candle bullish reversal ko represent karta hai.
            3. Volume Ka Tawun:
              • Agar is pattern ke sath high volume bhi ho, toh ye confirmation provide karta hai ke reversal strong ho sakta hai.

            Tweezer Bottom Pattern Ke Istemal Ka Tariqa:
            1. Confirmation: Tweezer Bottom pattern ka confirmation hona zaroori hai. Iske liye doosre technical indicators ka istemal bhi kiya jata hai.
            2. Stop Loss Aur Target Levels: Trading strategy banate waqt, stop loss aur target levels ko define karna important hai taki risk management ho sake.
            3. Dusre Indicators Ka Istemal: Trend lines, moving averages, ya doosre technical indicators ka istemal karna bhi madadgar ho sakta hai.

            Final Words: Tweezer Bottom pattern ek powerful reversal signal ho sakta hai, lekin iske saath aur confirmatory signals ka bhi dhyan rakhna zaroori hai. Market volatility aur risk ke beech samajhdaari se kaam karna important hai.
            • #7 Collapse

              (((Forex me Tweezer Bottom Pattern)))

              Tweezer Bottom, ek candlestick pattern hai jo Forex market mein price reversal ko indicate karne ke liye istemal hota hai. Ye pattern downtrend ke baad aata hai aur bullish reversal ko darust karne ka pata lagane mein madad karta hai.


              (((Forex me Tweezer Bottom Pattern Ki Tashkeel)))

              Tweezer Bottom pattern do alag-alag candlesticks se banta hai:
              1. Pehla Candlestick: Ye candlestick downtrend ke akhri phase mein hota hai aur bearish hota hai, yaani ki iska closing price neeche hota hai.
              2. Dusra Candlestick: Ye bhi downtrend ke akhri phase mein hota hai, lekin ye bullish candle hota hai. Iska opening price pehle candlestick ke closing price ke barabar ya usse neeche hota hai, aur fir iski price day ke end tak badh jati hai.
              Jab ye dono candlesticks ek dusre ke qarib hote hain aur unka combination banata hai, tab Tweezer Bottom pattern complete hota hai. Yeh indicate karta hai ki sellers ke control mein thodi si kamzori hai aur buyers apna dominance regain kar rahe hain.

              (((Forex me Tweezer Bottom Pattern Ke Ehem Points)))
              1. Candlestick Sizes: Tweezer Bottom pattern mein, dono candlesticks ki size important hoti hai. Ideally, dono candlesticks ka size ek dusre ke bohot qareeb hota hai, indicating a close battle between buyers and sellers.
              2. Volume Analysis: Volume analysis bhi ek crucial aspect hai. Agar Tweezer Bottom pattern ke sath high volume hai, toh ye indicate kar sakta hai ki market mein strong buying interest hai. Lekin, low volume ke sath ye pattern less reliable ho sakta hai.
              3. Confirmation Signals: Traders ko Tweezer Bottom pattern ko confirm karne ke liye aur bhi indicators ka istemal karna chahiye. Isme moving averages, RSI (Relative Strength Index), aur trend lines ka use kiya ja sakta hai.
              4. Market Context: Is pattern ko samajhne ke liye market context bhi dekha jana chahiye. Agar overall trend bullish hai, to Tweezer Bottom ka significance badh jata hai. Lekin, agar market mein strong downtrend hai, to is pattern ki reliability kam ho jati hai.
              5. Stop Loss and Take Profit Levels: Har trading strategy mein stop loss aur take profit levels ka tay karna zaroori hai. Ye levels aapko protect karte hain aur profit booking mein madad karte hain.
              6. Risk Management: Har trading decision ke saath saath risk management ka dhyan rakhna bahut zaroori hai. Kitna risk lena hai, kaise position size tay karna hai, ye sab factors dhyan mein rakhna important hai.
              • #8 Collapse

                Assalam O Alikum Dear friends I hope you will be happy and fine Today I want to tell you that about TWIZZER BOTTOM PATTERN

                INTRODUCTION OF TWIZZER BOTTOM PATTERN:


                Tweezer Bottom pattern forex trading mein aik ahem market indicator hai jo traders ko potential trend reversal ka ishara deta hai. Ye pattern price chart par dikhne wale do closely spaced aur similar low points se mutasir hota hai Jab ye pattern ban jata hai toh ye traders ko samajhne mein madad karta hai ke market mein bearish trend se bullish trend ki taraf mawafiqat ho sakti hai Aur twizzer bottom pattern aik intra forex trading marketing mein signal KY taour pr kaam aata hy Jo keh hamein loss Aur profit KY baary mein inform krta hy aur yeh hamein bahot benefits bhi deta hy Aur seh marketing mein indicator ky tour par Jana jata hy Aur yeh hamary Liye mufeed sabit hota hy

                TYPES OF TWIZZER BOTTOM PATTERN:


                FIRST TWIZZER BOTTOM PATTERN:


                Tweezers bottom candlestick pattern main pehli candle aik strong real body main banti hai, ye candle color main black ya red yanni bearish hoti hai. Pehli bearish candle prices main bearish trend ki mazboti dekhati hai jo k pattern k banne se pehle prices follow kar rahi hoti hai Aur yeh twizzer bottom pattern ka first part hota hy aur yeh small part hota hy yeh second part sy ziyada important nhi hota But yeh bhi hamary lye bahot useful proof hota hy

                SECOND TWIZZER BOTTOM PATTERN:

                Tweezers bottom candlestick pattern ki second day candle aik bullish trend ki candle hoti hai. Tweezers bottom candlestick pattern aur "Matching Low Candlestick pattern" dono dekhne main same lagte hen, lekin tweezer bottom pattern main dono candles ka bearish hona ya candles ka close point same honna zarori nahi hai Yeh bhi twizzer bottom pattern ka last part hota hy aur yeh main part KY Naam sy Jana jata hy Aur yeh hamary lye most important hy Q keh yeh hamein market mein signal KY tour par kaam krta hy Aur yeh signal ko uptrend show krwata hy jiss sy hum aany waly new customer ka pta chlta hy Aur hamein profit hasil hota hy

                EXPLAINATION OF TWIZZER BOTTOM PATTERN:


                Tweezer Bottom ka istemal karte waqt traders ko aur confirmatory indicators ka bhi istemal karna chahiye. Volume analysis trendlines aur doosre technical indicators ki madad se, traders ye dekh sakte hain ke kya market mein actual reversal hone ke chances hain ya nahi. Iske ilawa, kisi bhi trade mein enter karne se pehle stop-loss orders ka istemal karna bhi ahem hai taake traders apne positions ko protect kar sakeinJab k matching low pattern main candles ka low ya close price same pehli candle jaisa hota hai, jab k dosri candle pehli candle k close point main open hoti hai. Ye candle bhi aik strong real body wali candle hoti hai, jiss ka color black ya red hota hai Aur yeh intra forex trading marketing mein signal ko uptrend aur downtrend show krta hy agr signal uptrend hon gy tou hamein profit hasil Hoga agr signal downtrend hon gy tou hamein loss ka doubt hota hy But yeh kaam Thora riski tou hota hy but yeh kaam mushkill nhi hota Iss kaam ko sar anjaam deny KY lye experience ka hona zarori hei Q keh Market har mint baad ooper neechy ho rhi hoti hy But agr hum iss pattern ko follow krty hain tou hum successful business kr sakty hain Aur yeh pattern hamein bahot benefits deta hy

                UNDERSTANDING OF TWIZZER BOTTOM PATTERN:

                Tweezer Bottom ko samajhne ke liye sab se pehle samajhna zaroori hai ke ye kis tarah ka hota hai. Jab market mein downward trend hota hai aur prices ghat rahi hain toh tweezer bottom ek reversal pattern hai jo indicate karta hai ke market mein buyers ki shirkaat barh sakti hai aur bearish trend khatam ho sakta hai Aur hum uptrend ki janib jaany KY chances barh jaaty hain Aur phir hum profit ki taraf lote aaty hain phir hamein loss ka khadsha nhi hota AJ Kal All pattern market mein signal KY lye bahot use ho rhy hain Aur yeh hamein bahot ziyada profit dety hain Q keh iss ka istemal har jagah ho rha hy Aur iss pattern sy hum acchi earning kar sakty hain Aur apny business ko settle kr sakty hain Yeh pattern hamein online work mein bahot help dety hain jiss ki wajah sy hum Inka istemal ziyada krty hain
                • #9 Collapse

                  Tweezer Bottom Pattern


                  Click image for larger version

Name:	Tweezer-Patterns-pic-1.jpg.aspx
Views:	78
Size:	50.3 کلوبائٹ
ID:	12821041


                  "Tweezer Bottom" ek technical analysis term hai jo ke stock market ya financial charts mein istemal hoti hai. Yeh pattern market ke trend reversal ko indicate karne ke liye istemal hota hai. "Tweezer Bottom" pattern tab hota hai jab do consecutive candlesticks (mombatiyon) ka combination ek downtrend ke baad aata hai aur yeh indicate karta hai ke market mein selling pressure kam ho rahi hai aur potential hai ke trend reverse ho sakta hai.

                  Is pattern mein, pehla candlestick ek downward movement ko represent karta hai, jise "downtrend" kehte hain. Dusre candlestick mein bhi downward movement hota hai, lekin iski range pehle wale candlestick ki range ke andar hoti hai ya usse overlap karti hai. Isse yeh signal milta hai ke sellers ki strength kamzor ho rahi hai aur buyers ki entry ho sakti hai.

                  "Tweezer Bottom" pattern ke recognition ke liye, dono candlesticks ki body (main rectangle) aur shadow (upper aur lower lines) ka dhyan rakha jata hai. Agar dono candlesticks ke low points lagbhag same hote hain, toh yeh ek potential Tweezer Bottom pattern ho sakta hai.

                  Yeh pattern traders ko indicate karta hai ke market mein reversal hone ke chances hain, aur woh apne trading strategies ko adjust kar sakte hain. Hamesha yaad rahe ke kisi bhi technical pattern ko confirm karne ke liye, aur sahi trading decisions lene ke liye, dusri confirmatory signals aur risk management ka bhi dhyan rakha jana chahiye.

                  Yeh pattern sirf ek tool hai aur iska istemal market analysis ke doosre factors ke saath milake karna hota hai. Always remember ke market mein risk hota hai aur har trade carefully plan karni chahiye.
                  • #10 Collapse

                    Introduction of Tweezers Bottom Candlestick Pattern??

                    Tweezers bottom candlestick pattern two days candles par par mushtamil aik bullish trend reversal pattern hai, jo k prices k bottom par ya bearish trend k baad banta hai, ye pattern market main prices k mazzeed bearish na jane se rokne aur bullish trend reversal ka signal deta hai. Tweezers bottom candlestick pattern dekhne me same "Matching Low Candlestick Pattern" jaisa lagta hai, lekin tweezers bottom candlestick pattern main pehli candle bearish aur dosri bullish hona zarori hai. Tweezers bottom candlestick pattern k banne ki peche ki psychology kuch iss tarah se hoti hai, k jab bhi prices main pehli candle aik khas bearish point par close ho jati hai aur dosre din ki candle bullish banne k baad same pehli candle k low ko touch karne k baad upper par close hoti hai. Pattern ki dono candles k open aur close price aik dosre se opposite direction main hote hen.


                    Candles Formation.

                    Tweezers bottom candlestick pattern main dono din k candles different format ya trend yanni bullish aur bearish trend ki candles hoti hai. Ye candles same support position ko touch karke wapis hoti hai, jiss se prices mazzeed bearish nahi jati. Tweezers bottom candlestick pattern main candles ki formation darjazzel tarah se hoti hai;
                    rst Candle: Tweezers bottom candlestick pattern main pehli candle aik strong real body main banti hai, ye candle color main black ya red yanni bearish hoti hai. Pehli bearish candle prices main bearish trend ki mazboti dekhati hai, jo k pattern k banne se pehle prices follow kar rahi hoti hai.
                    Second Candle: Tweezers bottom candlestick pattern ki second day candle aik bullish trend ki candle hoti hai. Tweezers bottom candlestick pattern aur "Matching Low Candlestick pattern" dono dekhne main same lagte hen, lekin tweezer bottom pattern main dono candles ka bearish hona ya candles ka close point same honna zarori nahi hai. Jab k matching low pattern main candles ka low ya close price same pehli candle jaisa hota hai, jab k dosri candle pehli candle k close point main open hoti hai. Ye candle bhi aik strong real body wali candle hoti hai, jiss ka color black ya red hota hai.

                    Explaination.

                    Tweezers bottom candlestick pattern aik munfared pattern hai, jiss main shamil candles aik dosre se mukhtalef formate ya trend yanni bullish aur bearish hoti hai. Pattern low price area ya bearish trend main banta hai, jiss ki pehli candle aik strong real body main banne wali bearish candle hoti hai. Dosre din ki candle aik bullish candle hoti hai, ye candle pehli candle k close point k baad open ho kar same low banane k bad ooper close hoti hai. Pattern ki pehli aur dosree candle ka low ya close price same hone ki waja se ye aik strong support level ban jata hai.
                    example:

                    Trading tips.

                    Tweezers bottom candlestick pattern prices main double bottom pattern banati hai, yanni prices do dafa same price ya point se reject ho jati hai. Ye point prices k leye aik strong support level ka kaam karta hai, q k pattern ki dono candles same point se reject hoti hai, jo k bullish trend ki alamat hoti hai. Tweezers bottom candlestick pattern par trading karne k leye zarori hai, k prices bottom area ya bearish trend main hon. Dosra candlestick ki timeframe long term ki honni chaheye, jo kam az kam one-day se ziada ho. Tweezers bottom candlestick pattern par trading se pehle confirmation candle ka honna zarori hai
                    • #11 Collapse

                      Tweezer Bottom Pattern

                      Click image for larger version

Name:	download - 2024-02-03T003918.550.jpg
Views:	71
Size:	14.1 کلوبائٹ
ID:	12821127
                      Tweezer Bottom, jise Urdu mein "تویزر بوٹم پیٹرن" kehte hain, ek technical analysis pattern hai jo stock market mein istemal hota hai. Yeh pattern traders ko market mein hone wale trend reversals ka pata lagane mein madad karta hai. Is article mein, ham Tweezer Bottom pattern ki mukammal tafseelat par gaur karenge, samajhenge ke yeh kya hai, kaise kaam karta hai, aur iske istemal ke tajaweezat ke hawale se baat karenge.

                      Tweezer Bottom Pattern Kya Hai?

                      Tweezer Bottom ek candlestick pattern hai jo market mein hone wale bearish trend ke baad bullish reversal ko darust karti hai. Is pattern ko do consecutive candles se pehchana ja sakta hai jo neeche di gayi details par mabni hoti hain:
                      1. Pehli Candle: Tweezer Bottom pattern ki shuruaat ek bearish candle ke saath hoti hai. Yeh candle downward trend ko darust karta hai aur market mein sellers ki dominance ko represent karta hai.
                      2. Dusri Candle: Dusri candle bhi downward trend ko continue karta hai, lekin iski closing pehli candle ki opening ke bohot qareeb hoti hai. Is candle ki shadow (ya wick) pehli candle ki shadow ke neeche tak extend hoti hai, jise "tweezer" kehte hain.

                      Jab yeh pattern ban jata hai, to yeh indicate karta hai ke sellers ki power kamzor ho rahi hai aur buyers apne position ko strengthen kar rahe hain.

                      Tweezer Bottom Pattern Kaise Kaam Karta Hai?

                      Tweezer Bottom pattern ka kaam market mein hone wale trend reversal ko identify karna hai. Is pattern ke hone par traders ko yeh indication milta hai ke bearish trend ke baad bullish trend shuru ho sakta hai. Iske mukhtalif components ko samajhna aur interpret karna mahatvapurna hota hai:
                      1. Bearish Trend: Tweezer Bottom pattern tab kaam karta hai jab market mein pehle se hi bearish trend hai. Iska matlub hai ke sellers control mein hain aur prices neeche ja rahe hain.
                      2. Pehli Candle Ki Importance: Pehli candle bearish trend ko represent karta hai, aur iski length aur volume ka bhi dhyan rakhna zaroori hai. Agar pehli candle ka size bada hai, to yeh show karta hai ke sellers kaafi aggressive hain.
                      3. Dusri Candle Ki Role: Dusri candle, jo ki pehli candle ki opening ke qareeb close hoti hai, bullish reversal ki starting indicate karti hai. Is candle ki shadow pehli candle ki shadow ke neeche extend hoti hai, jo ek sign hai ke sellers ki strength kamzor ho rahi hai.
                      4. Volume Analysis: Volume bhi ek important factor hai. Agar tweezer bottom pattern ke sath high volume bhi dikhai de raha hai, to yeh confirm karta hai ke market mein strong reversal hone ke chances hain.

                      Tweezer Bottom Pattern Ka Istemal

                      Tweezer Bottom pattern ka istemal karte waqt kuch zaroori points ko dhyan mein rakhna zaroori hai:
                      1. Confirmation: Tweezer Bottom pattern ko confirm karne ke liye, traders ko doosre technical indicators ka bhi sahara lena chahiye jaise ke RSI (Relative Strength Index) ya MACD (Moving Average Convergence Divergence).
                      2. Stop Loss: Har trade mein stop loss ka istemal karna zaroori hai taki agar market against direction mein chala gaya to nuksan se bacha ja sake.
                      3. Risk Management: Har trading strategy mein risk management ka khyal rakhna zaroori hai. Tweezer Bottom pattern ko istemal karte waqt bhi risk ko control mein rakhna hamesha mahatvapurna hota hai.
                      4. Time Frame: Different time frames par Tweezer Bottom pattern ka istemal kiya ja sakta hai. Chhote time frames par ise confirm karna mushkil ho sakta hai, is liye traders ko is pattern ko identify karne ke liye multiple time frames ka istemal karna chahiye.

                      Conclusion:

                      Tweezer Bottom pattern ek powerful tool hai jo traders ko market mein hone wale trend reversals ka pata lagane mein madad karta hai. Is pattern ki sahi se samajh aur istemal se traders apne trading strategies ko improve kar sakte hain. Lekin, hamesha yaad rahe ke koi bhi single indicator ya pattern 100% guarantee nahi deta, is liye doosre technical analysis tools ka bhi istemal karna zaroori hai. Trading mein safalta paane ke liye, knowledge, experience aur discipline ka hona bohot zaroori hai.


                      • #12 Collapse

                        Tweezer Bottom Pattern


                        Click image for larger version

Name:	download (62).png
Views:	87
Size:	5.5 کلوبائٹ
ID:	12821169

                        "Tweezer Bottom" ek bullish reversal candlestick pattern hai jo market charts par paya jata hai. Ye pattern do candlesticks se banta hai aur typically downtrend ke baad aane wale potential uptrend ko indicate karta hai. Is pattern ko "Tweezer Bottom" is liye kaha jata hai kyunki ye do candlesticks hote hain jo neeche ki taraf ek doosre ke bilkul samne hote hain, jaise tweezer (chimti) dikhne wale do tangon ki tarah.

                        Yahan Tweezer Bottom pattern ke key characteristics hain:
                        1. Pehla Candle (Bearish):
                          • Pehla candlestick ek downtrend ko represent karta hai aur bearish hota hai.
                          • Ismein strong selling activity hoti hai, jiski wajah se price mein neeche ki taraf movement hoti hai.
                        2. Dusra Candle (Bullish):
                          • Dusra candlestick pehle wale bearish candle ki low level tak girta hai ya usse neeche tak jata hai, indicating further downward pressure initially.
                          • Lekin, iska close price pehle wale candle ki opening price se neeche nahi hota.
                        3. Volume Consideration:
                          • Volume ka bhi ek important role hota hai. Agar is pattern ke sath high volume dikhai deta hai, toh ye bullish reversal signal ko confirm karta hai.

                        Tweezer Bottom pattern ko traders uptrend ki shuruaat ya trend reversal ke indication ke liye dekhte hain. Jab do consecutive candles neeche girti hain aur doosri candle ka close pehli candle ki opening se neeche nahi hota, toh ye indicate karta hai ke selling pressure kamzor ho rahi hai aur potential buying ka signal hai.

                        Hamesha yaad rakhein ke kisi bhi candlestick pattern par bharosa karne se pehle, doosre technical indicators aur market factors ko bhi consider karna zaroori hai. Technical analysis mein patterns ko samajhne aur unka sahi istemal karne ke liye practice aur experience ki zarurat hoti hai.
                        • #13 Collapse


                          Tweezer Bottom Pattern in Forex Trading - Roman Urdu:

                          Tweezer Bottom Pattern:

                          Tweezer Bottom pattern ek technical analysis concept hai jo forex trading mein istemal hota hai. Yeh pattern market mein potential trend reversal ko darust karta hai, khaas karke downtrend ke baad. Is pattern mein do candlesticks shamil hote hain jo ek doosre ke neeche close hote hain.

                          Tweezer Bottom Pattern Ki Pechan:
                          1. Pehla Candlestick (Bearish): Pehla din ka candlestick ek downtrend ko darust karta hai. Is candlestick ka closing price neeche hoti hai aur overall range chhoti hoti hai.
                          2. Doosra Candlestick (Bullish): Doosre din ka candlestick, pehle din ke candlestick ke neeche close hota hai. Yeh candlestick upward move karta hai aur closing price pehle din ke candlestick ke close ke barabar ya thoda sa upar hoti hai.

                          Tweezer Bottom Pattern Ka Tafseel:

                          Tweezer Bottom pattern ka asal maqsad yeh hota hai ke doosre din ki strong buying activity se pehle din ke bearish sentiment ko poora khatam karna. Is pattern ki strength is baat mein hai ke doosre din ka candlestick pehle din ke candlestick ke neeche close hota hai, jo bullish reversal ke liye strong indication hai.

                          Tweezer Bottom Pattern Trading Strategies:
                          1. Confirmation: Tweezer Bottom pattern ki confirmation ke liye, traders dekhte hain ke doosre din ka bullish candlestick pehle din ke bearish candlestick ke neeche close hota hai. Yeh indicate karta hai ke bearish trend continue hone mein kamzori hai.
                          2. Volume Ka Barhna: Confirmation ke saath saath, traders volume ki bhi tafteesh karte hain. Agar second day ke doran volume barh raha hai, to yeh indicate karta hai ke market mein interest barh gaya hai aur potential reversal hone wala hai.

                          Stop-Loss Orders: Protective stop-loss orders ko tay karte waqt, traders pehle din ke bearish candlestick ke low ya doosre din ke candlestick ke low ke thode se neeche ek level rakh sakte hain.

                          Target Levels: Target levels ko tay karte waqt, traders pehle din ke high ko dekhte hain. Yeh unko malumat deta hai ke kitna potential profit ho sakta hai.

                          Ikhtetam:

                          Tweezer Bottom pattern market mein hone wale potential reversals ko darust karne mein madad karta hai. Traders ko is pattern ko samajh kar apne trading strategies ko behtar bana sakte hain aur market ke potential turning points ko pahchan sakte hain. Lekin, har pattern ki tarah, is pattern ko confirm karne aur sahi trading decisions lene ke liye doosre technical indicators ki bhi zarurat hoti hai.

                          • #14 Collapse

                            Tweezer Bottom Pattern

                            Click image for larger version

Name:	download (66).png
Views:	125
Size:	5.5 کلوبائٹ
ID:	12821202

                            Tweezer Bottom Pattern ek bullish reversal pattern hai jo market charts par dikhai deta hai. Ye pattern typically downtrend ke baad aata hai aur indicate karta hai ki bearish momentum weaken ho sakta hai aur bullish reversal hone ke chances hain. Tweezer Bottom Pattern mein do consecutive candles hote hain, jinmein pehla candle bearish hota hai aur dusra candle bullish hota hai.
                            Tweezer Bottom Pattern Ki Khasiyat:
                            1. Pehla Candle (Bearish):
                              • Pehla candle downtrend mein hota hai aur bearish hota hai, indicating that the sellers are in control. Is candle ka real body lower range mein hota hai.
                            2. Dusra Candle (Bullish):
                              • Dusra candle bhi downtrend mein hota hai, lekin iska opening price pehle candle ke closing price ke kareeb hota hai. Dusra candle bullish hota hai aur iska real body pehle candle ke real body ke upper range mein hota hai.
                            Tweezer Bottom Pattern ka Tafsili Bayan:


                            Tweezer Bottom Pattern ka formation, jab sahi taur par identify hota hai, to ye show karta hai ke sellers ka control weaken ho raha hai aur buyers strength gain kar rahe hain. Dusra candle, jo pehle candle ke upper range mein fit hota hai, indicate karta hai ki buyers ab control mein hain aur market mein bullish reversal hone ki possibility hai.
                            Tweezer Bottom Pattern ke Sath Trading:
                            1. Confirmation ke Liye Wait Karein:
                              • Tweezer Bottom Pattern ko confirm karne ke liye traders doosre technical indicators ka istemal karte hain, jaise ki volume analysis, trend lines, ya doosre candlestick patterns.
                            2. Volume Analysis:
                              • Volume analysis bhi important hai. Agar Tweezer Bottom Pattern ke formation ke samay volume significant hai, to ye pattern aur bhi reliable ho sakta hai.
                            3. Support aur Resistance Analysis:
                              • Is pattern ke context mein support aur resistance levels ka bhi analysis karna important hai.
                            4. Risk Management:
                              • Apne trades ko effectively manage karne ke liye stop-loss orders set karein. Aap apne risk tolerance ke mutabiq stop-loss levels decide kar sakte hain.
                            5. Doosre Signals ke Sath Confirmation:
                              • Tweezer Bottom Pattern ko confirm karne ke liye doosre technical signals ka bhi dhyan rakha jata hai, jaise ki trend reversal indicators ya momentum oscillators.

                            Hamesha yaad rahe ki kisi bhi single candlestick pattern par pura bharosa na karen aur doosre technical factors ko bhi madde nazar rakhen trading decisions mein. Price action, volume analysis, aur trend analysis ko milake istemal karna trading decisions ko mazboot banata hai.
                            • <a href="https://www.instaforex.org/ru/?x=ruforum">InstaForex</a>
                            • #15 Collapse

                              Tweezer Bottom

                              tweezer bottom ek bulish reversal pattern hai jo compost Kiya Jata Hai do Japanese candlestick ko uske matching bottom Mein hum appear karte hain bottom of down trend freezer bottom matching ke साथ-साथ ham generally compost karte hain shadows ko jo ke candles ki body hai iske sath ham ismein appear karte hain during the down trend hum jab bhi salary push Karta Hai price ko niche ki taraf to frequently ending mein session mein ham near dekhte hain ki yahan se hamara push koi bhi bottom value Mein ham journalist ke sath bole Shri varsal pattern ko indicate karte hue market Mein ham chat ko indicate karke reversal akad Mein dekhte yah pattern impulse Kiya Jata Hai selling pressure decrease karte hain Yahan se Kisi bhi trend ko

                              Click image for larger version

Name:	tweezer-bottom-candlestick-chart-pattern-japanese-candlesticks-pattern-bullish-candlestick-pattern-tweezer-bottom-forex-stock-cryptocurrency-chart-pattern-buy-sell-signal-pattern-vector.jpg
Views:	60
Size:	137.7 کلوبائٹ
ID:	12821448
                              What Is Tweezer Bottom Double Candlestick Pattern?

                              tweezer bottom double candlestick pattern ek bullish reversal pattern hai jo compost Kiya Jata Hai do Japanese candlestick ko uske matching bottom Mein hum appear karte hain bottom of down trend freezer bottom matching ke ham generally compost karte hain shadows ko jo ke candles ki body hai iske sath ham ismein appear karte hain during the down trend hum jab bhi salary push Karta Hai price ko niche ki taraf to frequently ending mein session mein ham near dekhte hain ki yahan se hamara push koi bhi bottom value Mein ham journalist ke sath bole Shri varsal pattern ko indicate karte hue market Mein ham chat ko indicate karke reversal akad Mein dekhte yah pattern impulse Kiya Jata Hai selling pressure decrease karte hain Yahan se Kisi bhi trend ko

                              What Does Tweezer Bottom Pattern Indicate?

                              Begin trading user pattern Mein ham if efficient change the momentum between Jo hamara first candle ke second half Mein hota Hai ismein ham dekhte hain ki yah pattern useful hote hain trading Mein jab bhi ham signify karte hain conclusion core full back karte hain trade ki direction ko train ke sath aur stop loss ki ham position mein bahut above or below pair ko tuter karte hain aur use karte hain candle ko jo appear kiye Jata Hai pattern ko verify signal ke short term reversal per

                              When Should I Begin Trading for Tweezer Patterns?

                              tweezer bottom candlestick pattern ke sath ham ab train ko follow Karte immediately tuition bottom candlestick formation Mein ham dekhte hain ki jo hamara above chart Hai vah show Karta Hai do candlesticks ko jiske sath ham same hai aur lo values ko dekhte hain ham reserve karte hain downtron ko jiske represent Mein ham dekhte hain first red candle aur iske result Mein upward movement ko denot Karte Hain Ki hamara long green Jo formation hai uske sath ham result ko note Karen aur ham range break out ko consider karke rise dekhte hain likely ho Jo hamara possible price reversal ho

                              اب آن لائن

                              Working...
                              X